Author Affiliations
College of Information Science and Engineering, Ocean University of China, Qingdao, Shandong 266100, Chinashow less
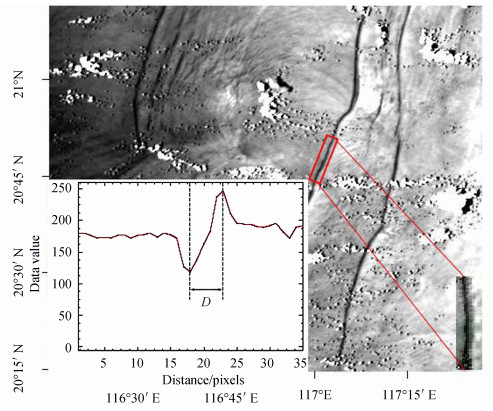
Fig. 1. The ISWs on MODIS optical remote sensing images. The insert map is the grey image of a single ISWs and the spatial profile of the leading wave which indicated by the red box
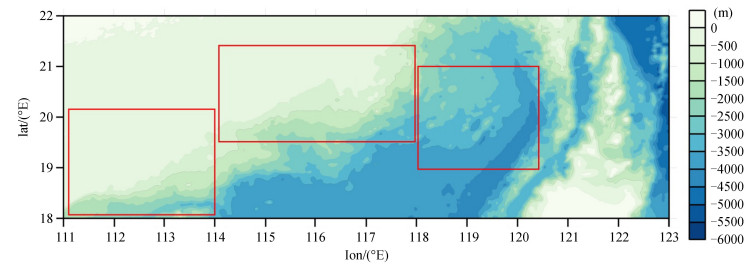
Fig. 2. Two-dimensional topography of South China Sea
Fig. 3. The topological structure of the BP neural network
Fig. 4. ISWs observed in the MODIS image at 11:15 (UTC+8), Wenchang area, on May 14, 2005
Fig. 5. Isotherm profile of the measured position in Wenchang on May 14, 2005
Fig. 6. 南海北部海域内孤立波振幅分布Amplitude distribution of ISWs in the South China Sea
Fig. 7. 南海北部内孤立波振幅与水深关系Relationship between the depth of water and amplitudes of ISWs in the South China Sea
Fig. 8. MODIS内孤立波图像,红点为内孤立波提取位置The ISWs on MODIS optical remote sensing images. The red dot is the extracted positions of ISWs
Fig. 9. 单条内孤立波的振幅分布The amplitudes distribution of ISWs, and the colored dots indicate the amplitude position
Fig. 10. 内孤立波振幅与水深关系Relationship between the depth of water and amplitudes of ISWs
Characteristic parameter | ISW1 | ISW2 | ISW3 | … | ISW2260 | Small gradient strength | 0.46 | 0.55 | 0.49 | … | 0.47 | Large gradient strength | 440.45 | 378.87 | 406.81 | 410.60 | Grey uneven representation | 33.37 | 34.97 | 19.41 | 10.75 | Gradient uneven representation | 64.07 | 81.06 | 51.16 | 77.71 | Energy | 0.06 | 0.15 | 0.06 | 0.02 | Grey mean | 87.87 | 223.71 | 152.02 | 118.75 | Gradientmean | 15.24 | 12.82 | 14.13 | 14.29 | Grey mean square | 28.30 | 31.12 | 27.52 | 55.41 | Gradient mean square | 14.43 | 14.65 | 14.39 | 14.37 | Relevance | -54.67 | -252.92 | -173.96 | -28.10 | Grey entropy | 0.92 | 0.91 | 1.02 | 1.42 | Gradient entropy | 0.60 | 0.49 | 0.59 | 0.60 | Mixing entropy | 1.35 | 1.18 | 1.36 | 1.76 | Inertia | 6 394.07 | 46 164.50 | 20 324.87 | 14 243.93 | Inverse gap | 0.000 33 | 0.001 1 | 0.008 2 | 0.000 24 | Peak-to-peak distance/m | 787.77 | 786.83 | 722.12 | 793.28 |
|
Table 1. The characteristic parameter based on MODIS images of ISWs
BP neural network | Number of hidden layers | Number of neurons of hidden layers | Learning rate | Number of iterations | Model 1 | 1 | 29 | 0.7 | 500 | Model 2 | 2 | 36, 15 | 0.7 | 550 | Model 3 | 3 | 34, 15, 4 | 0.4 | 550 | Model 4 | 4 | 34, 16, 4, 2 | 0.4 | 600 |
|
Table 2. Parameter setting of BP neural network model
MODIS image | Observation/m | Calculated result | Model 1/m | Model 2/m | Model 3/m | Model 4/m | NLS model/m | MOD02QKM.
A2005109.0320.005.2010151175606 | 16.4 | 19.1 | 19.9 | 18.3 | 18.8 | 19.4 | MOD02QKM.
A2005118.0315.005.2010151231239 | 20.7 | 21.7 | 20.3 | 20.2 | 20.1 | 20.3 | MOD02QKM.
A2005132.0325.005.2010152153956 | 22.9 | 20.2 | 25.7 | 23.1 | 20.8 | 23.8 | MOD02QKM.
A2005136.0300.005.2010160003722 | 27.9 | 23.2 | 26.2 | 28.6 | 26.5 | 27.3 | MOD02QKM.
A2005180.0325.005.2010154061045 | 16.2 | 16.8 | 15.8 | 17.3 | 16.0 | 15.8 | MOD02QKM.
A2005134.0315.005.2010152164511 | 17.1 | 19.9 | 18.9 | 18.3 | 18.1 | 19.3 | MYD02QKM.
A2005140.0540.005.2009230130725 | 23.8 | 28.9 | 25.7 | 30.3 | 24.9 | 21.8 | MYD02QKM.
A2005179.0545.005.2009232072407 | 15.6 | 17.3 | 17.5 | 16.8 | 16.6 | 17.0 | MOD02QKM.
A2013183.0255.061.2017299083504 | 42.0 | 35.9 | 31.2 | 39.4 | 38.4 | 47.1 | Average error/% | | 13.0% | 11.2% | 8.1% | 6.5% | 7.9% |
|
Table 3. Calculated and observed amplitudes of the ISWs