
Ming Shen, Yanxin Li, Qianying Li, Xuewen Shu. Random fiber laser using a cascaded fiber loop mirror[J]. Advanced Photonics Nexus, 2024, 3(3): 036009
- Advanced Photonics Nexus
- Vol. 3, Issue 3, 036009 (2024)
Abstract
1 Introduction
Random lasers have attracted extensive attention due to their rich physical properties1,2 and multiple applications such as sensing,3,4 imaging,5
In recent years, a variety of artificial scattering media with enhanced scattering has been proposed and demonstrated to be good candidates for random lasing. They further shorten the required fiber length to a meter level. Different kinds of polymer fibers have been proposed to achieve random lasing. Researchers doped dye molecules,19 ferromagnetic nanoparticles,20 and scattering nanoparticles21 into polymer fibers to tune the random lasing behavior. Other works such as self-healing hydrogel fiber based on a metal–organic framework22 and nanowire composite doped with TiN nanoparticles23 also provide great tunability to the RFL. But these works could require a relatively complex fabrication process. The development of laser micromachining greatly enhances the fabrication flexibility of artificial scattering media. A random phase-shift fiber Bragg grating (FBG) is fabricated with the beam-scanning method and used to achieve narrow bandwidth RFL.24 The femtosecond direct-writing technique can induce refractive index inhomogeneities in the fiber core to enhance the Rayleigh scattering.25 Extensive studies based on random fiber gratings have been conducted, such as single-frequency random lasing,26 lasing mode selection,27 and high-power single-peak Raman RFLs.28 A random Fabry–Pérot (F-P) cavity array based on Au-film-coated fiber reflector is another choice for random lasing by light localization.29 Although these artificial scattering media provide much fabrication flexibility, the requirement of specific expensive fabrication equipment hinders further application. Therefore, finding new cost-effective artificial scattering media with ease of fabrication would greatly facilitate the application of RFLs. Moreover, it is of significant interest to enrich the RFL category because it has become an important platform for multidisciplinary studies where Lévy statistics,30 replica symmetry breaking,31 optical turbulence-like behavior,32 and temporal optical rogue waves33 are found and discussed.
In this paper, we propose and demonstrate a novel RFL based on a cascaded fiber loop mirror (CFLM). Fiber loop mirrors (FLMs) are commonly used as broadband fiber mirrors.34 Here, we cascaded up to 10 FLMs (10-CFLM) to obtain a chaotic reflection spectrum with greatly enhanced reflectivity. The transmission and reflection characteristics of the CFLM were simulated by the transfer matrix method and coincided well with the measured results. Random lasing with a 10-CFLM was achieved and the Lévy–Gaussian distribution transition was observed. The RFL operated in the single longitudinal mode (SLM) near the threshold and time-varying multilongitudinal mode at high pump powers. Complex lasing behaviors at different pump powers with different numbers of FLMs were discussed. Theoretical analysis shows the operation mechanism of intracavity lasing longitudinal modes, where complex mode competition and mode hopping have a great influence on the output characteristics.
Sign up for Advanced Photonics Nexus TOC. Get the latest issue of Advanced Photonics Nexus delivered right to you!Sign up now
2 Experimental Setup
2.1 CFLM Simulation and Characterization
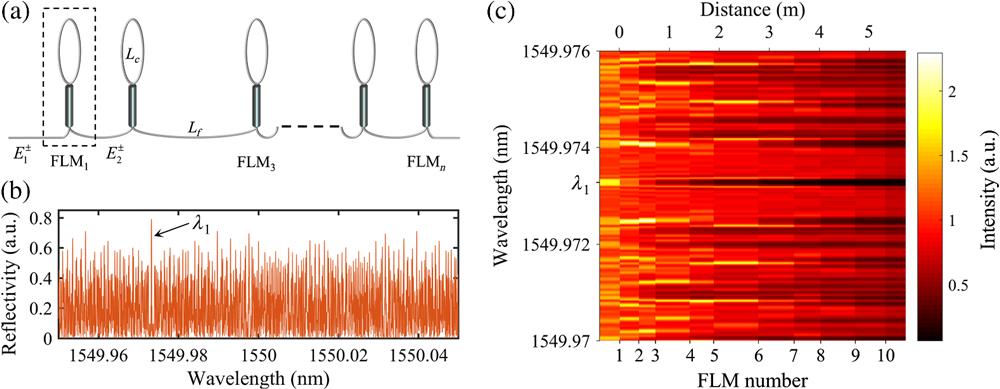
The schematic of the CFLM is shown in Fig. 1(a). The FLM is made by connecting the two ports on the same side of a fiber coupler. Several FLMs with fiber loop length are connected in series with adjacent distance . The transmission and reflection characteristics of the cascaded FLM can be analyzed by the transfer matrix method. As shown in the dotted box in Fig. 1(a), an FLM with two ports can be described as35
![]()
Figure 1.(a) Schematic of the CFLM. Simulated (b) reflection spectrum and (c) spatial intensity distributions of the 10-CFLM.
The reflection spectrum becomes more chaotic as the number of FLMs increases. For simplicity, we choose 10 FLMs, and the , , and of them are set to 0.01, 0.015, and 0.4 m, respectively. Each FLM has a calculated reflectivity of , which yields a moderate reflectivity and transmissivity after the cascade operation. Nine adjacent distance are randomly distributed from 0.3 to 1 m, which are 0.35, 0.31, 0.65, 0.45, 0.86, 0.69, 0.52, 0.66, and 0.59 m, and they add up to 5.08 m. The fiber fusion loss of 0.999 is used to replace the small loss of fiber. The calculated reflection spectrum is shown in Fig. 1(b) with a wavelength step of 0.01 pm, where the maximum reflectivity is 79.1% at the wavelength (1549.973 nm). The chaotic spectrum has the same trend as other reported random media.29,36 The multiple spikes may support several modes in the laser, and some of the modes may prevail in the mode competition and start lasing. Figure 1(c) shows the simulated spatial intensity distribution inside the 10-CFLM by the transfer matrix method.37 Many “hot spots” at random wavelengths are observed between the second and the sixth FLMs, which has also been reported in other works.38,39 The spatial intensity distribution at follows an exponential decay, as shown in Fig. S1(a) in the Supplementary Material, which demonstrates the Anderson localization effect in the CFLM.39
The obvious change of the transmission and reflection characteristics of the CFLM with a small change of is understandable because the effective length of the F-P cavity formed by the adjacent FLMs is changed. We further simulated the situations with fluctuating parameters and . Random errors of [−5 5] mm and [−0.005 0.005] were added to 10 and values, respectively. The results are shown in Figs. 2(a1) and 2(a2), respectively; Fig. 2(a3) is the enlarged view near of Fig. 1(b) for comparison. The change of changes the effective length of the F-P cavity, thereby changing the reflection spectrum of the CFLM. The reflection spectrum is highly sensitive to the cavity length and has a totally different characteristic, as shown in Fig. 2(a1). However, the only influences the reflectivity of the FLM and causes the overall rise or fall of the spectrum, as shown in Fig. 2(a2). To fabricate such a CFLM, we first choose 10 single-mode fiber couplers with the same coupling constant () and make each of them form an FLM with a loop length of 0.4 m by splicing two ports of each coupler. Then, we splice these 10 FLMs one by one according to the adjacent distances designed above. We measured the transmission and reflection spectra of the 10-CFLM with a light-wave measurement system (8164A, Agilent, Santa Clara, CA, U. S.). Figure 2(b) shows the measured results with 0.1 pm resolution. The larger wavelength step results in missing some details, but multiple spikes can still be observed. The enlarged view of the 40 pm span in Fig. 2(b3) shows random spikes with spacings of the pm level. The mean transmissivity is , and the localization length, calculated from the equation ,40 is , where is the effective length of the 10-CFLM. The Anderson localization effect should appear in the proposed 10-CFLM, since the localization length is smaller than the effective length.39
![]()
Figure 2.Simulated reflection spectra of the 10-CFLM at
![]()
Figure 3.Experimental setup. LD, laser diode; WDM, wavelength division multiplexer; EDF, erbium-doped fiber; CFLM, cascaded fiber loop mirror; ISO, isolator.
2.2 Laser Setup
The setup of the proposed RFL is illustrated in Fig. 3. The pump source is a 976 nm laser diode (LD) and is coupled into the cavity through a wavelength division multiplexer (WDM). An FBG with 1550 nm center wavelength, 63% peak reflectivity, and 50 pm full width at half-maximum (FWHM) is used to select the lasing wavelength. The CFLM provides random feedback and is inserted between a commercial erbium-doped fiber (EDF, I-25, Fibercore, Southampton, U. K., 1.5 m) and an isolator. The laser outputs after the isolator.
3 Laser Characterization
The 10-CFLM was used first in the experiment. Figure 4(a) shows the output spectra measured using an optical spectrum analyzer (OSA, AQ6370C, Yokogawa, Tokyo, Japan) with a 4-pm sampling interval. The optical signal-to-noise ratio reaches as high as 65 dB at the maximum pump power of 168 mW, and the FWHM remains below 20 pm. The output spectrum may show an abrupt deviation from the stable bell-shaped profile to a flat-top profile when we increase the pump power, as shown in the inset of Fig. 4(a). However the output spectrum will eventually stabilize to the same as in Fig. 4(a). Figure 4(b) shows the output power curve of the RFL, and the threshold is below 15 mW. The measured results follow a linear distribution, and the slope efficiency is .
![]()
Figure 4.(a) Output spectra at the pump powers of 22 and 168 mW. Inset is the output spectrum right after the increase of pump power. (b) Output power versus pump power.
We measured the longitudinal mode performance using a confocal scanning F-P interferometer (SFPI, SA200-12B, Thorlabs, Newton, NJ, U. S., 1.5 GHz FSR). Figure 5(a1) shows that the RFL operates in the SLM at low pump powers (22 mW), which has also been reported in other RFLs.38,41,42 The SLM operation maintains a pump power range from the threshold to . When we further increase the pump power (75 mW), the measured result changes to a time-varying random multilongitudinal mode operation, as typically shown in Figs. 5(a2) and 5(a3). This result is highly sensitive to environmental changes such as wind. The longitudinal mode envelopes would only change their amplitude at the moment we increase the pump power, and then, new modes would appear. The working principle could be as follows. Higher gain is provided by higher pump powers, which is first experienced by the existing longitudinal modes. Then, more longitudinal modes start to oscillate under higher gain and compete for the pump in the EDF,43 which also explains the reason for the flat-top spectrum in the inset of Fig. 4(a). The radio-frequency spectrum is measured using an electrical spectrum analyzer (FSH20, Rohde & Schwarz, Munich, Germany) and averaged by 20 measurements, as shown in Fig. 5(b). The averaged beat peaks are different from every single measurement because of the time-varying random multilongitudinal mode operation and the slow response speed of the electrical spectrum analyzer. Each single measurement exhibits some different beat peaks, as shown in Fig. S2(c) in the Supplementary Material, and caused the small peak intensity after the average operation. To further understand the measured results, we collected the time series and applied the Fourier transform to obtain the frequency information, which shows similar time-varying beat peaks (details in Sec. A in the Supplementary Material).
![]()
Figure 5.Longitudinal mode envelopes under the pump powers of (a1) 22 mW and (a2) and (a3) 75 mW. (b) Averaged radio-frequency spectra at two different times at the pump power of 168 mW.
Recently, a transition from Gaussian to Lévy to Gaussian distribution of the spectral intensity dynamics has been observed in many RFLs, where the change happens around the lasing threshold.30,44,45 The distribution of spectral intensity dynamics can be described by the Lévy index . The Gaussian distribution is with , and the Lévy distribution is with . Here, we measured 1200 output spectra in an hour at different pump powers and calculated the probability density function (PDF) of the peak spectral intensity. The -stable Lévy distribution is fitted to the PDF, and the variation of the index is plotted in Fig. 6. The Lévy distribution () appears around the lasing threshold (15 mW), and the Gaussian distribution () appears below and well above the threshold.
![]()
Figure 6.Variation of the Lévy index
It is obvious that more FLMs provide more randomness. When there is only one FLM, the laser cavity length is fixed, and a conventional laser is formed. Its radio-frequency spectrum is shown in Fig. 7(a1), and the peak at 18.41 MHz corresponds to a calculated cavity length of . When the number of FLMs increases, any two FLMs form a subcavity, and the Vernier effect between them filters the lasing modes.35 When there is only a small number of FLMs, three for instance (3-CFLM), the reflection spectrum is still of high regularity (Fig. S3 in the Supplementary Material). We chose the first three FLMs of the 10-CFLM (, 0.31 m); the averaged radio-frequency spectrum is shown in Fig. 7(a2). The circle-marked peak at 128.7 MHz corresponds to a calculated cavity length of , which equals the length of the F-P cavity formed by the first two FLMs. The first two FLMs play the leading role because the former FLMs reflect more of the laser. The peak at 18.41 MHz (with one FLM) is not seen because of the mismatch among different cavity lengths. Many lower peaks appear around the maximum peak, which is further discussed in Sec. B in the Supplementary Material. The measured longitudinal mode envelopes in Fig. 7(b) show more modes than Fig. 5(a) because more longitudinal modes could oscillate with the 3-CFLM (Sec. B in the Supplementary Material), while for 10-CFLM, the reflection spectrum shows a chaotic feature, and the spacing of some reflection peaks may be comparable to the FWHM of the FBG used. Then, most longitudinal modes would be filtered out by the joint action of the CFLM and FBG. The small number of lasing modes and the time-varying mode operation make it hard for the real-time measurement of the beat peaks. Nevertheless, the reflection spectrum is highly sensitive to changes in fiber length, according to the simulation. The longitudinal mode with the highest gain in the FWHM of the FBG used would change with time and result in the time-varying random multilongitudinal mode behavior.
![]()
Figure 7.Radio-frequency spectra with (a1) one and (a2) three FLMs. (b) Longitudinal mode envelopes with three FLMs at different times.
4 Longitudinal Mode Simulation
We further simulated the lasing condition in the proposed RFL within a bandwidth of 2.5 GHz (20 pm) centered at the maximum reflectivity () in Fig. 1(b). The lasing longitudinal mode should satisfy both the phase and gain–loss conditions.41,46 Modes of different frequencies are scattered back from the CFLM with different phase values, and their phase profile, , can be calculated from the reflection spectrum. Then, the phase condition can be described as
![]()
Figure 8.(a) Simulated phase of the electromagnetic field after a round trip as a function of frequency (offset from 193.55 THz). The red points are the solutions of phase conditions. (b) Adjacent longitudinal mode spacing counts from phase conditions. (c) Lasing modes count at different gains. Inset is the enlargement near the
5 Conclusion
In conclusion, we proposed and demonstrated a novel RFL based on the CFLM. The transmission and reflection characteristics of the CFLM were analyzed by the transfer matrix method. The experimentally measured results showed a chaotic spectrum with many narrow spikes, which coincides well with the simulation results. The 10-CFLM met the requirement of Anderson localization. Such an RFL also obeyed the Lévy–Gaussian distribution transition observed in many RFLs. The proposed RFL operated in a stable SLM at low pump powers. Further increasing the pump power, the RFL operated in a time-varying multilongitudinal mode. Different numbers of FLMs were applied and discussed. Theoretical analysis of lasing modes provides evidence for the SLM operation and reveals the impact of complex mode competition and mode hopping on the output characteristics.
Nowadays, a variety of random feedback structures have been proposed to promote the development and application of RFLs. The CFLM in this work is a completely new and random feedback structure other than the scattering-enhanced special fibers and laser micromachined devices. It is composed of commonly used fiber couplers and connected by a fiber fusion operation and thus does not require any complex fabrication process or expensive fabrication equipment. In addition, the proposed CFLM can be theoretically simulated in detail to better reveal its effect on the RFL. The radio-frequency spectra show interesting phenomena due to the multiple F-P cavities formed in the CFLM, which is briefly discussed here and worth further investigating in the future. Compared with the recent work where 11 fiber reflectors with Au-film-coated facets are connected in series through flanges,29 the CFLM based on fiber fusion operation should have better reusability for superresolution spectroscopy applications. The weak saturable absorption effect in each FLM, also known as a nonlinear optical loop mirror,47 provides a platform for the analysis of cascaded effects for pulsating operation. Further changes to the fiber loop section can provide more functions, such as a stronger saturable absorption effect with active gain48 and optical switching with injected control light.49 The proposed RFL may be a good candidate for the random bit generation50 after increasing the number of intracavity modes with broadband FBGs or reflectors. Multiple modifications in the cascade operation should provide interesting results and are worth the effort. The proposed CFLM enriches the RFL category and should be a novel platform for multidisciplinary studies in complex systems, which has good potential for scientific research and practical applications.
Ming Shen received his BS degree from the University of Electronic Science and Technology of China, Chengdu, China, in 2019. He is currently pursuing his PhD in Wuhan National Laboratory for Optoelectronics, Huazhong University of Science and Technology, Wuhan, China. His research interests include random fiber lasers and femtosecond laser writing.
Yanxin Li received her BS degree from the Changchun University of Science and Technology, Changchun, China, in 2019. She is currently working toward a PhD in the Wuhan National Laboratory for Optoelectronics, Huazhong University of Science and Technology, Wuhan, China. Her research focuses on optics turbulence and fiber lasers.
Qianying Li received her BS degree from the Hubei University of Technology, Wuhan, China, in 2017 and her MS degree from the University of Sydney, Sydney, Australia, in 2020. She is currently working toward a PhD in Wuhan National Laboratory for Optoelectronics, Huazhong University of Science and Technology, Wuhan, China. Her research interests focus on fiber lasers.
Xuewen Shu (a senior member, IEEE; fellow, Optica) received his PhD from the Huazhong University of Science and Technology, Wuhan, China, in 2000. He is currently a full professor at the Wuhan National Laboratory for Optoelectronics, Huazhong University of Science and Technology, Wuhan, China. His research interests include fiber gratings, optical fiber communications, fiber lasers, and optical fiber sensors.

Set citation alerts for the article
Please enter your email address
© Copyright 2018-2021 | Chinese Laser Press. All Rights Reserved 沪ICP备15018463号-20