Microlasers based on high quality (Q) whispering-gallery mode (WGM) resonance are promising low threshold laser sources for bio-sensing and imaging applications. In this Letter, dye-doped polymer microspheres were fabricated by a controlling emulsion solvent evaporation method. WGM lasing with low threshold and high Q factors was realized in an individual microsphere under femtosecond laser pumping. The slight change of environmental relative humidity (RH) can be monitored by measuring the shift of the lasing modes at the exposure of water molecules, which demonstrates the sensitivity is as high as 6 pm/RH%. The results would offer an insight into employing microlasers as sensors.
The control of relative humidity (RH) is extremely fundamental in many industrial processes and human life, including meteorology, agriculture, and medical operations. A large amount of humidity detection devices that monitor RH have been explored mainly based on the principles of optics and electronics. It is well-known that optical approaches for humidity sensing have many outstanding advantages, including immunity to the electrical and vibrational sources of noise, explosion proof, remote sensing, small size, and the possibility of multimode detection integrated in an optical device compared to conventional electronic detection approaches[1]. One main optical approach is based on whispering-gallery mode (WGM) microcavities, which have high quality (Q) factors and small mode volume[2,3]. Because a portion of the optical field (the so-called evanescent tails) slightly extends into the environment, WGM cavities and their resonant wavelengths are inherently sensitive to the refractive index changes of the surroundings or the binding of biological/chemical molecules to the resonator surface. For instance, Zhang et al. have demonstrated the use of non-resonating hydrogel spheres coupled to an optical fiber core as an RH optical sensor. Due to the fact that the refractive index of the hydrogel changes with the ambient humidity, the light is scattered out from the core of the fiber in a different amount, and, consequently, the tapered fiber transmittance changes[4].
However, the study of the WGM sensor is mainly concentrated in the field of a passive cavity. From the application point of view, the detection schemes of most solid WGM sensors usually adopt tapered fibers or prism coupling configurations, which are bulky and difficult to apply in the micro- and nanoscale sample environments. This problem can be solved in the high Q microlasers that are achieved by incorporating optical gain media, which are desired to have a better sensitivity[5]. Dye-doped polymer hemispheres with a diameter 53 μm were applied in refractive index sensing, and the sensitivity of 103 nm perrefractive index unit (RIU) was achieved[6]. According to the requirements of practical applications, there is some urgent need of lasing with miniaturized dimensions, which is more important in sensing in the micro scale, such as sensing in cells. However, the Q factor of WGM microcavities decreased with the diameter because the bending radiation loss of circular resonators shows an exponential decline with their diameters, which is not beneficial for sensing purposes, as it amplifies the interferences of amplitude noise and spectral resolution. Thus, the design of high Q and compact size WGM cavities should be proposed in sensing areas.
In this Letter, high Q and compact size organic WGM resonators were obtained by controllably evaporating the solvent of the emulsion solution. Optically pumped lasing action is observed at room temperature from the dye-doped microspheres by using a micro-photoluminescence (μ-PL) system. Lasing performances were explored by experiment and finite-difference time-domain (FDTD) simulation. By measuring the shift of their lasing modes, we successfully monitored the slight change of environmental RH. The sensitivity of polymer microlasers is up to 6 pm/RH%.
Sign up for Chinese Optics Letters TOC. Get the latest issue of Chinese Optics Letters delivered right to you!Sign up now
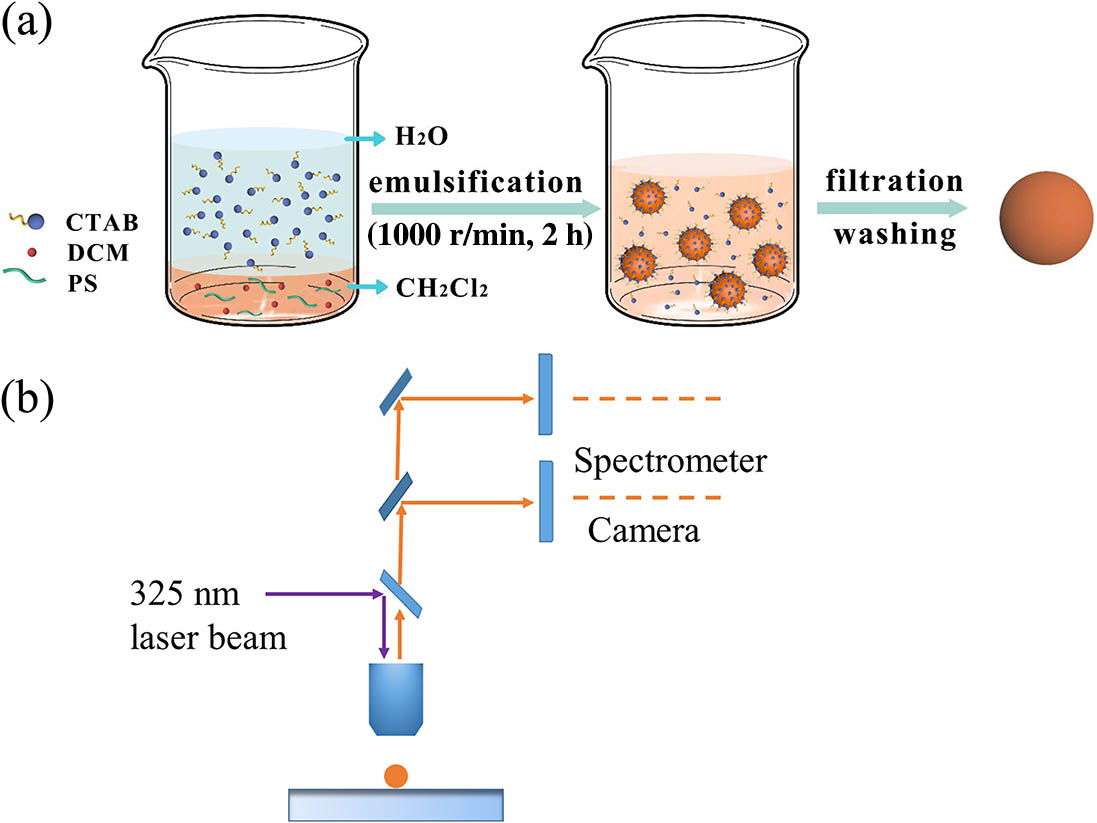
The polymer microspheres were prepared with an emulsion solvent evaporation method, as reported before[5]. The experiment process for fabrication of lasing cavities was shown in Fig. 1(a). Specifically, 50 mg polystyrene (PS) particles were dissolved in 500 μL . Then, 2 mg organic dyes 4-(dicyanomethylene)-2-methyl-6-(4-dimethylaminostyryl)-4H-pyran (DCM) were mixed with PS emulsion. After that, it was stirred for 20 min and sonicated two times using a probe-type sonicator at 90 W for 5 min each for organic dyes’ uniform distribution. Then, 30 mg surfactant cetyltrimethylammonium bromide (CTAB) was dissolved into deionized water and poured into PS emulsion. Under vigorous stirring, residual was evaporated, and PS emulsion will become PS microspheres. Then, PS microspheres were washed by deionized water and alcohol. Finally, the precursors were dried at 60°C for 4 h.
Figure 1.(a) Schematic diagram of the growth mechanism of the PS/DCM microspheres. (b) Schematic diagram for the optical measurement.
The spontaneous and stimulated spectra of the microspheres are measured using a μ-PL system, in which a femtosecond pulse laser (pulse duration 150 fs, repetition rate 1000 Hz, operating at 325 nm) is focused on the sample through an optical microscope (OLYMPUS BX53 F), as can be shown in Fig. 1(b). The data was collected by an optical multichannel analyzer with a resolution of 0.09 nm (Princeton, Acton SP2500i).
Figure 2 presents the scanning electron microscope (SEM) images of PS microspheres. A typical spherical structure is exhibited by the SEM images with a 45° tilt and top view, as shown in Fig. 2(b). The diameter of the sphere is about 3.7 μm. The circular boundary and smooth surface are favorable for WGM resonance.
Figure 2.(a) The top view and (b) 45° view of SEM images of DCM-doped polymer microspheres.
Figure 3(a) shows the μ-PL spectra of the 3.7 μm microsphere under different pumping power density of the 325 nm laser. At the low pumping power density of about , the spectrum displays a weak spontaneous emission band and no sharp peaks. As the pumping power density reaches , two distinct and sharp peaks located at 607 and 627 nm emerge in the spectrum, indicating the arising of lasing action. When the pumping power density exceeds the lasing threshold, two distinct lasing peaks emerge and stronger lasing emission is observed as the pumping power density increases. As the pumping power density increases to , some clear lasing modes with the full width at half-maximum (FWHM) of about 0.2 nm with a central wavelength of 607 nm can be distinguished in the lasing spectrum, so the Q factor is estimated as 3035. A plot of emission intensity with excitation density is shown in Fig. 3(b). The microsphere emission intensity increases rapidly and superlinearly with the excitation power, indicating a lasing behavior with a threshold around . The superlinear increase of the emission intensity presents a clear knee behavior, which revealed a nonlinear gain and clearly confirmed the lasing action of the polymer microspheres.
Figure 3.(a) The PL emission of a typical DCM-doped polymer microsphere recorded as a function of excitation density. (b) The emission intensity dependence on the excitation density. The inset in (b) is the corresponding fluorescent microsphere image (3.7 μm). (c) The relationship between and the diameter of the microsphere. (d) Lasing spectra of polymer microspheres with different diameters. The corresponding mode numbers are given in (d).
Figure 3(d) shows the lasing spectra of polymer microspheres with different diameters. The lasing mode number can be calculated from the following equation[7]: where is the diameter of the polymer microsphere, and is the refractive index of PS (1.59).
The mode spacing of the microsphere cavity was well-tuned by altering the size of the microspheres. As demonstrated in Fig. 3(d), the mode spacing gradually increases with decreasing microsphere diameter. As shown in Fig. 3(c), the mode spacing was inversely proportional to the microsphere diameter, which is in reasonable agreement with that given by the WGM equation [8], where is the resonant wavelength, and is the effective refractive index of the microsphere. Based on the linear relationship between and , can be identified with a value of 1.59 [Fig. 3(c)], which is consistent with the intrinsic refractive index of the PS microsphere (1.59)[5]. This indicates that PL modulation is indeed resulted from the WGM cavity resonance.
The measured Q factors of the microspheres are various with each other, but all are above , which is high for organic resonators. Table 1 displays the comparison of Q factor values for organic microcavities with previously reported works. As the Q factor describes the stored energy in the resonator, a higher gain in the resonator, especially upon lasing, will improve the stored energy and therefore increase the Q factor. This improvement in Q factor is highly beneficial for sensing purposes, as it increases the resolution of the sensor, enabling the detection of smaller changes in the resonance wavelength positions.
Organic Microresonators
Q
References
DPPDO microrings
400
[9]
Conjugated polymer microspheres
600
[10]
Perylenediimide microdisks
476
[11]
DPHP hemispheres
1.4×10³
[12]
Chiral 1-R microspheres
770
[13]
R610-doped polymer microspheres
Near 6×10³
[14]
DCM-doped polymer microspheres
>3×10³
This work
Table 1. Comparison of Q Factor Values of Published Organic Resonators
To further study the lasing behaviors, two-dimensional FDTD simulation was employed to simulate the optical field distributions of an optical mode in the microcavities. The inset shows the PL spectra of DCM-doped PS film. For this simulation, four dipole sources randomly distributed in the equatorial plane with a DCM gain curve were set as the light source[15], and the refractive index of the PS sphere is defined with a dispersion curve, where is the refractive index of PS at wavelength . An electronic field monitor was placed in the plane to record the electronic information. A spectra monitor was used to record the resonant position. Figure 4(a) shows the experimental and simulated lasing spectra. The resonant position agrees well with the first resonant wavelength of about 607 nm, and the small difference in the resonant wavelength of about 628 nm is ascribed to the small change of diameter and refractive index. The electromagnetic field distribution equator plane was demonstrated in Fig. 4(b), where a clear horizontal mode can be observed. The intensity agrees well with the experiment spectra. All of the experimental and simulated results give us more sufficient evidence for the WGM resonance mechanism.
Figure 4.(a) Experimental and simulated lasing spectra of individual sphere with a diameter of 3.7 μm. The inset shows the PL spectrum of DCM-doped PS film. (b) Electronic field distribution of resonance wavelength.
The humidity sensor experiment was further conducted for a PS sphere with a typical diameter of 3.9 μm. The experiment setup was shown in Fig. 5(a). During the experiment, saturated salt solutions were used to offer controllable and stable RH for the following PL measurements. One WGM microcavity and stable water vapor were sealed in a glass chamber to provide an atmosphere with constant vapor concentration. The microsphere was excited with the 325 nm laser, and the WGM spectral shift was measured in response to the concentration variation of the water vapor inside the chamber. As can be seen in Fig. 5(b), with the increase of the water concentration, the microlaser exhibited a gradual red-shift (, where and are the lasing wavelengths before and after water exposure). When the RH changes from 0 to 97%, the resonant peak moves from 620.07 to 620.66 nm, and the sensor sensitivity is 6 pm/RH%. The spectrum linewidth of 620.07 nm was 0.17 nm. Given that the noise level allows us to determine a wavelength shift with a precision of 1/20 of the linewidth[16], the limit of detection with the WGM lasing response is calculated to be 1.4 RH%.
Figure 5.(a) Schematic diagram of PL measurement under different RH. (b) Wavelength shift of the lasing mode under the exposure of different RH.
There are two effects of adding water molecules to the microsphere’s surface in the process. One is to change the effective refractive index . To better understand this, we conducted an FDTD calculation about the lasing spectra with refractive index variation. During the simulation, we fix the cavity size to about 3.9 μm, and the surrounding refractive index changes ranging from 0–0.015 according to the experiment. The simulated spectrum for the resonance wavelength near 627 nm shifts when the refractive index changes, as shown in Fig. 6(a).
Figure 6.(a) Normalized simulated lasing spectra of PS sphere with refractive index variation. (b) Relationship between wavelength shift and refractive index variation.
Figure 6(b) plots the relationship between refractive index variation and wavelength movement. As can be seen, if the resonant wavelength is changed by 0.59 nm, the corresponding refractive index should be changed by 0.013 without considering the effect of . However, refractive index changes due to moisture are in the range of to in the process[17]. It is equivalent to a very small effect to the effective refractive index change , so it has a very week effect on the spectrum shift.
The other is to change the effective radius, which depends on the size of the microsphere and the refractive index of the microsphere and surrounding environment. In our experiment, the microsphere nearly keeps the same size because PS does not swell during the increase in RH. The water molecules adsorbed on the surface of the polymer microsphere increase the refractive index, which increases the penetration depth of the evanescent wave and effective radius[18]. The penetration depth () can be calculated from[19]where is the angle of incidence of light from inside the cavity to the interface, is the refractive index of the resonator, and is the refractive index of the surrounding environment. Hence, induced by water molecule adsorption can be calculated as where and are the refractive index of the environmental medium before and after the water vapor treatment. Thus, except for the effective radius’s variation, induced by the increase of penetration depth is a major factor expanding the optical pass of WGMs inside the microsphere and leads to a red-shift of the lasing mode.
It is important to compare the spectrum before the vapor adding and after the vapor is totally diffused. In our work, another PS sphere was utilized to conduct the experiment. As mentioned before, the evanescent field is very sensitive to the environment around it. As displayed in Fig. 7, a clear red-shift (from 609.88 to 610.59 nm) of the spectra can be observed when RH changes from 0 to 97%. Furthermore, as the water vapor in the surrounding medium was removed by , the lasing modes were recovered to the initial wavelength.
Figure 7.Experimentally measured spectra taken from the PS microsphere before and after the water vapor treatment.
In summary, we have synthesized organic low threshold and high Q spherical WGM microlasers. The mode spacing of the microsphere cavity was well-tuned by altering the size of the microspheres. The application of organic microlasers as a humidity sensor has been realized by monitoring the shifting of the lasing mode, and the sensor’s sensitivity is up to 6 pm/RH%. The limit of detection with the WGM lasing response is 1.4 RH%. The mode shift is ascribed to the change of penetration depth due to the increase of the refractive index. Owing to the compact size, low cost, simple fabrication, and excellent lasing performance, our findings could provide profitable enlightenment for microlasers to be applied in sensing areas.
References
[1] J. Fraden. Handbook of Modern Sensors(2010).
[2] Q. Mo, S. Li, Y. Liu, X. Jiang, G. Zhao, Z. Xie, X. Lv, S. Zhu. Chin. Opt. Lett., 14, 091902(2016).
[3] H. Wan, H. Li, H. Zhu, J. Xu, Y. Lu, J. Wang. Chin. Opt. Lett., 14, 112302(2016).
[10] O. Oki, S. Kushida, A. Mikosch, K. Hatanaka, Y. Takeda, S. Minakata, J. Kuwabara, T. Kanbara, T. D. Dao, S. Ishii. Mater. Chem. Front., 2, 270(2018).