Abstract
We report on the observation of the highly forbidden optical clock transition in laser-cooled atoms. More than 95% depletion of cold atoms is detected in the magneto-optical trap. Using the free-of-field detection method, the AC Stark shift from the cooling laser is removed from the in-field spectroscopy. At low-power clock laser pumping, the linewidth of the clock spectroscopy is approximately 450 kHz (full width at half-maximum), which corresponds to a Doppler broadening at the atom temperature of 60 μK. We determine the transition frequency to be 1,128,575,290.819(14) MHz by referencing with a hydrogen maser and measuring with a fiber optical frequency comb. Moreover, a weak Doppler-free signal is observed.During the past three decades, optical clocks have undergone rapid development with the invention of the optical frequency comb[1] and advances in ultra-stable lasers[2]. The stability and uncertainty of optical clocks, including optical lattice clocks[3–6] and optical ion clocks[7–9], have already surpassed that of the microwave primary clocks[6,10,11]. To date, neutral strontium (Sr) and ytterbium (Yb) optical lattice clocks have achieved the highest stability[12,13] and uncertainty[4,5] in the regime. High-precision measurement of the frequency ratio of optical clocks is a key step on the roadmap of the redefinition of the International System of Units (SI) second[14–17]. Some transportable optical clocks[18,19] with optical frequency transfer via fiber[20–22] allow the possible application to geodesy measurements[23]. In the case of accurate optical clocks, the blackbody radiation (BBR) shift[24,25] is a key obstacle to the achievement of the uncertainty at the level at room temperature for Sr[16,26–29], Yb[30,31], [32], and [8]. To reduce the BBR shift to the level, two approaches have been adopted in optical lattice clocks. The first involves the reduction of the ambient temperature uncertainty to the millikelvin (mK) level[4,33] or placing the atoms in an environment with the ambient temperature below 100 K[5]. The other approach involves the selection of elements that are intrinsically insensitive to the BBR, such as [9,34], [14,35], [36], and the mercury atom (Hg)[15,17]. atoms not only have the lowest sensitivity to BBR in optical lattice clocks, but they also have a high vapor pressure at room temperature and the smallest nuclear spin (). High vapor pressure implies that a high-temperature oven is not required to generate the atomic beam, which helps to reduce the influence of the ambient temperature compared with Sr and Yb optical lattice clocks. Due to the low nuclear spin, the second-order Zeeman effect[37] is smaller, and the tensor light shifts[37] in the optical lattice can be removed for atoms. Thus, the Hg optical lattice clock has the potential to achieve an uncertainty at the level at room temperature.
As the first step in the pursuit of an optical lattice clock, we report that the optical clock transition of is observed in a magneto-optical trap (MOT). More than 95% of the atoms in the MOT are depleted with the clock laser. By sweeping the frequency of the clock laser, a Doppler-broadened spectroscopy of the clock transition is observed with a full width at half-maximum (FWHM) of 450 kHz, which corresponds to the temperature of 60 μK. Using a frequency comb referenced to a hydrogen maser, the resonant frequency of the clock transition is measured as 1,128,575,290.819(14) MHz. Moreover, a weak Doppler-free saturated absorption signal is also observed with a counter-propagating pumping laser configuration.
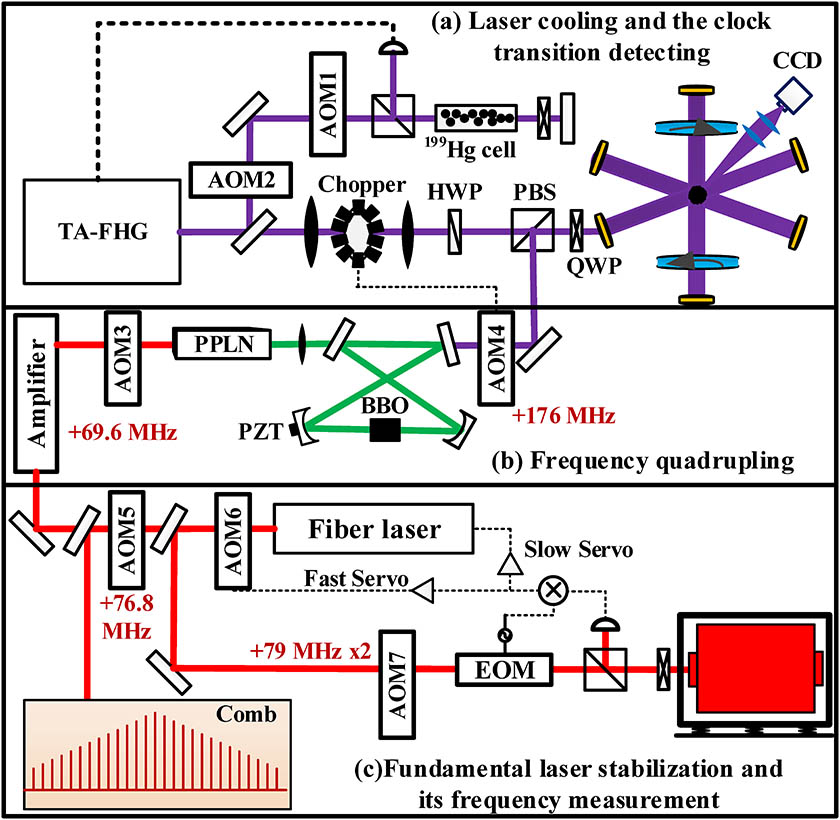
In our experiment, laser cooling of is achieved using the transition at 253.7 nm. A commercial laser (TA-FHG, Toptica) with an output power of 22 mW is used as the cooling laser. The 253.7 nm laser is split into two parts. One part is initially frequency shifted using two acousto-optical modulators (AOMs) and then stabilized to the frequency modulated saturated absorption spectroscopy in a 1-mm-long isotope enriched vapor cell. The other part is used to produce the MOT with a single beam folded configuration with a diameter of 10 mm[38,39], as shown in Fig. 1(a). Approximately atoms are cooled and trapped in the MOT when the detuning of the cooling laser is . The lowest temperature of the MOT recorded is about 50 μK, which is in agreement with our previous work[39].
Sign up for Chinese Optics Letters TOC. Get the latest issue of Chinese Optics Letters delivered right to you!Sign up now

Figure 1.Experimental setup schematic.
To detect the clock transition in cold atoms, we build an ultra-stable deep-UV clock laser system at 265.6 nm, as shown in Figs. 1(b) and 1(c). A 1062.5 nm commercial fiber laser (Basik Y10, NKT) is first stabilized to an ultra-stable cavity (USC) with Pound–Drever–Hall locking. The spacer and the mirror substrate of the USC are made by ultra-low-expansion (ULE) glass. This cavity is located in a vacuum chamber on a vibration isolated platform (Minus-K, BM-1). The temperature of the USC is actively stabilized at the zero-expansion temperature of 18.6°C. The ultra-stable laser is amplified by a homemade fiber laser amplifier from 20 mW to 2.5 W and then frequency quadrupled by a single-passed periodically poled lithium niobate (PPLN) crystal and a cavity-enhanced frequency-doubler with an anti-reflection coated barium borate (BBO) crystal. Approximately 200 mW of green light and 4 mW of deep-UV light are generated at 531.2 and 265.6 nm, respectively. To make the clock laser operate near the transition resonance, four AOMs (AOM3, AOM4, AOM5, and AOM7 in Fig. 1) are used to adjust the frequencies of the ultra-stable light in the IR and deep-UV. Their carrier frequencies are carefully selected after measurement of the absolute frequency of the USC using the fiber frequency comb (FC1500-250-WG, MenloSystems). The AOMs are driven by direct digital synthesizers (DDS, AD9959, Analog Devices). The fiber frequency comb and the DDSs are all referenced to a hydrogen maser (iMaser3000, T4Science). Among the AOMs, the deep-UV AOM (AOM4) is used to switch the clock laser on–off, and the double-passed AOM (AOM7) is used to scan the spectroscopy.
There are eight coated windows on the vacuum chamber of the MOT for optical access to the deep-UV light. Six of them are used for the access of cooling beams of the MOT, and the remaining two are used for fluorescence detection by an electron-multiplying CCD (EMCCD). We couple the clock beam into the cooling beam with a polarization beam splitter (PBS) as shown in Fig. 1(a). The quarter wave plate (QWP) after the PBS polarizes the input of the cooling laser to polarization, while the clock laser is polarized to polarization. Different from the slightly convergent cooling laser beam, the clock beam is collimated to a beam size of (at the center of the MOT), and it is also in a counter-propagating configuration as the cooling beam. The power of the clock beam is up to 2.5 mW for the spectroscopy, which corresponds to a Rabi frequency of about 3 kHz[40] for the clock transition. The Rabi frequency is hundreds of times lower than the Doppler broadening width of 50 μK for the clock transition, which means that less than 1% of the cold atoms at the state in free flight would be pumped to the state. It is difficult to directly detect such a low reduction of the fluorescence signal in a high vapor background. To enhance the contrast and signal-to-noise ratio (SNR), we adopt a method of continuous MOT loading and clock laser pumping[40–42]. During the continuous clock laser pumping, some atoms will be pumped into the state; then, they freely fall under the gravity because they stay at a dark state for the cooling laser. Meanwhile, due to the Doppler effect, the detuning of these atoms increases with time by gravitational acceleration. Most of them will be out of resonance and would not be pumped back to the state in the MOT. Most of these atoms would be lost, and the MOT will rethermalize atoms to fill the dip in velocity distribution, so it becomes a continuous depletion in the MOT. Because the MOT loading time (2 s in our system) is much longer than the pulse time (about 170 μs) when the clock laser is on resonance, theoretically, there could be almost 100% depletion of the MOT. This is much easier for detection.
In-field detection is a situation whereby the MOT loading and the clock laser pumping are working simultaneously, which would introduce an AC Stark shift to the clock transition by the cooling laser. To avoid this effect, we use free-of-field detection, i.e., the MOT loading and clock laser pumping operate asynchronously. In this case, we apply a mechanical chopper to modulate the cooling laser with 50% duty of circle and 500 μs pulse width. When the cooling laser is switched off, the clock laser is switched on with a 400 μs pulse width, as shown in Fig. 2. After hundreds of periods, the atom number in the MOT becomes steady, and a clear depletion can be found when the clock laser is on resonance. To detect the spectroscopy with a high SNR, the exposure time of the EMCCD is set to 50 ms, and each data point is averaged from four measurements. Each measurement of the clock spectroscopy takes 6 s. A total of 4 s is required for atom number stabilization in the MOT after adjusting the clock laser frequency, and 2 s is required for acquiring four images of the cold atoms and one image of the background. The data of the cold atoms are collected from the image of the cold atoms subtracted by the background image.
Figure 2.Sequences of the cooling laser and clock laser for in-field detection and free-of-field detection.
The in-field and free-of-field spectroscopy are detected, respectively, in our MOT when the average power of the clock laser is 1 mW, as shown in Fig. 3(a). For convenience, we use the average power below. We set up the step frequency of the double-passed AOM (AOM7) at 5 kHz; therefore, the frequency step for deep-UV clock spectroscopy is 40 kHz. Figure 3 shows the measurement results of the clock spectroscopy. In Fig. 3(a), approximately 320 kHz of AC Stark shift is shown by the cooling laser for in-field detection.
Figure 3.(a) Normalized atom number in the MOT under the in-field (blue) and the free-of-field (red) spectroscopy fitted with a Gaussian function at 1 mW. (b), (c), (d) Free-of-field spectroscopy of the clock transition at incident powers of 0.7, 0.2, and 0.03 mW and their fittings.
The free-of-field spectroscopy is measured at different clock laser powers from 0.03 to 1 mW, as shown in Fig. 3. At 1 mW of clock laser pumping, more than 95% of the cold atoms are depleted at resonance, and the spectral line width (FWHM) is about 860 kHz. This corresponds to the atom temperature of 220 μK, which is four times higher than the atom temperature without the clock pumping laser. When the pumping power is reduced, the line width reduces, and the depletion (i.e., contrast of spectroscopy) decreases, as shown in Fig. 4. When the pumping power is reduced to as low as 30 μW, the line width goes to 450 kHz, and the corresponding temperature is 60 μK. This value is in agreement with the cold atom temperature. We consider that the linewidth broadening results from some clock laser power-dependent broadening effects. However, the specific mechanism is quite complicated. This is because in the MOT the atoms are in dynamic equilibrium under both loading and pumping effects.
Figure 4.(a) Calculated temperature of the atoms in MOT from the FWHM of the spectroscopy at different clock laser powers. (b) Contrast of the spectroscopy (i.e., depletion rate) at different clock laser powers. (c) The center frequency of the free-of-field spectroscopy at different clock laser power.
With these clock spectroscopies, we can determine the absolute frequency of the clock transition for the atom. The spectral data is first fitted using a Gaussian profile. The 95% confidence interval of the central frequency of the Gaussian profile is . To achieve a better accuracy, we average the central frequencies of the selected nine spectra at different powers, as shown in Fig. 4(c). Each spectrum has a contrast of more than 50%. The averaged frequency is 1,128,575,290.819 MHz, and its root mean square standard deviation is 14 kHz. Except for statistical errors, there are three other kinds of systematic errors that occur in our system.
The first part is from the electromagnetic environment of the cold atoms. The AC Stark shift is the biggest component in the in-field detection; however, it was removed in the free-of-field detection. The next uncertainty is from the gradient of the magnetic field. Because we cannot switch the current of the MOT coils as quickly as cooling light, the magnetic field remains static in the detection process. Considering the magnetic-field gradient (10 G/cm) in the MOT and the diameter of the clock laser beam (0.8 mm), the deviation of the magnetic field is smaller than 0.4 G. The Landé g-factors of both the and () states are as small as , which corresponds to the first-order Zeeman coefficient of 0.39 kHz/G, and thus the Zeeman shift of the clock transition is smaller than 310 Hz for the transition. We can ignore it compared to the statistical error.
The second part is from the stability and uncertainty of the frequency references. In our experiment, all of the frequency instruments, including the fiber frequency comb and the DDSs for the AOM driver, are referenced to the hydrogen maser. The stability of the hydrogen maser is , and its absolute frequency has been verified with another global positioning system (GPS)-tracked hydrogen clock with a small shift of less than . The additional instability of each DDS is less than at 100 MHz, which corresponds to the additional instability of at the optical frequency. In Total, this means that about 50 Hz of uncertainty for an integration time of 1 s is encountered for the frequency measurement of the ultra-stable laser.
Finally, frequency detuning will also be affected by the drift of the USC, because the absolute frequency measurement of the ultra-stable laser and the spectroscopy measurement are not synchronously applied. The drift rate of the USC is less than 4.2 kHz/day, i.e., 50 mHz/s in the IR and 0.2 Hz/s in the deep-UV for the clock laser. There are 80 samples in one detection of clock spectroscopy and 6 s for one sample. Therefore, the frequency drift of the clock laser is 96 Hz for each spectrum. Compared to the FWHM of the spectroscopy, this small drift will not significantly affect the symmetry of the spectral profile, nor will it broaden the linewidth.
Taking into account all of the aforementioned factors, the biggest uncertainty in the determination of the absolute frequency is the statistical error of these measurements with 14 kHz. Therefore, we determine the clock transition frequency to be 1,128,575,290.819(14) MHz. This value is in agreement with previous measurements[40].
We have also observed a weak Doppler-free signal in the Doppler-broadened clock spectroscopy with 1 mW of laser power, as shown in Fig. 5. In this case, we choose a 0.8 kHz frequency step of the UV light for the clock spectroscopy. The photon recoil doublet[40,43], however, could not be clearly identified because of the low SNR of the spectroscopy. The spectral noise is mainly from the fluorescence fluctuation of our high Hg vapor background. Meanwhile, the detection configuration in our experiment is different from the former work in Paris[40]. Our clock laser is circularly polarized and incident on the atoms from six directions. Even though we can still clearly observe the weak Doppler-free signal, the linewidth is much narrower than the Doppler linewidth of 860 kHz, as shown in Fig. 3(a).
Figure 5.Doppler-free signal in the Doppler-broadened spectroscopy.
In conclusion, we have observed the free-of-field spectroscopy of the optical clock transition in MOT for the atom. A Doppler-broadened spectroscopy with a linewidth of 450 kHz is detected, which corresponds to the temperature of 60 μK. Using the fiber frequency comb and hydrogen maser, the frequency of the transition is determined to be 1,128,575,290.819(14) MHz. In addition, we also observe a weak Doppler-free signal via Doppler-broadened spectroscopy.
References
[1] L. S. Ma, Z. Y. Bi, A. Bartels, L. Robertsson, M. Zucco, R. S. Windeler, G. Wilpers, C. Oates, L. Hollberg, S. A. Diddams. Science, 303, 1843(2004).
[2] B. Young, F. Cruz, W. Itano, J. Bergquist. Phy. Rev. Lett., 82, 3799(1999).
[3] J. J. McFerran, L. Yi, S. Mejri, S. D. Manno, W. Zhang, J. Guéna, Y. Le Coq, S. Bize. Phys. Rev. Lett., 108, 103004(2012).
[4] T. L. Nicholson, S. L. Campbell, R. B. Hutson, G. E. Marti, B. J. Bloom, R. L. McNally, W. Zhang, M. D. Barrett, M. S. Safronova, G. F. Strouse, W. L. Tew, J. Ye. Nat. Comm., 6, 6896(2015).
[5] I. Ushijima, M. Takamoto, M. Das, T. Ohkubo, H. Katori. Nat. Photon., 9, 185(2015).
[6] M. Abgrall, B. Chupin, L. De Sarlo, J. Guena, P. Laurent, Y. Le Coq, R. Le Targat, J. Lodewyck, M. Lours, P. Rosenbusch, G. D. Rovera, S. Bize. C. R. Physique, 16, 461(2015).
[7] N. Huntemann, C. Sanner, B. Lipphardt, C. Tam, E. Peik. Phys. Rev. Lett., 116, 063001(2016).
[8] Y. Huang, H. Guan, P. L. Liu, W. Bian, L. S. Ma, K. Liang, T. C. Li, K. L. Gao. Phys. Rev. Lett., 116, 013001(2016).
[9] C. W. Chou, D. B. Hume, J. C. J. Koelemeij, D. J. Wineland, T. Rosenband. Phys. Rev. Lett., 104, 070802(2010).
[10] S. Peil, J. L. Hanssen, T. B. Swanson, J. Taylor, C. R. Ekstrom. Metrologia, 51, 263(2014).
[11] G. Dong, J. Deng, J. Lin, S. Zhang, H. Lin, Y. Wang. Chinese Opt. Lett., 15, 4(2017).
[12] N. Hinkley, J. A. Sherman, N. B. Phillips, M. Schioppo, N. D. Lemke, K. Beloy, M. Pizzocaro, C. W. Oates, A. D. Ludlow. Science, 341, 13(2013).
[13] M. Schioppo, R. C. Brown, W. F. McGrew, N. Hinkley, R. J. Fasano, K. Beloy, T. H. Yoon, G. Milani, D. Nicolodi, J. A. Sherman, N. B. Phillips, C. W. Oates, A. D. Ludlow. Nat. Photon., 11, 48(2017).
[14] T. Roseband, D. B. Hume, P. O. Schmidt, C. W. Chou, A. Brusch, L. Lorini, W. H. Oskay, R. E. Drullinger, T. M. Fortier, J. E. Stalnaker, S. A. Diddams, W. C. Swann, N. R. Newbury, W. M. Itano, D. J. Wineland, J. C. Bergquist. Science, 319, 1808(2008).
[15] K. Yamanaka, N. Ohmae, I. Ushijima, M. Takamoto, H. Katori. Phy. Rev. Lett., 114, 230801(2015).
[16] N. Nemitz, T. Ohkubo, M. Takamoto, I. Ushijima, M. Das, N. Ohmae, H. Katori. Nat. Photon., 10, 258(2016).
[17] R. Tyumenev, M. Favier, S. Bilicki, E. Bookjans, R. L. Targat, J. Lodewyck, D. Nicolodi, Y. L. Coq, M. Abgrall, J. Guena, L. D. Sarlo, S. Bize. New Journal of Physics, 18, 113002(2016).
[18] S. B. Koller, J. Grotti, S. Vogt, A. Al-Masoudi, S. Dorscher, S. Hafner, U. Sterr, C. Lisdat. Phys. Rev. Lett., 118, 073601(2017).
[19] J. Cao, P. Zhang, J. Shang, K. Cui, J. Yuan, S. Chao, S. Wang, H. Shu, X. Huang. Appl. Phys. B, 123, 112(2017).
[20] K. Predehl, G. Grosche, S. M. F. Raupach, S. Droste, O. Terra, J. Alnis, T. Legero, T. W. Hansch, T. Udem, R. Holzwarth, H. Schnatz. Science, 336, 441(2012).
[21] C. Q. Ma, L. F. Wu, Y. Y. Jiang, H. F. Yu, Z. Y. Bi, L. S. Ma. Appl. Phys. Lett., 107, 261109(2015).
[22] X. Deng, J. Liu, D. D. Jiao, J. Gao, Q. Zang, G. J. Xu, R. F. Dong, T. Liu, S. G. Zhang. Chin. Phys. Lett., 33, 114202(2016).
[23] J. Grotti, S. Koller, S. Vogt, S. Hafner, S. Hafner, U. Sterr, C. Lisdat, H. Denker, C. Voigt, L. Timmen, A. Rolland, F. N. Baynes, H. S. Margolis, M. Zampaolo, P. Thoumany, M. Pizzocaro, B. Rauf, F. Bregolin, A. Tampellini, P. Barbieri, M. Zucco, G. A. Costanzo, C. Clivati, F. Levi, D. Calonico. Nat. Phys., 14, 437(2018).
[24] S. G. Porsev, A. Derevianko. Phys. Rev. A, 74, 020502(2006).
[25] T. Rosenband, P. O. Schmidt, D. B. Hume, W. M. Itano, T. M. Fortier, J. E. Stalnaker, K. Kim, S. A. Diddams, J. C. Koelemeij, J. C. Berqquist, D. J. Wineland. Phys. Rev. Lett., 98, 220801(2007).
[26] S. Falke, N. Lemke, C. Grebing, B. Lipphardt, S. Weyers, V. Gerginov, N. Huntemann, C. Hagemann, A. Al-Masoudi, S. Hafner, S. Vogt, U. Sterr, C. Lisdat. New J. Phys., 16, 073023(2014).
[27] Y. G. Lin, Q. Wang, Y. Li, F. Meng, B. K. Lin, E. J. Zang, Z. Sun, F. Fang, T. C. Li, Z. J. Fang. Chin. Phys. Lett., 32, 090601(2015).
[28] Y. B. Wang, M. J. Yin, J. Ren, Q. F. Xu, B. Q. Lu, J. X. Han, Y. Guo, H. Chang. Chin. Phys. B, 27, 023701(2018).
[29] Q. Xu, H. Liu, B. Lu, Y. Wang, M. Yin, D. Kong, J. Ren, X. Tian, H. Chang. Chin. Opt. Lett., 13, 10(2015).
[30] M. Zhou, X. Y. Xu. AAPPS Bull., 26, P10(2016).
[31] H. Liu, X. Zhang, K. L. Jiang, J. Q. Wang, Q. Zhu, Z. X. Xiong, L. X. He, B. L. Lyu. Chin. Phys. Lett., 34, 020601(2017).
[32] G. P. Barwood, G. Huang, H. A. Klein, L. A. M. Johnson, S. A. King, H. S. Margolis, K. Szymaniec, P. Gill. Phys. Rev. A, 89, 050501(2014).
[33] K. Beloy, N. Hinkley, N. B. Phillips, J. A. Sherman, M. Schioppo, J. Lehman. Phys. Rev. Lett., 113, 260801(2014).
[34] Z. T. Xu, W. H. Yuan, X. Y. Zeng, H. Che, X. H. Shi, K. Deng, J. Zhang, Z. H. Lu. J. Phys.: Conf. Ser., 723, 012026(2016).
[35] H. X. Zou, Y. Wu, G. Z. Chen, Y. Shen, Q. Liu. Chin. Phys. Lett., 32, 054207(2015).
[36] Y. H. Wang, T. Liu, R. Dumke, A. Stejskal, Y. N. Zhao, J. Zhang, Z. H. Lu, L. J. Wang, T. Becker, H. Walther. Laser Phys., 17, 1017(2007).
[37] A. D. Ludlow, M. M. Boyd, J. Ye, E. Peik, P. O. Schmidt. Rev. Modern Phys., 87, 637(2015).
[38] H. L. Liu, S. Q. Yin, K. K. Liu, J. Qian, Z. Xu, T. Hong, Y. Z. Wang. Chin. Phys. B, 22, 043701(2013).
[39] K. K. Liu, R. C. Zhao, W. Gou, X. H. Fu, H. L. Liu, S. Q. Yin, J. F. Sun, Z. Xu, Y. Z. Wang. Chin. Phys. Lett., 33, 070602(2016).
[40] I. Courtillot, A. Quessada, R. P. Kovacich, A. Brusch, D. Kolker, J. J. Zondy, G. D. Rovera, P. Lemonde. Phys. Rev. A, 68, 030501(2003).
[41] C. W. Hoyt, Z. W. Barber, C. W. Oates, T. M. Fortier, S. A. Diddams, L. Hollberg. Phys. Rev. Lett., 95, 083003(2005).
[42] M. Petersen, R. Chicireanu, S. T. Dawkins, D. V. Magalhaes, C. Mandache, Y. L. Coq, A. Clairon, S. Bize. Phys. Rev. Lett., 101, 183004(2008).
[43] J. L. Hall, C. J. Borde, K. Uehara. Phys. Rev. Lett., 37, 1339(1976).