
Guogang WANG, Lin ZHANG, Yuzhu SUN, Yantao YANG, Chengji HAN. Evaluation on the allocative efficiency of agricultural factors in the five Central Asian countries[J]. Journal of Geographical Sciences, 2020, 30(11): 1896
- Journal of Geographical Sciences
- Vol. 30, Issue 11, 1896 (2020)
Abstract
Keywords
1 Introduction
Central Asia is the trade route along the world famous “Silk Road” of China, and plays an extremely important role in international agricultural cooperation. The five Central Asian countries, namely Turkmenistan, Kyrgyzstan, Uzbekistan, Tajikistan and Kazakhstan, are endowed with abundant agricultural resources, and this has significant mutual benefits to the agriculture of China, thus these countries are thus the main target areas for China’s agriculture to “extend its reach” (
Agricultural total factor productivity growth is regarded as the basis of agricultural growth, thus researchers in development economics and agricultural economics have for many years focused on agricultural TFP research. Early foreign scholars studied the growth factors of agricultural production in Japan, the United States, India and other countries. They have held that the improvement of agricultural TFP was very important in the growth of agricultural output in the United States (Grilliches, 1957; Alston, 1998;
Relevant research further explores the source of TFP growth, and decomposes agricultural TFP. It has been concluded that TFP is mainly affected by technical progress and improvement efficiency, while different countries and different agricultural industries are affected by both of them to different degrees, and the improvement efficiency is jointly determined by technical efficiency, allocative efficiency, and scale efficiency. Studies performed by Kumbhakar (2000), Vania Sena (2003), Renuka Mahadevan (2003) and others have shown that the growth of TFP results from the perspectives of frontier technical progress, relative frontier technical efficiency, relative frontier factor allocative efficiency, and relative frontier scale efficiency. According to research regarding agricultural TFP growth in China, the main source of TFP growth in China’s agriculture is technical progress, while the decline of technical efficiency is the main cause hindering its growth. At present, the agricultural TFP of China increases by 5.12% annually, while the growth rate shows an overall decreasing trend. The change of scale efficiency is the main obstacle to the growth of agricultural TFP, and the change of allocative efficiency is the main factor by which to promote the growth of agricultural TFP (
Generally speaking, previous studies regarding foreign agricultural TFP have mostly involved agricultural efficiency in third world countries or underdeveloped areas, and further studied the impact of technology spillover and production scale on TFP (
2 Materials and methodology
2.1 Methodology and decomposition of total factor productivity
2.1.1 Brief introduction of the methodology
As an important tool by which to analyze the sources of economic growth, total factor productivity (TFP) provides a vital policy basis for sustainable economic development. The efficiency research methods mainly include data envelopment analysis (DEA) and stochastic frontier analysis (SFA). Compared with the data envelopment analysis method, the stochastic frontier analysis method is more stable and less susceptible to the influence of abnormal points, and it also has a higher data fitting degree (
The stochastic frontier production function model is generally expressed as follows:
where
2.1.2 Model specification
According to the research results of Kumbhakar (2000), VaniaSena (2003) and Renuka Mahadevan (2003), when the influence of stochastic disturbance on the frontier output is not considered, then the stochastic frontier production function model of agriculture in the five Central Asian countries can be set as follows:
where
(1) Total factor productivity (TFP). As a representative index to evaluate production efficiency, TFP has become an important quantitative evaluation index for the economic operation quality of a production unit. TFP is the part of output growth which cannot be measured by input factors, and generally represents its change rate. The formula is as follows:
where
(2) Technical efficiency (TE). TE refers to the ratio of the actual output of factor input to the output of frontier technology under the given frontier technology level. Assuming that the output growth rate is $\Delta y=dlny/dt$, after decomposing the output growth rate into the contributions of frontier technology progress, the frontier technical efficiency and factor input increase to the output growth, as follows:
The above formula shows that, under the given factor input,
(3) Allocative efficiency (AE). AE is an index by which to measure the impact of changes in input structure of factors on TFP. The formula is as follows:
where $\lambda_{j}(\lambda_{j}=\varepsilon_{j}/RTS)$ is the relative production elasticity of input factor
(4) Scale efficiency (SE). Economy of scale refers to the fact that the proportion of output growth is higher than that of all factors increasing in the same proportion when other conditions remain unchanged; the opposite is known as diseconomy of scale. If the total returns to scale are larger than 1, then the growth of the scale of factor input will lead to higher output growth, which is conducive to the improvement of TFP. This can be defined as follows:
2.2 Data source
The data were mainly derived from the World Bank Database and FAO database, from during the period of 1992 to 2017. The agricultural outputs of the five Central Asian countries, i.e., Kazakhstan, Kyrgyzstan, Tajikistan, Uzbekistan and Turkmenistan, were selected. Output
3 Analysis of single factor productivity
3.1 Analysis on the changes of agricultural output and factor input in the five Central Asian countries
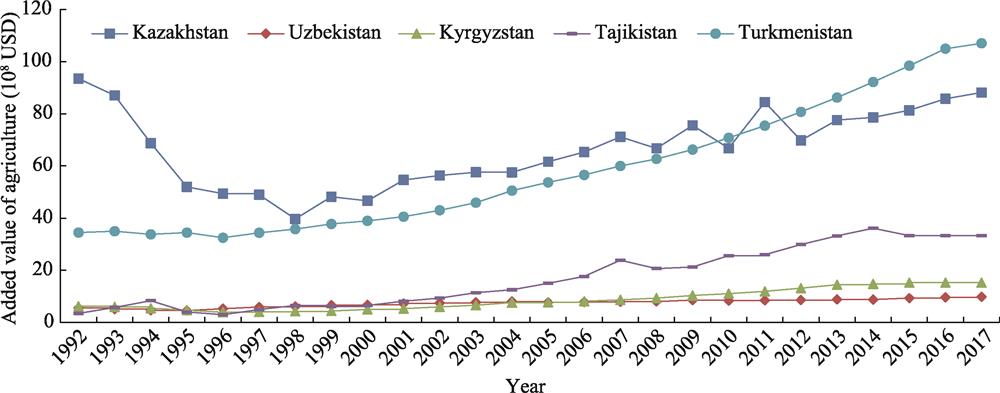
The agricultural added value of most of the five Central Asian countries is increasing continuously, with only Kazakhstan showing a downward trend. Compared with 1992, the changes of the agricultural GDP of Kazakhstan, Kyrgyzstan, Tajikistan, Uzbekistan and Turkmenistan in 2017 were -5.71%, 75.06%, 144.56%, 856.57% and 210.61%, respectively. It can be seen that the agricultural GDP in Turkmenistan has increased rapidly over the past 26 years, and has reached more than eight times that in the base period. Uzbekistan ranks second in terms of growth rate, at twice that in the base period. Since 2012, it has become the country with the highest agricultural value added among the five Central Asian countries. The agricultural GDPs of Kyrgyzstan and Tajikistan are relatively low, yet have maintained steady growth. For Kazakhstan, which exhibits negative growth, its agricultural added value has declined from the absolute leader among the five Central Asian countries to the second highest in 2017, with a net value of $8.8143 billion US dollars (at constant 2010 prices). From the perspective of agricultural output, most countries have maintained a steady increase in output, and Uzbekistan shows more significant advantages in terms of agricultural output (
![]()
Figure 1.
From the perspective of input, the agricultural land area has changed little over the past 26 years. The amount of most of the countries is trending downward, but in general does not drop significantly. In 1992, the inputs of agricultural land in Kazakhstan, Kyrgyzstan, Tajikistan, Uzbekistan and Turkmenistan were 2,214,600 mu, 100,900 mu, 44,900 mu, 353,500 mu and 277,200 mu, respectively; in 2017, these numbers changed to 2,169,900 mu, 105,600 mu, 47,500 mu, 338,400 mu and 267,700 mu, respectively, demonstrating only a minor fluctuation. The average inputs of agricultural land in Kazakhstan, Kyrgyzstan, Tajikistan, Uzbekistan and Turkmenistan during the past 26 years were 2,156,200 mu, 106,100 mu, 46,500 mu, 347,700 mu and 270,500 mu, respectively.
Among all of the inputs, the number of agricultural employee fluctuates the most. As shown in
![]()
Figure 2.
In terms of input of fertilizer and agricultural machinery, Kazakhstan’s fertilizer input increased by 2.3 times from 1992 to 2017, showing an obvious growth rate, but agricultural machinery input did not change much; Kyrgyzstan’s agricultural machinery input decreased significantly, and fertilizer input increased significantly; meanwhile, Uzbekistan, Turkmenistan and Tajikistan all showed a slight decrease in the use of agricultural machinery and a slight increase in the input of fertilizer (
![]()
Figure 3.
3.2 Characteristics of changes in single factor productivity
Land productivity, labor productivity and capital productivity are commonly collectively referred to as the “three productivities” of agricultural industry, and improving the “three productivities” is an important approach to the development of modern agriculture, as well as the main index by which to measure the level of modern agricultural development. In the following section, labor productivity and land productivity are analyzed from the perspective of data acquisition.
3.2.1 Labor productivity
Labor productivity is the labor efficiency of laborers in producing certain products. Agricultural labor productivity is expressed by the value of agricultural GDP created by each unit of agricultural employees, reflecting the productivity of an agricultural labor. As shown in
![]()
Figure 4.
3.2.2 Land productivity
Land productivity may be expressed by agricultural land output value per unit area. As can be seen from
![]()
Figure 5.
4 Analysis on the changes of agricultural TFP in the five Central Asian countries
4.1 Results of model regression
The results of model estimation are shown in
| Item | Coefficient | Standard-error | t-ratio |
|---|---|---|---|
| Constant term | -21.0525 | 4.0235 | -5.2324 |
| Agricultural employee x1 | 0.0377 | 0.0101 | 3.7189 |
| Cultivated area x2 | 355.4551 | 68.3093 | 5.2036 |
| Forest land area x3 | -6.7742 | 1.1785 | -5.7480 |
| Grassland area x4 | 1.5575 | 0.1706 | 9.1268 |
| Dosage of chemical fertilizer x5 | 0.7139 | 0.1425 | 5.0089 |
| Quantity of agricultural machinery x6 | 3.8611 | 0.3486 | 11.0749 |
| sigma-squared | 1250.7620 | 422.2924 | 2.9618 |
| gamma | 0.9850 | 0.0049 | 200.5004 |
| eta | 0.0339 | 0.0028 | 12.0895 |
| log likelihood function | -392.6326 | ||
| LR test of the one-sided error | 149.2228 |
Table 1.
Parameter estimation results of the SFA model
4.2 Analysis of TFP in the five Central Asian countries
As shown in
| Year | Kazakhstan | Kyrgyzstan | Tajikistan | Turkmenistan | Uzbekistan |
|---|---|---|---|---|---|
| 1993 | 0.1337 | 0.0177 | 0.0703 | 0.3942 | 0.0160 |
| 1995 | 0.3024 | 0.0964 | 0.1053 | 0.2219 | 0.0393 |
| 2000 | 0.0637 | 0.0216 | 0.1069 | 0.0455 | 0.0015 |
| 2005 | 0.0817 | 0.0263 | 0.0382 | 0.2112 | 0.0941 |
| 2010 | 0.1100 | 0.0236 | 0.0377 | 0.1887 | 0.0706 |
| 2015 | 0.0858 | 0.1170 | 0.0468 | 0.0919 | 0.0853 |
| 2017 | 0.0213 | 0.0144 | 0.0352 | 0.0582 | 0.0434 |
| Average | 0.1144 | 0.0576 | 0.0604 | 0.1713 | 0.0598 |
Table 2.
Agricultural TFP of the five Central Asian countries during 1992‒2017
4.3 Analysis of the efficiency improvement of the five Central Asian countries
The TFP is mainly affected by technological progress and efficiency improvement. This paper mainly discusses the effects of technical efficiency, allocative efficiency and scale efficiency on the TFP in the five Asian countries. In general, the marginal cost and marginal benefit of production factors differ. If the cost of a production factor is relatively high, and the marginal output is relatively low compared with other factors, then the increase of input of this factor will lead to a decline in production efficiency; on the contrary, the decrease of this factor input is beneficial to the improvement of production efficiency. The modern economic growth theory suggests that the allocative efficiency of input factors depends on two aspects: one is the quantity and quality of input factors; and the other is the resource allocation mode of input factors. This means that only when the structure of input factors is fully considered can the allocative efficiency be improved by giving full play to the allocation mode of input factors. In a market economy, if factor resources can flow adequately, then the equilibrium condition for maximizing profit is that the marginal output of factor equals the cost of factor, that is to say, under this condition the contribution of allocative efficiency of factors to TFP growth should be equal to zero. According to the empirical results, the contribution of allocative efficiency of input factors to agricultural TFP growth was at a relatively low level in the five Central Asian countries from 1993 to 2017. In 1993, the agricultural allocative efficiencies of Kazakhstan, Kyrgyzstan, Tajikistan, Turkmenistan, Uzbekistan and the five countries were -0.006, 0.003, 0.044, 0.016, -0.008 and -0.006, respectively, and the agricultural allocative efficiencies in 2017 were 0.036, 0.001, 0.188, -0.005, -0.003 and 0.036 (
| Year | Kazakhstan | Kyrgyzstan | Tajikistan | Turkmenistan | Uzbekistan | Five Central Asian countries |
|---|---|---|---|---|---|---|
| 1993 | -0.0059 | 0.0031 | 0.0437 | 0.0157 | -0.0085 | -0.0059 |
| 1995 | -0.0196 | -0.0011 | 0.0005 | -0.0023 | -0.0230 | -0.0196 |
| 2000 | -0.0059 | 0.0031 | 0.0437 | 0.0157 | -0.0085 | -0.0059 |
| 2005 | 0.0002 | -0.0003 | -0.0001 | 0.0000 | 0.0000 | 0.0002 |
| 2010 | -0.0357 | -0.0011 | 0.1878 | -0.0048 | -0.0034 | -0.0357 |
| 2015 | -0.0282 | 0.0061 | -0.0182 | 0.0008 | -0.0144 | -0.0282 |
| 2017 | -0.0357 | -0.0011 | 0.1878 | -0.0048 | -0.0034 | -0.0357 |
Table 3.
Agricultural allocative efficiency (AE) of the five Central Asian countries during 1993‒2017
In the stochastic frontier production function, technical efficiency is a measure of the difference between the actual output and the frontier output of a certain production unit. In addition, the change rate of technical efficiency reflects the impact of the change of relative frontier technical efficiency gap on TFP. As shown in
| Year | Kazakhstan | Kyrgyzstan | Tajikistan | Turkmenistan | Uzbekistan | Five Central Asian countries |
|---|---|---|---|---|---|---|
| 1992 | 0.301 | 0.492 | 0.472 | -0.079 | 0.072 | 0.252 |
| 1995 | 0.369 | 0.541 | 0.523 | 0.026 | 0.162 | 0.324 |
| 2000 | 0.467 | 0.613 | 0.597 | 0.177 | 0.292 | 0.429 |
| 2005 | 0.550 | 0.673 | 0.660 | 0.306 | 0.403 | 0.518 |
| 2010 | 0.620 | 0.724 | 0.713 | 0.414 | 0.496 | 0.593 |
| 2015 | 0.679 | 0.767 | 0.758 | 0.505 | 0.574 | 0.657 |
| 2017 | 0.700 | 0.782 | 0.774 | 0.537 | 0.602 | 0.679 |
Table 4.
Agricultural technical efficiency (TE) of the five Central Asian countries during 1992‒2017
The reason for the above improvements may lie in the higher efficiency of agricultural technology extension and application. It is found that improving the efficiency of agricultural technology extension in both countries has been an effective way to improve the efficiency of agricultural technology.
5 Conclusions and discussion
In this paper, stochastic frontier production function and other methods are used to systematically analyze the changes of agricultural output and factor input in five Central Asian countries, measure the agricultural total factor productivity through the model, and evaluate and analyze the technical efficiency and factor allocation efficiency from the perspective of improving efficiency. We found that, during the study period, the agricultural output of most of the five Central Asian countries increased steadily, among which the agricultural labor productivity showed a growth trend; the growth of Turkmenistan reached more than nine times; in terms of land productivity, the other four countries except Kazakhstan showed an increasing trend. In terms of factor input, the number of agricultural workers in the five Central Asian countries mainly showed a trend of decrease, the input of chemical fertilizer increased, and the amount of agricultural machinery increased or decreased within a small range. From the perspective of TFP changes, the TFP values of the five Central Asian countries have increased, but they are still at a low level, which shows that their agricultural production mainly depends on the input of capital, labor and land, while the progress of agricultural science and technology, the efficiency of factor allocation and the transformation of system and mechanism have not played a very good role. In the future, attention should be paid to the promotion and application of agricultural technology, improvement of the efficiency of agricultural technology, optimization of the allocation of agricultural production factors and enhancement of the allocation efficiency, so as to jointly promote the improvement of total factor productivity.
The main policy suggestion contained in this study is that the agricultural TFP of the five Central Asian countries must be improved. This can be achieved by following these steps: First, improve the mode of factor allocation, form a more effective combination of factor allocation, enhance the efficiency of factor allocation, and in particular pay attention to increase the input of modern factors such as agricultural machinery; second, learn from China’s experience and practice, accelerate the popularization, diffusion and application of agricultural technology, and improve the contribution rate of the progress in agricultural science and technology through the establishment of agricultural popularization and application demonstration system, etc.; third and finally, attach importance to agricultural investment, accelerate infrastructure construction, and more effectively release the “dividend” of science and technology, so as to improve the output efficiency.
References
[2] ChenW. Agricultural productivity growth, technological progress and efficiency change in China: 1990-2003. China Rural Observation, 18-23,38,80(2006).
[3] DengZ. Study on the growth and influencing factors of total factor productivity of agriculture in China. Chongqing: Southwest University(2010).
[4] FangF, ZhangY. Analysis on the change of China’s agricultural TFP and its influencing factors based on Malmquist index method from 1991 to 2008. Economic Theory and Economic Management, 5-12(2010).
[5] F?rsundF R, LovellC A K, SchmidtP. A survey of frontier production functions and of their relationship to efficiency measurement. Journal of Econometrics, 13, 5-25(1980).
[6] FriedL, SchmidtY. Accounting for environmental effects and statistical noise in data envelopment analysis. Journal of Productivity Analysis, 121-136(2002).
[7] LiY, LiT. Empirical analysis of international competitiveness of agriculture in Xinjiang and Central Asia. Agricultural Technology Economy, 121-128(2011).
[8] LiY, ZhuX. Prospect analysis of agricultural cooperation between China and five Central Asian countries under the background of agricultural “Going Out”. Issues in Agricultural Economy, 31, 42-48(2010).
[9] LiuZ. Dynamic evolution of China’s agricultural total factor productivity and analysis of its influencing factors. China’s Agricultural Resources and Regionalization, 39, 104-111(2018).
[10] LuN, ZhuL. Study on technological efficiency of agricultural environment and growth of green total factor productivity in China. Agricultural Technological Economy, 95-103(2019).
[11] MengX, ZhouH, DuL et al. Change of technical efficiency of agricultural environment and growth of green total factor productivity in China: A re-examination based on the perspective of combination of cultivation and cultivation. Issues in Agricultural Economy, 9-22(2019).
[13] NigelKey. Farm size and productivity growth in the United States Corn Belt. Food Policy, 84, 186-195(2019).
[14] PeterM. The intercountry agricultural production function and productivity differences among countries. Journal of Development Economics, 28, 121-124(1988).
[15] QuanJ. Empirical analysis of China’s agricultural total factor productivity growth: 1978-2007: Based on stochastic frontier analysis (SFA). Rural Economy of China, 36-47(2009).
[16] RadaN E, FuglieK O. New perspectives on farm size and productivity. Food Policy, 84, 147-152(2019).
[17] RuttanV W. Productivity growth in world agriculture: Sources and constraints. American Economic Association, 16, 161-184(2002).
[18] Vanden Broeck J, KoopG, OsiewalskiJ et al. Stochastic frontier models: A Bayesian perspective. Journal of Econometrics, 61, 273-303(1994).
[19] WangG G, LiuY S, LiY R et al. Dynamic trends and driving forces of land use intensification of cultivated land in China. Journal of Geographical Sciences, 25, 45-57(2015).
[20] WuJ. A brief discussion on the choice of agricultural technology progress model. Issues in Agricultural Economy, 40-43(1996).
[21] YangY, LiX, DongW et al. Assessing China’s human-environment relationship. Journal of Geographical Sciences, 29, 1261-1283(2019).
[22] ZhangJ Y, ChenY N, LiZ. Assessment of efficiency and potentiality of agricultural resources in Central Asia. Journal of Geographical Sciences, 28, 1329-1340(2018).
[23] ZhangL, CaoJ. China’s agricultural total factor productivity growth: Introduction of allocation efficiency change: An empirical analysis based on stochastic frontier production function method. China’s Rural Economy, 4-15(2013).
[24] ZhangY, YangG, YangY. The strategy of “one belt and one road”: Strengthening the opportunity of agricultural cooperation between China and Central Asia. International Economic Cooperation, 31-34(2015).
[26] ZhuX. Analysis of China’s grain productivity growth. Issues in Agricultural Economy, 2-9(1999).

Set citation alerts for the article
Please enter your email address
© Copyright 2018-2021 | Chinese Laser Press. All Rights Reserved 沪ICP备15018463号-20