Abstract
A clock laser based on a 30-cm-long ultrahigh finesse optical cavity was developed to improve the frequency stability of the Sr optical lattice clock at the National Institute of Metrology. Using this clock laser to probe the spin-polarized atoms, a Rabi transition linewidth of 1.8 Hz was obtained with 500 ms interrogation time. Two independent digital servos are used to alternatively lock the clock laser to the transition. The Allan deviation shows that the short-term frequency stability is better than and averages down followed by .Optical clocks based on neutral atoms or single ions have obtained frequency stabilities or uncertainties of a few parts in in recent years[1–6]. With excellent frequency stability and uncertainty, optical clocks are promising candidates to substitute cesium (Cs) fountain clocks to redefine and realize the International System of Units (SI) second in the future. An ultra-stable clock laser is one of the most critical components in an optical clock system. Its linewidth and frequency stability will directly affect the narrowest spectrum linewidth of the clock transition and the frequency stability of the optical clock. Meanwhile, ultra-stable lasers are key elements for the generation of low phase noise microwave signal, gravitational wave detection, coherent frequency transfer through fiber, and dual comb technique for both absolute length measurement and high precision spectroscopy[7–11]. Lasers with hertz or sub-hertz linewidths have been developed for optical clocks and other precision measurements in several labs[12–15]. A clock laser based on a 48-cm-long cavity for Physikalisch-Technische Bundesanstalt’s (PTB’s) optical lattice clock has demonstrated its short-term frequency stability of [16]. PTB’s 1550 nm fiber laser locked to a 21 cm silicon single-crystal optical cavity operating at the cryogenic temperature of 124 K has obtained a laser linewidth of 8 mHz and a short-term frequency stability of [17].
An optical lattice clock was developed at the National Institute of Metrology (NIM). A clock laser based on a 10 cm reference cavity[18] is locked to the clock transition of the spin-polarized atoms. The interleaved measurement frequency stability is averaging down as . This lattice clock’s frequency stability is mainly limited by the interrogation laser with its short-term frequency stability at . The first systematic shift evaluation was finished in 2015, and the total systematic shift uncertainty is [19]. In order to further improve the optical clock’s performance, it is critical to improve the frequency stability of the clock laser.
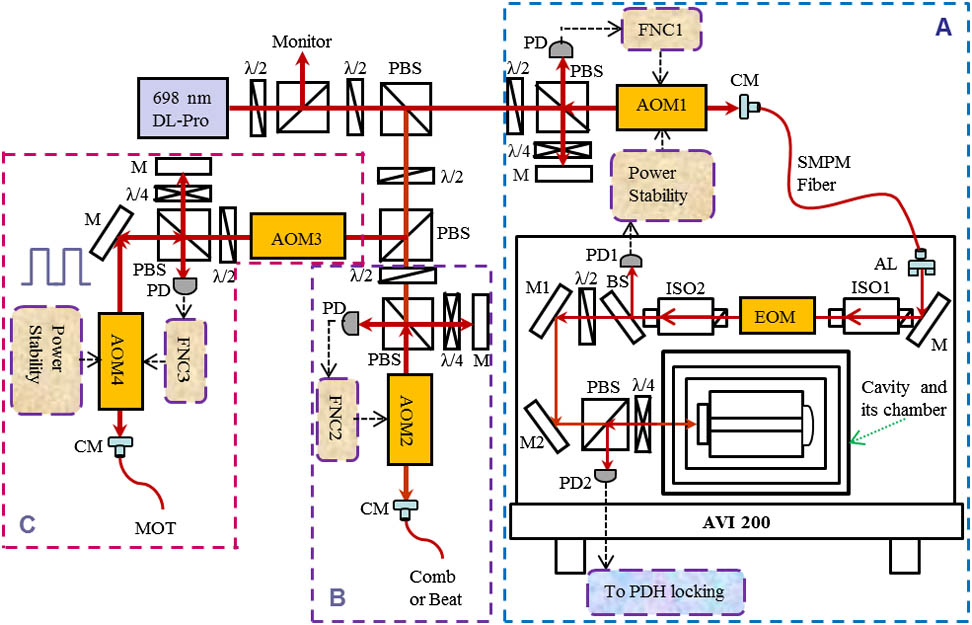
A clock laser based on a 30 cm ultrahigh finesse optical cavity is developed to further narrow the linewidth of the probed clock transition and improve the frequency stability of the optical clock system. The clock laser is based on a commercial 698 nm external cavity diode laser (ECDL, DL-Pro, Toptica Inc.). With an injection current of 60 mA, the output power of the ECDL is about 26 mW, which is enough for distributing its power for frequency locking (panel A in Fig. 1), frequency measurement (panel B in Fig. 1), and clock transition interrogation (panel C in Fig. 1).
Sign up for Chinese Optics Letters TOC. Get the latest issue of Chinese Optics Letters delivered right to you!Sign up now

Figure 1.Layout of the clock laser system. , half wave plate; , quarter wave plate; PBS, polarizing beam splitter; M, 0° or 45° reflection mirror; CM, coupling mirror; AL, aspherical lens; ISO, isolator; BS, plate beam splitter; PD, photodiode; FNC, fiber noise cancellation circuit; PDH, Pound–Drever–Hall; AVI, active vibration isolation.
The schematic layout of the clock laser is shown in Fig. 1. In the panel A, the frequency of the ECDL is locked to an ultrahigh finesse Fabry–Perot (F-P) cavity by the Pound–Drever–Hall (PDH) technique[20,21]. The output of the ECDL is first frequency shifted by an acousto-optic modulator (AOM1). The first-order diffraction beam of AOM1 is delivered to the active vibration isolation (AVI) platform through a 2-m-long single-mode polarization maintaining (SMPM) fiber. The output end of the SMPM fiber is polished flat to reflect a small part of the laser power back. The phase noise induced by this fiber is detected and compensated by AOM1[22]. An aspherical lens (AL) at the fiber output is installed on a precision translation mount to adjust the mode matching of the laser beam to the F-P cavity. A resonant electro-optical modulator (EOM, Qubig Inc.) is used to modulate the phase of the laser beam. The EOM chooses a potassium titanyl phosphate (KTP) crystal, and it has low residual amplitude modulation (RAM) noise. Two optical isolators are placed on each side of the EOM to further reduce the RAM. After the EOM, a portion of the light is detected on a photodiode (PD1). The output of PD1 is used to monitor and stabilize the light power incident to the cavity. PD2 is the PDH detector, and its output is mixed with the local oscillator (phase shifted with respect to the driving signal of EOM) on a double balanced mixer (DBM). The intermediate frequency (IF) output of the DBM is fed into a fast analog linewidth control unit (FALC, Toptica Inc.). The output of the FALC is used to lock the ECDL to the reference cavity. The closed-loop servo bandwidth of the system is .
The reference cavity has an ultralow expansion (ULE) glass with a notched cylinder spacer 30 cm long and 15 cm in diameter (Advanced Thin Films Inc.). Two fused silica mirrors (M), one planar and the other concave with 1 m radius of curvature, are optically contacted on the spacer. Two ULE rings are attached to the rear sides of both mirrors, as proposed in Ref. [23]. The finesse of the transverse mode () of the cavity is measured at by the cavity ring-down method. The cavity is horizontally mounted on a Zerodur baseplate with four diameter silicone balls. Figure 2 shows the cavity and its supporting base design.
Figure 2.30-cm-long ULE reference cavity and the Zerodur supporting base.
The vibration sensitivity of this cavity support is measured as referenced to our stable laser based on a 10 cm cavity (SL10, panel B in Fig. 1). A sinusoidal excitation signal is applied to the AVI platform along three directions, respectively. The applied actual acceleration is measured by an accelerometer (PCB Inc.). The corresponding frequency fluctuation of beat between these two stabilized lasers was recorded. The induced relative frequency stability is the fluctuation of the beat frequency divided by the laser frequency. The vibration sensitivity is obtained by dividing the relative frequency stability with the measured acceleration. For this 30 cm cavity design, the vibration sensitivity was determined to be 4.66 (vertical direction), 1.02 (optical axis direction), and 2.33 (the other horizontal direction) at 3 Hz excitation frequency, where g represents the gravitational acceleration. The measured vibration noise on the AVI platform along three directions is below for the frequency range of 1 Hz to 100 Hz. So, the locked laser frequency instability induced by the vibration noise is evaluated at level.
The reference cavity is held in a vacuum chamber with a residual gas pressure of . One active temperature stabilization layer and two passive heat shields are installed inside the vacuum chamber. The temperature of the cavity is stabilized by three thermoelectric coolers (TECs) triangularly distributed between the vacuum shield and the active temperature stabilization layer. Two passive heat shields are supported and heat isolated by three triangularly distributed polyetheretherketone (PEEK) balls. Figure 3 shows the structure of the vacuum chamber. The zero-crossing thermal expansion temperature of the cavity is measured by a comb and estimated to be near 0°C, but, for convenience, the temperature is stabilized at 12°C at present.
Figure 3.Structure of the vacuum chamber with cavity’s temperature stabilization layers.
The intensity fluctuation of the light incident into the cavity is an important factor affecting the laser frequency stability[24]. The intensity sensitivity of this ultra-stable laser is calculated by the beat frequency variation referenced to the SL10 divided by the laser intensity change. In our case, this sensitivity is . For stabilizing the laser intensity, the output of PD1 in Fig. 1 is compared with a voltage reference, where its output serves to control the driving power of AOM1. When the laser intensity is stabilized, its influence on frequency stability is reduced to below from 1 to 100 s averaging time.
The variation of RAM with time is another main factor leading to the frequency stability degradation. In the PDH technique, this variation is manifested as the error signal base line voltage fluctuation. When the laser frequency is tuned to a fixed point off the cavity resonance, the voltage fluctuation is recorded by a high precision multi-meter (Keithley 2700). The coefficient for converting the error signal voltage fluctuation to the frequency variation needs to be calibrated. While the laser frequency is scanned over the cavity resonance, the peak to peak voltage of the error signal is measured. The coefficient is then calculated as the linewidth of the cavity mode divided by this voltage. In our case, the coefficient is 10.7 Hz/mV. The measured frequency stability influenced by RAM is evaluated below from 1 to 20 s averaging time. This value will not have an effect on obtaining a stable laser with frequency stability.
In order to evaluate a clock laser’s linewidth and its frequency stability, generally, another ultra-stable laser with similar or better performance is needed. In our case, since there is only one long-cavity clock laser, the Sr optical lattice clock setup can be used to estimate the clock laser’s performance.
The output of the clock laser is delivered to the magneto-optical trap (MOT) region of atoms by a 15-m-long SMPM fiber (panel C in Fig. 1). AOM3 is driven by a signal generator (AFG3252) combined with a direct digital synthesizer (DDS). The signal generator is used to scan the clock transition spectrum. The DDS is used for the real-time compensation of the frequency drift (typically below 0.2 Hz/s) of the clock laser to tens of millihertz per second (mHz/s). The probe pulse length is controlled by AOM4, which is also used for fiber noise cancellation and power stabilization of the clock laser.
The layout of coupling the clock laser and the lattice laser into the MOT is shown in Fig. 4. For stabilizing the delivered clock laser power, of the light transmitted through M1 is received by PD1. For phase noise compensation induced by the fiber, of the light reflected by M2 is used. The clock laser is precisely co-aligned with the lattice laser from the opposite direction. M3 is a dichroic mirror for reflecting the lattice laser back to form a standing wave lattice. M2 and M3 are mounted in one cage structure to ensure a synchronized movement.
Figure 4.Layout of the 698 nm clock laser and 813 nm lattice laser into MOT. CM, collimating mirror; M, mirror; ND, neutral density filter; GM, Glan–Tylor prism; L, lens; PD, photodiode.
The lattice depth ramping down–up procedure is applied by controlling the power of lattice light. When the optical lattice depth ramps down, only atoms with energies below the barrier will be kept in the lattice[25]. After two stages of laser cooling and one-dimensional optical lattice trapping, the atoms’ temperature in the lattice was cooled to in the longitudinal axis and in the radial direction. Then, the atoms are optically pumped to the () single-spin state. The clock laser’s frequency is scanned to obtain a Rabi spectrum of the clock transition. With the pulse length of 500 ms, the clock cycle time 1.3 s, and stepping the clock laser frequency by 1 Hz, the obtained narrowest Rabi transition linewidth is 1.8 Hz, as shown in Fig. 5. The residual drift of the clock laser is 18 mHz/s, and its effect on the transition linewidth is . Therefore, we believe the linewidth of our clock laser is not worse than the 1.8 Hz probed transition linewidth.
Figure 5.Transition spectrum of a single component of the transition with a Rabi excitation pulse width of 500 ms. The red solid line is a fitting with the Rabi line shape.
In order to lock the clock laser to the transition of the spin-polarized atoms, AOM3 (Fig. 1) is used to modulate the laser frequency to the two shoulders of the atoms’ transition. The difference of the transition probabilities reflects the frequency differences between the interrogation laser and the center of the atomic transition, which is used as the error signal of the digital proportional integral differential (PID) controller. For a robust lock, we use a 200 ms interrogation time, which corresponds to a Fourier-limited Rabi linewidth of . The total clock cycle time is 770 ms.
The central frequency of AOM3 is given by , which is the difference between the center of the atomic transition and the clock laser. Taking the atomic transition spectrum as a low noise reference, the calculated Allan deviation of AOM3’s central frequency represents the frequency stability of the clock laser. The calculated Allan deviation is shown in Fig. 6 as the blue squares. The frequency stability is better than with the averaging time shorter than 10 s.
Figure 6.Frequency stability evaluation when the clock laser is locked to the atomic transition. The blue squares display the one-loop measurements, and the black circles are the time-interleaved measurements. The sampling time of the measurement is 3.08 s. The error bar shows the confidence interval of the measurement, which is calculated from the measurement dataset[26].
The interleaved measurement method is used to verify the frequency stability improvement of our lattice clock. The schematic of the interleaved measurement method is shown in Fig. 7. The interleaved measurement period consists of four clock cycles, and the sampling time of this measurement is 3.08 s. Two independent servos with different PID parameters are used. The difference between the time-interleaved measurements[27] is recorded, and the calculated Allan deviation represents the measurement frequency stability.
Figure 7.Schematic of the interleaved measurements.
The calculated Allan deviation of the interleaved measurement data is also shown in Fig. 6 as black circles. The frequency stability is better than with an averaging time shorter than 24 s and averages down following , as the red line indicates in Fig. 6. This value has a four-fold improvement compared to our previous results in Ref. [19], and this corresponds to 1/16 measurement time to obtain the same frequency stability. The short-term frequency stability of the time-interleaved measurement is mainly limited by the interrogation laser[28,29].
In conclusion, a clock laser based on a 30-cm-long reference cavity is developed in our lab. Using this clock laser to probe the clock transition of the spin-polarized Sr atoms, the Rabi linewidth of 1.8 Hz is obtained with a pulse width of 500 ms. When the clock laser is locked to one stretched state of the spin-polarized Sr atoms, a frequency stability better than for short-term averaging time can be obtained and averages down following . This optical lattice clock with the clock laser is still under improvement, and it is expected to realize an optical clock with the frequency stability at level after several hours’ close-loop operation.
References
[1] N. Hinkley, J. A. Sherman, N. B. Phillips, M. Schioppo, N. D. Lemke, K. Beloy, M. Pizzocaro, C. W. Oates, A. D. Ludlow. Science, 341, 1215(2013).
[2] B. J. Bloom, T. L. Nicholson, J. R. Williams, S. L. Campbell, M. Bishof, X. Zhang, W. Zhang, S. L. Bromley, J. Ye. Nature, 506, 71(2014).
[3] T. L. Nicholson, S. L. Campbell, R. B. Hutson, G. E. Marti, B. J. Bloom, R. L. McNally, W. Zhang, M. D. Barrett, M. S. Safronova, G. F. Strouse, W. L. Tew, J. Ye. Nat. Commun., 6, 6896(2015).
[4] I. Ushijima, M. Takamoto, M. Das, T. Ohkubo, H. Katori. Nat. Photon., 9, 185(2015).
[5] N. Huntemann, C. Sanner, B. Lipphardt, C. Tamm, E. Peik. Phys. Rev. Lett., 116, 063001(2016).
[6] S. L. Campbell, R. B. Hutson, G. E. Marti, A. Goban, N. Darkwah Oppong, R. L. McNally, L. Sonderhouse, J. M. Robinson, W. Zhang, B. J. Bloom, J. Ye. Science, 358, 90(2017).
[7] T. M. Fortier, M. S. Kirchner, F. Quinlan, J. Taylor, J. C. Bergquist, T. Rosenband. Nat. Photon., 5, 425(2011).
[8] B. P. Abbott, R. Abbott, T. D. Abbott, M. R. Abernathy, F. Acernese, K. Ackley. Phys. Rev. Lett., 116, 061102(2016).
[9] K. Predehl, G. Grosche, S. M. Raupach, S. Droste, O. Terra, J. Alnis. Science, 336, 441(2012).
[10] I. Coddington, W. C. Swann, L. Nenadovic, N. R. Newbury, W. C. Swann. Nat. Photon., 3, 351(2009).
[11] Q. Liu, S. Han, J. Wang, Z. Feng, W. Chen, N. Cheng, Y. Gui, H. Cai, S. Han. Chin. Opt. Lett., 14, 070602(2016).
[12] A. D. Ludlow, X. Huang, M. Notcutt, T. Zanon, S. F. Foreman, M. M. Boyd, S. Blatt, J. Ye. Opt. Lett., 32, 641(2007).
[13] Y. Y. Jiang, A. D. Ludlow, N. D. Lemke, R. W. Fox, J. A. Sherman, L. S. Ma, C. W. Oates. Nat. Photon., 5, 158(2011).
[14] T. Kessler, C. Hagemann, C. Grebing, T. Legero, U. Sterr, F. Riehle. Nat. Photon., 6, 687(2012).
[15] L. Wu, Y. Jiang, C. Ma, W. Qi, H. Yu, Z. Bi, L. Ma. Sci. Rep., 6, 24969(2016).
[16] S. Häfner, S. Falke, C. Grebing, S. Vogt, T. Legero, M. Merimaa, C. Christian, U. Sterr. Opt. Lett., 40, 2112(2015).
[17] D. G. Matei, T. Legero, S. Häfner, C. Grebing, R. Weyrich, W. Zhang, L. Sonderhouse, J. M. Robinson, J. Ye, F. Riehle, U. Sterr. Phys. Rev. Lett., 118, 263202(2017).
[18] Y. Li, Y. Lin, Q. Wang, S. Wang, Y. Zhao, F. Meng, B. Lin, J. Cao, T. Li, Z. Fang, E. Zang. Chin. Phys. Lett., 31, 66(2014).
[19] Y. Lin, Q. Wang, Y. Li, F. Meng, B. Lin, E. Zang, Z. Sun, F. Fang, T. Li, Z. Fang. Chin. Phys. Lett., 32, 090601(2015).
[20] R. W. P. Drever, J. L. Hall, F. V. Kowalski, J. Hough, G. M. Ford, A. J. Munley, H. Ward. Appl. Phys. B, 31, 97(1983).
[21] Z. Xiong, Y. Long, H. Xiao, X. Zhang, L. He, B. Lü. Chin. Opt. Lett., 9, 041406(2011).
[22] L. S. Ma, P. Jungner, J. Ye, J. L. Hall. Opt. Lett., 19, 1777(1994).
[23] T. Legero, T. Kessler, U. Sterr. J. Opt. Soc. Am. B, 27, 914(2010).
[24] W. Qi, Y. Jiang, X. Li, L. Jin, Z. Bi, L. Ma. Chin. Opt. Lett., 14, 101401(2016).
[25] S. Falke, N. Lemke, C. Grebing, B. Lipphardt, S. Weyers, V. Gerginov, N. Huntemann, C. Hagemann, A. Al-Masoudi, S. Häfner, S. Vogt, U. Sterr, C. Christian. New J. Phys., 16, 073023(2014).
[26] . IEEE Standard Definitions of Physical Quantities for Fundamental Frequency and Time Metrology—Random Instabilities(1999).
[27] S. Falke, H. Schnatz, J. S. R. V. Winfred, T. Middelmann, S. Vogt, S. Weyers, B. Lipphardt, G. Grosche, F. Riehle, U. Sterr, C. Christian. Metrologia, 48, 399(2011).
[28] A. D. Ludlow, T. Zelevinsky, G. K. Campbell, S. Blatt, M. M. Boyd, M. J. Martin, S. M. Foreman, J. Ye, T. M. Fortier, Y. Le Coq, Z. W. Barber, N. Poli, C. W. Oates. Science, 319, 1805(2008).
[29] T. L. Nicholson, M. J. Martin, J. R. Williams, B. J. Bloom, M. Bishof, M. D. Swallows, S. L. Campbell, J. Ye. Phys. Rev. Lett., 109, 230801(2012).