Qiang Zhou, Rong Qiu, Yong Jiang, Xiang Gao, Yongjia Yang, Huili Wang, Huan Ren. Ultra-fast diagnosis of shock waves and plasma at front and rear surfaces in the bulk of fused silica induced by an Nd:YAG pulse laser[J]. Chinese Optics Letters, 2016, 14(5): 051402
Copy Citation Text
We investigate the dynamic processes of the Nd:YAG pulse laser ablation of fused silica by ultrafast time-resolved optical diagnosis with a nanosecond time resolution. The evolution process of plasma expansion in air and shock waves propagation in the bulk are both obtained with spatial and temporal resolutions. Laser-induced damage in the bulk of fused silica with filaments and shock waves are observed. Thermoelastic wave, mechanical wave, and shock wave dependence on the laser fluence and intensity of the plasma are analyzed. The shock pressure and temperature calculated through the measured shock velocity and the Hugoniot data of fused silica are measured.
Laser-induced breakdown in the bulk of transparent dielectric materials may generate a hot and dense plasma[1,2], inducing shock waves and leading to the compression of materials in extreme conditions of temperature and pressure[3,4]. Temperature and electron number densities in the plasma can be determined from spectroscopic measurements of the optical emission, and the pressure and temperature of the shocked air behind the shock wave front can be estimated from its shock wave velocity[5]. Analytical models of laser-supported detonation wave (LSDW), the phase expansion theory, and high-speed shadowgraphy techniques have been successfully applied to explain and describe the shock wave propagation in air[6,7]. For shock wave generation and propagation in dielectric materials, they much depend on the temperature gradient or mechanical reaction induced by the exposure of the material[8,9].
Instantaneous velocity measurements of laser-induced shock waves play an important role in laser-assisted applications[9]. The shock pressure and shock temperature of the surface related to the shock wave propagation velocity are crucial parameters for the study of the phase explosion process[10]. However, details of shock wave propagation and shock pressure and temperature in material induced by laser ablation are unknown. The shock pressure and shock temperature , which are difficult to measure, are always determined with the shock velocity and particle velocity with Hugoniot–Tankine relations[11]. So shock velocity contains important information about the laser-material interaction, such as that necessary to calculate the instantaneous shock pressure and shock temperature [12].
In this work, we employ an ultrafast time-resolved optical diagnosis system to capture the evolution of a shock wave in fused silica and plasma expansion in air. Under the condition of one-dimensional shock waves, the instantaneous shock pressure and shock temperature in fused silica can be calculated with the measured shock velocity and the Hugoniot data of fused silica[13]. The experimental method is helpful in investigating the velocity measurements of laser-induced shock waves in optical materials and in measuring the corresponding instantaneous shock parameters in the bulk of a material.
Sign up for Chinese Optics Letters TOC. Get the latest issue of Chinese Optics Letters delivered right to you!Sign up now
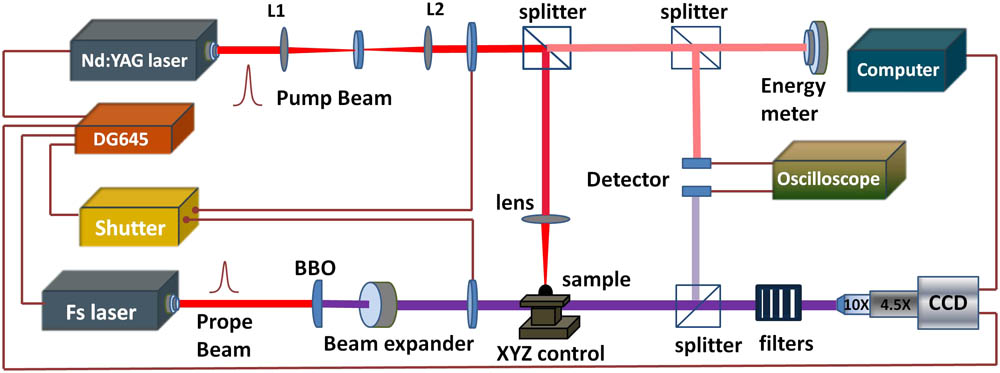
A schematic of the experimental apparatus is shown in Fig. 1. A fused silica target () with all surfaces polished has been mounted on an XYZ translation stage and ablated by a nanosecond laser pulse. A -switched Nd:YAG laser (Quanta-Ray, Spectra Physics) that emits 16 ns (FWHM) pulses with max energies of 1 J (1064 nm) and 0.5 J (532 nm) is employed as the pump laser. A Ti:sapphire femtosecond laser amplifier with a pulse duration of 50 fs and a central wavelength of 800 nm is used as the probe beam. The pump laser beam is focused through a focusing lens (), and the focal-spot diameter varies between 80 and 150 μm at the surface and in the bulk. The probe beam, which is passed through a BBO crystal, is perpendicular to the pump laser beam and directed to a CCD camera (MegaPlus ES3200). The images are acquired using microscope systems comprised of a long working distance objective and a zoom lens. The delay time was obtained using a photodiode connected to a digital oscilloscope (Wave Surface XS). The pump laser, probe laser, CCD camera, and mechanical shutter are electronically synchronized by a digital pulse-delay generator (Stanford, DG 645). All spot morphologies are near Gaussian through a system. The peak intensities used in this experiment are much larger than the surface damage threshold intensity () to make the breakdown events deterministic.
Figure 2 shows the time-resolved images of plasma expansion in air and the shock wave progressing into the material. The ablation region placed at the geometry focal point (with ) was ionized, and the formed plasma absorbed the falling part of the laser energy, shielding the incoming laser beam due to the inverse bremsstrahlung effect. The gas in front of the plasma is highly compressed, and a shock wave front forms with a high density, as shown in Fig. 2. The plume in Fig. 2(a) induced by the 1064 nm laser () develops in a columnar shape at the early stage of expansion and then slowly turns into a ellipsoid. Figure 2(b) shows that the shape of the shock wave front induced by the 532 nm laser () was spherical, which is similar to the aluminum and silicon ablation with nanosecond laser pulses[8,14]. It shows that the plasma plume expansion strongly depends on the incident laser wavelength as well as the position of the focal point for the case of oblique incidence.
Figure 2.Time-resolved images of shock waves generated by 1064 and 532 nm pulse lasers at fused silica’s front surface with fluences of 27.6 and , respectively.
The shock wave will reach its maximum speed in a short time () after the termination of the laser pulse. During the early stage () shown in Fig. 2, the perpendicular and lateral expansion velocities of the plasma plume (ionized vapor) expand very quickly, with an average speed in the order of . The expansion in the perpendicular direction was faster than that in the lateral direction for the shock wave in air. All of them will slowly reduce to the acoustic velocity due to the air resistance.
The shape of the shock wave induced by the 1064 nm laser pulse is anisotropically different from the spherical wave induced by the 532 nm laser pulse when the distance from the lens to the target surface is equal to the focus length. The LSDW theory can be used to explain the plasma generation and shock wave propagation in air induced by the 1064 nm laser; this explanation is shown in Fig. 2(a). Much of the previous work in the literature shows that the laser-induced shock wave front can be fitted reasonably well by the blast wave theory[15]. The shock wave propagation after the 532 nm laser pulse ablation in this work can be well fitted with the blast wave theory as shown in Fig. 2(b), especially the relationship of the shock radius to the released energy by the relation [14]. The shock wave progressing into the bulk of fused silica shown in Fig. 2 is not very obvious to observe, which is due to the laser energy dissipated into the air with plasma shielding. Only the unstable shock wave, which is considered to be dependent on the intensity of the plasma and its propagation speed, is mainly captured in the fused silica.
The experimental results here present the simultaneously dynamic process inside the target shown in Fig. 3. Surface and bulk damage, Kerr-induced self-focusing, and stimulated Brillouin scattering are proposed to interpret the origin of the nanosecond laser-induced damage of fused silica[16]. The shock wave with the inconsistent shock velocity around the filament along the laser direction shown in Fig. 3 is likely caused by multi-photon ionization, which is the same as picosecond and femtosecond laser-induced electronic excitation[17,18]. Judging from the expansion displacement of the shock wave 3 shown in Fig. 3(b), the micrometric plasma channel should be progressing in the reverse direction of the incident laser beam.
Figure 3.Time-resolved images of 532 nm pulse laser ablation in the bulk of fused silica with fluence of .
The typical () ones shown in Fig. 3 may be formed through the self-focusing effect, but the irregularly distributed little () ones shown in Fig. 3(a) should result from the impurities and defects inside the target. The distribution of the little microburst point was not located in the path of the filament. In contrast, the typical microburst point is well located on the filament, judging from the fact that the shock wave line is tangential to the shock wave 3 in Fig. 3(b). Besides, the shock velocity of the typical microburst point is faster than that of smaller ones seen in Fig. 3. Therefore, it can be concluded that the typical microburst point bursts at same time as the formation of the filament induced by the incident laser. The typical ones () or smaller ones () burst with two shock waves. The first shock wave should be the thermoelastic wave generated from the thermal expansion of the heated region. For the generation of the second shock wave, it should be generated due to the mechanical expansion of the crack growth in the focused region.
Figure 4 shows the expansion distance of shock waves 1 and 2 as a function of the delay time. It shows a linear relationship between the propagation distance and the transit time of the shock waves at the delay time of . The propagation velocity values of shock waves 1 and 2 are and , respectively, as determined by the linear fit with the coherent coefficient of 0.99. The expansion of shock waves 1 and 3 coincide in the earlier delay time, and they will be separated in the latter, which leads us to conclude that the velocity of shock wave 3 is larger than that of shock wave 1. So the expansion velocity of shock wave 3 perpendicular to the direction of the incident laser is not the same.
Figure 4.Shock wave expansion distance as a function of delay time.
Figure 5 represents the time-resolved images of the rear-side shock waves in air and glass induced by 532 and 1064 nm lasers. The energy is mostly confined inside the material without plasma shielding and is dissipated in the air. This can be qualitatively explained by the fact that with the high-energy deposition efficiency at the rear surface, there is more severe cracking and a higher removal rate and a stronger shock wave. Shock waves propagate into the material with a form of spherical wave shown in Fig. 5, while the shock wave in air was ellipsoidal under the irradiation of pump laser with 1064 or 532 nm. The shadowgraphy images of the phase objects are sensitive to the second derivative of the refractive-index distribution[19]. Therefore, shock wave A appears as a succession of three alternating bright and dark bands, as shown in Fig. 5.
Figure 5.Time-resolved images of plasma and shock waves induced by 532 and 1064 nm pulse laser ablation fused silica at rear surface with fluences of 12.4 and .
The temperature of the surface material rises sharply after absorbing the laser energy in a short period of time and then generates a temperature gradient in the surrounding material that is caused by thermal expansion, resulting in thermal elasticwave A[6]. Shock wave B shown in Fig. 5 could be attributed to the mechanical reaction. When material ejection occurs, it will cause a mechanical reaction in the reverse direction of the laser beam. For shock wave C in Fig. 5, its occurrence is dependent on the plasma induced in air and the intensity of the incident laser[7]. The propagation distance of shock wave C did not present a linear relationship with the delay time, which makes it difficult to measure its propagation velocity. Figure 6 also shows a linear relationship between the propagation distance and shock wave expansion distance for A, B, and C as a function of the measured delay time (). Shock waves A and B expand in the form of uniform propagation in the range of the measured delay time. But the propagation velocity of third shock wave decreases fast, which makes it difficult to accurately measure its progress velocity.
Figure 6.Shock wave expansion distance as a function of delay time.
Figure 7 shows a comparison of the shock waves in air and glass obtained at the rear surface after nanosecond laser ablation at a wavelength of 532 nm (). The formation of the dark line results from the change in the refractive index of the material, which is caused mainly by high-density gradients. For laser irradiation intensities exceeding , heating the sample above the boiling point is possible and a superheated and metastable liquid layer may be formed. Miotello and Kelly[20] reported that the homogeneous nucleation within this liquid layer is one possible mechanism that could be responsible for material removal during high-power laser heating. The mass removal in the form of micron-sized droplets shown in Fig. 7 can be result from the hydrodynamic instability of the molten liquid layer. Then, the ejected material can exert a recoil pressure-induced shock wave front B on the melted region surface, and melted region returns to the solid phase at a delay time[21]. The size of the ejected material clusters is measured around a diameter of 50 μm at the delay time of 803 ns, and the onset of the removal of large material flakes will be continued, extending the delay up to tens of microseconds[22].
Figure 7.Time-resolved images of laser ablation fused silica rear surface by using 532 nm laser with fluence of . The features labeled in the figures are shock wave front S, the ionization area I, contact front D, ejected material E, thermal elastic wave A, and mechanical shock wave B.
The propagation distance for shock waves can be measured from the shock front transitions in the bulk of fused silica and shock wave reflections from the air/fused silica interface, causing the elastic deformation of the surface[23]. So the shock wave propagation velocity in fused silica can be determined from . For 2 mm-thick fused silica, the shock wave (under the acoustic velocity : ) traversed the fused silica; it needs about 350 ns. Then the shock wave will be reflected at the air/fused silica interface, which is helpful to continue observing the shock wave propagation in fused silica. The fused silica impedance is 5 orders of magnitude higher than that of air (under standard atmospheric pressure). With the low energy loss in the reflection process, the shock wave reflection can be regard as free edge reflection. The best fits of the data in Figs. 4 and 6 with high coherent coefficients indicate that the shock velocity can be well calculated from the shock wave expansion distance as a function of the delay time.
The shock velocity in fused silica can be well directly measured by the ultrafast time-resolved optical diagnosis with high repeatability. The shock wave velocity in condensed matter has a relationship with particles , which can be shown by the following relationship: . Above all, the pressure and the shock compression coefficient η can be written as follows[11,24]:
The Hugoniot constants and are always measured by using the Hugoniot data obtained by the impedance-match technique[25]. and are two of the coefficients in the Hugoniot relation that can be calculated with the method of least squares using the shock velocity (Us) and particle velocity (Up). For fused silica, the Grüneisen parameter is 0.02 under the thermal expansion coefficient of , which is significantly lower than more ordinary materials, where it ranges from 1.0 to 3.0[10].
The relevant shock wave parameters of the fused silica used here are listed in Table 1. Shock wave pressure can be calculated as a function of the shock velocity presented in Fig. 8. The shock wave pressure can be calculated as a function of the shock velocity presented in Fig. 6. The error mainly came from the Hugoniot parameters of the fused silica used here. So for the measured shock wave velocity corresponding to shock waves 1 and 2 in the bulk of fused silica shown in Fig. 4, the determined values of shock pressure are 56.5 and 19.7 GPa, and the shock compression coefficients η are 0.52 and 0.42, respectively. This illustrates that the shock wave caused by thermal expansion leads to a much higher shock pressure than that caused by the mechanical reaction in the bulk. The shock pressures and compression coefficients of shock waves 1 and 2 after can be also calculated through the equation with the measured velocity , as shown in Fig. 8. The calculated values of shock pressure are in good agreement with the obtained results of the laser shock Hugoniot data in Ref. [12]. But for shock wave 3, the propagation velocity will be reduced quickly and the distance captured with a fluctuation did not have a linear relationship with the delay time. So it is difficult to measure its shock velocity, and then the shock pressure cannot be calculated directly.
cv(Jkg−1K−1)
c0 (kms−1)
Density ρ (gcm−3)
Gruneisen parameter γ0
λ
Fused silica
415
1.89
2.204
0.02
1.392
Table 1. Hugoniot Parameters of Fused Silica Used Here
With the shock velocity and a known Grüneisen equation for the state of the fused silica, the shock heated temperature can be deduced from the following equation[11,25]: where is the initial temperature, is the Grüneisen parameter, and the specific heat capacity at a constant volume is .
The shock-heated temperature in the nanosecond laser-shocked fused silica can be determined through the experimental data. The shock-heated temperature corresponding to the shock waves can be calculated with the given compression coefficient in Eq. (3). For the shock wave velocity , the shock-heated temperature value is approximately 9980 K. The uncertainty error not only comes from the experimental error discussed, above all, but also comes from the Grüneisen parameters of the fused silica used here for calculation. It has only shown a linear relationship between the propagation distance and the transit time ().
In conclusion, we show that differences in the absorbed energy are most probably responsible for differences between the shock wave and plasma expansion at the front surface and rear surface. There are three types of shock waves observed from the time-resolved images under enough laser intensity. It is found that the appearance of the third shock wave is dependent on the laser fluence and the intensity of the plasma. For a laser focused in the bulk of fused silica, the first and second shock waves are considered to be induced by the thermal expansion after laser irradiation, while the third is generated due to the mechanical expansion of the crack growth. The shock velocity in fused silica is also experimentally determined from the time-resolved optical diagnosis. With the obtained Grüneisen parameters of fused silica, the shock pressure and the shock-heated temperature in fused silica are calculated. So this present experimental system will allow us to observe ultra-fast shock phenomena in opaque materials with ultrahigh temporal resolutions.
Qiang Zhou, Rong Qiu, Yong Jiang, Xiang Gao, Yongjia Yang, Huili Wang, Huan Ren. Ultra-fast diagnosis of shock waves and plasma at front and rear surfaces in the bulk of fused silica induced by an Nd:YAG pulse laser[J]. Chinese Optics Letters, 2016, 14(5): 051402