1School of Science, Changchun University of Science and Technology, Changchun 130022, China
2School of Physical Sciences, University of Chinese Academy of Sciences, Beijing 100049, China
3Shandong Provincial Engineering and Technical Center of Light Manipulations & Shandong Provincial Key Laboratory of Optics and Photonic Device, School of Physics and Electronics, Shandong Normal University, Jinan 250014, China
We show the intensity control of filamentation in fused silica by temporally shaping the femtosecond laser pulse. The arbitrary control of filamentation intensity has been obtained by the feedback control based on the genetic algorithm, and the peak intensity of filament has changed from about 670 to around 2100 (charge-coupled device counts). This modulation is in qualitative agreement with the simulation results. It is shown that the control of the intensity is realized by modulating the peak power of the shaped pulse.
When the femtosecond laser pulse with a high power propagates in solid optical media, filamentation will occur due to the dynamic competition between the Kerr self-focusing effect and the defocusing of the plasma generated by the multiphoton ionization[1]. A long distance non-diffraction filament has a clamped intensity and a high electron density. The nonlinear process provides an important tool for micromachining in solid or modifying the refractive index of medium temporarily or permanently. Therefore, the filamentation in the solid medium has been used for many applications, including micro–nano channel processing[2,3], filament waveguides[4,5], volumetric optical elements[6–8], optical switch[9], and so on. For these applications, it is necessary to control the properties of filament in solid, including the filament position, length, distribution, and intensity. Up to now, various methods have been used for the modulation of filamentation in solid, such as adjusting the initial pulse energy, chirp, polarization direction, the initial spatial intensity distribution, spatial phase distribution, and the focusing conditions[10–21]. By using these methods, the characteristics of filamentation can be effectively controlled. Another method is to shape the femtosecond laser pulse. The position and length of filamentation can be controlled by using the shaped pulse[22–24]. By using the pulse shaping technique based on the genetic algorithm (GA), the modulation of filamentation could be realized. On the other hand, the intensity modulation of filamentation is also critical to the micromachining. It is important for the applications if the intensity can be continuously modulated. But, the intensity modulation of filamentation in solid by the shaped laser pulse is still lacking of report.
In this Letter, we studied intensity modulation in the filaments by the temporally shaped femtosecond laser pulse. Based on the feedback control of the GA, the intensity of filamentation in fused silica can be adjustable arbitrarily in a certain range. The fluorescence peak intensity of filaments changes from about 670 to around 2100 [charge-coupled device (CCD) counts]. Moreover, we numerically simulated the propagation process of the shaped pulses in fused silica and obtained coincident results. The physical relationship between the pulse waveform and the filament intensity was further studied.
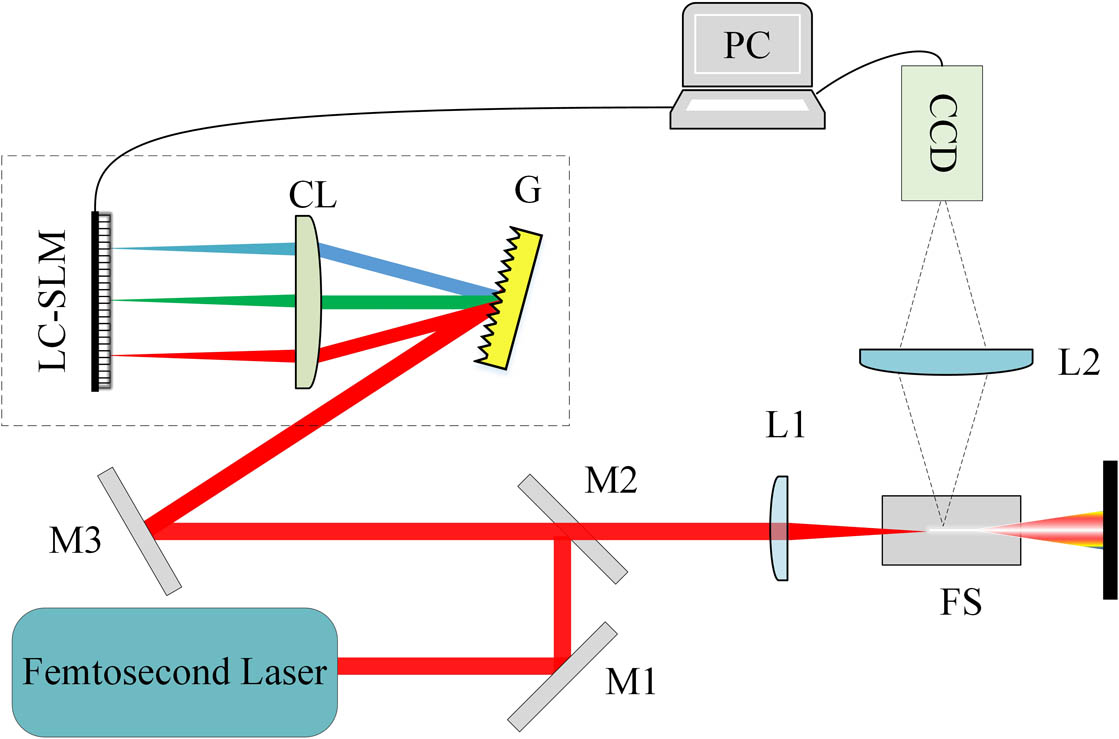
The schematic of the experimental setup is shown in Fig. 1. The laser pulse is generated from a regeneratively amplified Ti:sapphire femtosecond laser system (Spitfire, Spectra Physics) at a central wavelength of 800 nm, with a duration of 50 fs and repetition rate of 1 kHz. The shaping control of the femtosecond laser pulse is realized by a device consisting of a zero-dispersion system and a two-dimensional (2D) phase-only liquid crystal spatial light modulator (LC-SLM, Hamamatsu X11840) in its Fourier plane, as shown in the dashed line frame of Fig. 1. The system is composed of a diffraction grating with 1200 lines/mm and a cylindrical lens with a 300 mm focal length. The compensation phase mask is added onto the LC-SLM through a computer, and then the shaped laser pulse is generated with an energy of 4.8 μJ. Then, the shaped laser pulse is sent out above the mirror M2 and focused by the lens L1 with a focal length of 200 mm into a fused silica block. The distance between the lens L1 and the front surface of the fused silica block is 180 mm. The size of the fused silica block is . The filament in the fused silica block is imaged by lens of L2 with a focal length of 100 mm and recorded by a CCD (Princeton Instruments, PIXIS 1024B). The integration time of the CCD camera is 500 ms. To eliminate the influence of scattered fundamental laser light, one shortpass filter (FESH700, Thorlabs) is used before the CCD. Under the condition of the experiment, the accumulative effects of local refractive index change in the fused silica can be ignored.
Sign up for Chinese Optics Letters TOC. Get the latest issue of Chinese Optics Letters delivered right to you!Sign up now
Figure 1.Schematic of the experimental setup. M, 800 nm high reflection mirror; G, grating; CL, cylindrical lens; LC-SLM, liquid crystal spatial light modulator; L1, L2, plano-convex lens; FS, fused silica block.
In the experiment, the flowchart of the feedback control, which is based on the GA, is similar to that in Ref. [23]. First, 50 initial phase masks are generated randomly and successively added to the LC-SLM to generate the shaped femtosecond laser pulses. For each phase mask, 20 images are recorded. Second, the on-axis relative intensities of the filaments are extracted from the images, respectively. For each phase mask, the average of the 20 peak intensities is used to be the fitness value of the algorithm, based on which the phase masks are evaluated and ranked. In the algorithm design, the whole field of view of the CCD is designated as the range for the filamentation intensity collection and analysis. Third, the better 20 of the 50 cases are reserved to create 50 new phase masks for the next generation by using the methods of crossover and mutation. The loop iterates by this way and will end as soon as the preset fitness is satisfied.
Figure 2 shows the evolution of the on-axis intensity of the filaments of the shaped pulse as a function of propagation distance from different generations. The origin of the propagation distance denotes the position of the front surface of the fused silica block. We can see from the figure that within the first 16 generations, the filament intensity gradually increases with the increase of the generation number. Meanwhile, both the starting and ending positions of the filament become earlier, and the length of the filament becomes slightly longer. With the increase of the generation number, the filament intensity will reach a maximum, and the filament zone becomes relatively stable. On the other hand, the filaments show a clear refocusing phenomenon. The evolution of filament intensity and the formation of the refocusing trail will be explained by the numerical results, shown in the following discussion. The shifting of the whole filament and the change of the filament length can be clearly seen in Fig. 3, where the evolutions of the filament from several typical generations are shown. To see the change of the peak intensity, we plot the maximum intensity of filaments for each generation in Fig. 4. It is shown obviously that the maximum intensity of filaments increases firstly and then is saturated. The relative intensity changes from about 670 to around 2100 (CCD counts) during the feedback control. Here, the intensity is the fluorescence intensity of filament, which can qualitatively characterize the laser intensity and the electron density of the filament. Therefore, we can draw a conclusion that the refractive index of the medium within the filament zone can be controlled continuously by the adaptive feedback method.
Figure 2.Evolution of the on-axis intensity of the filaments of shaped pulses as a function of propagation distance from different generations.
In order to study the mechanism of the filament intensity change under different shaped pulses conditions, we plot the initial envelope of the shaped pulse for different generations, as shown in Figs. 5(b)–5(f). The pulse envelope is calculated based on the phase compensation of different generations and the spectrum of the initial laser pulse. Here, we assume the initial laser pulse is an ideal Fourier-transform-limited pulse. The spectral intensity and phase of the initial laser pulse, which are measured by using a second-harmonic-generation frequency-resolved optical gating (SHG-FROG, Grenouille 8-20-USB, Swamp Optics), are shown in Fig. 5(a). For the first generation, as shown in Fig. 5(b), the pulse has a disordered distribution with several sub-pulses and a large extension up to . With the increase of the generation [Figs. 5(c)–5(e)], the peak intensity increases, and the intensity of the marginal sub-pulse decreases. Correspondingly, more energy is concentrated in the central part of the pulse. With the further increase of the generation, the pulse envelope is almost the same [see Fig. 5(f)]. According to calculated initial envelopes, the propagations of the shaped pulses are simulated respectively in the following part.
Figure 5.(a) Spectral intensity and phase of the initial pulse and the temporal intensity distribution of the shaped pulses for the (b) 1st, (c) 5th, (d) 10th, (e) 15th, and (f) 30th generation, respectively.
The propagation of the shaped pulse in fused silica is described by the nonlinear Schrodinger equation coupled with the equation of electron density[25], which are written as where is the electric field envelope of the laser pulse with a central wavelength , central wave number , and frequency . is the linear refractive index of fused silica for an 800 nm pulse. is the propagation distance. The diffraction effect is described by the Laplacian operator , and the operator before the Laplacian operator represents the spatiotemporal focusing. The dispersion of the laser pulse in fused silica is described by operators , where and . The refractive index of the fused silica is given from Ref. [26]. The Kerr effect is described with the nonlinearity coefficient of . The operator before the Kerr effect represents the self-steepening effect. The electron defocusing effect is included by the fourth term, and the plasma critical density is . The multiphoton absorption is included with the ionization coefficient for the number , and the collision ionization is described with the inverse Brillouin scattering cross section . In the electron density equation, is the ionization potential, and is the electronic recombination time.
In the simulation, the shaped pulse has energy of 2 μJ and a Gaussian distribution in the transverse plane with a waist of 42 μm, and the temporal profile is obtained from the phase compensation in the experiment, as shown in Fig. 5. Then, the laser pulse is focused by a lens with a focal length of . Note that in order to save the computing time, the initial beam waist and focal length in the simulation are smaller than those in the experiment, but the numerical aperture is kept unchanged. All of the shaped pulses for the different generations have the same numerical aperture as that of the experiment to make sure the simulation results can qualitatively explain the experimental results. Meanwhile, the energy for all of the shaped pulses is also reduced to shorten the filamentation length. It will not influence the intensity modulation mechanism revealed by the simulation. The couple equations are firstly transformed into the frequency domain. The operators , , and in the real-space representation are replaced by , , and , respectively, in the frequency domain. Then, the equations are solved by the finite difference method in the frequency domain. Figure 6 shows the calculated evolution of the maximum on-axis intensity of the shaped pulses as a function of propagation distance. We can see that the intensity of the filament increases with the increase of the generation. Moreover, the filament onset becomes earlier, and the filament length becomes larger. When the generation number is larger than 15, the filament intensity is saturated, and the filamentation onset and length are nearly unchanged. We find that the evolution trend of the filament intensity obtained by numerical simulation is qualitatively consistent with that of the experiment, although many approximations are considered in the simulation.
Figure 6.Evolution of the maximum on-axis intensity of the different shaped pulses as a function of propagation distance.
To explain the mechanism of the intensity modulation of the shaped pulses, we also plot the temporal evolution of these shaped pulses and the generated electron density. For the first and fifth generations, the initial peak powers of the shaped pulses are relatively low. The initial peak intensities for the first and fifth are and , respectively, as shown in Fig. 5. Although the self-focusing effect makes the pulses, especially the central sub-pulses, more intense, the pulse split does not emerge, and the maximal intensity of the pulse is generated near the focus of the lens (). Filamentation does not occur for these conditions. For the 10th generation, the initial peak power of the shaped pulse is getting higher with , and the initial peak intensity is . The temporal evolution of the shaped pulse is complicated, as shown in Fig. 7(a). First, the intensity of the shaped pulse increases due to the self-focusing effect. The central three sub-pulses become more intense [see in Fig. 7(a)]. When the intensity continues to increase, the central two sub-pulses become intense enough to generate electrons with a density higher than [see in Fig. 7(b)]. With the combined actions of ionization loss and electron defocusing, each of the central two sub-pulses splits into two peaks, respectively [see in Fig. 7(a)]. Correspondingly, the maximum on-axis intensity decreases at , and then the second cycle starts, as shown in Fig. 6. Then, each tailing peak of the central two sub-pulses self-focuses [see in Fig. 7(a)]. With the diffuse of the tailing peaks, the filamentation terminates. The processes of defocusing, splitting, and refocusing of the sub-pulses contribute to the emergence of the second peak of the filamentation, as shown in Fig. 6. It can qualitatively explain the trailing structure after the main peak of the filamentation, as shown in Fig. 2. During the filamentation, the maximal intensity and electron density are mainly determined by the peak power of the sub-pulses. When the initial power of the shaped pulses becomes larger, for example, for generation number 15, the initial peak intensity is . In this case, the maximal intensity of the filamentation becomes larger, as shown in Figs. 4 and 6. The filamentation dynamics are sensitive to the initial peak intensity of the shaped pulse. With the increase of the initial peak intensity, the filament intensity reaches a maximum. For generation numbers 18 and 30, the shaped pulse has a close peak power initially. The initial peak intensities are and , respectively. Correspondingly, the maximal intensities of the filamentation in the two cases approach each other and are slightly larger than that for generation number 15, as shown in Figs. 4 and 6. Thus, we can draw a conclusion that the modulation of the filamentation intensity is realized by modulating the initial intensity of the shaped pulse. Furthermore, the maximal intensity and electron density depend on the self-focusing effect of the most intense sub-pulses of the shaped pulse.
Figure 7.Temporal distributions of (a) the intensity and (b) electron density of the shaped pulse at different propagation distances for the tenth generation.
In conclusion, we demonstrated the intensity control of filaments in fused silica by the shaped laser pulse in experiment and simulation. The feedback optimal control of the filamentation intensity has been achieved. The filamentation intensity can be arbitrarily modulated through the shaped pulse. Furthermore, the simulation results are in qualitative agreement with those of the experiment. By comparing the results of the experiment and simulation, we have shown that the intensity of the filament is mainly influenced by the peak power of the shaped laser pulse. The intensity control of the filament method is meaningful for the controllable change of the refractive index in the specified area of the medium. This study provides an idea for the filament applications in the tunable waveguides, optical switches, micro/nano structure fabrication, and so on. This method can also be used in the control of the intensity of plasma gratings to modulate diffraction efficiency[27] and optimize the conversion efficiency of high harmonics[28]. It could also be used to control the energy transfer between filaments[29].
The filamentation intensity can also be changed by varying the focusing conditions or the energy of the laser pulse. However, by using these methods, the variation range of the intensity is usually not so much and cannot precisely change the properties of media. The pulse shaping technique is a good choice for some filamentation applications. Furthermore, by constructing the corresponding fitness function in the GA, the onset and intensity of filamentation could be simultaneously modulated.