Yuanyuan Xu, Yawei Wang, Ying Ji, Minjie Liang, Weifeng Jin, Min Bu, Xuefu Shang, Hao Han. Fast phase retrieval method based on twice derivatives in phase-shifting interferometry with a blind phase shift[J]. Chinese Optics Letters, 2015, 13(Suppl.): S21001
Copy Citation Text
A derivative method for phase retrieval in two-step phase-shifting interferometry (PSI) with a blind phase shift is proposed in this Letter. By numerically calculating the first-order and second-order derivatives of two PSI images, one can directly determine the phase shift and then obtain the quantitative phase image. We illustrate the method with both a theoretical analysis and some simulations of an average-sized red blood cell in different interferometry recording modes. From the results, the validity, accuracy, as well as efficiency of this method are verified. Moreover, this method can be applied to any quantitative phase imaging, including on-axis, off-axis, and slight off-axis interferometry.
Quantitative phase imaging (QPI) can measure optical phases of samples with high sensitivity without using any exogenous agents. It has attracted much interest in terms of observing and characterizing living material, such as biological cells[1]. In QPI, retrieving the quantitative phase information is a practical key issue, because it offers some structure details to further study cellualr shape and dynamic behavior[2–4].
Since the phase can be retrieved from one or more interferograms easily, many interferometric retrieval algorithms have been proposed and widely used[5–14]. In general, they can be mainly grouped into either the temporal modulation algorithm or spatial modulation algorithm. In terms of the spatial modulation, the Fourier transform[5] and Hilbert transform[6] are two typical algorithms. If only a spatial frequency separation between the desired and undesired diffracted waves is guaranteed in these two algorithms, a phase image can be easily reconstructed from one interferogram. However, both are integral transformations, which make use of heavy computation. Recently, a spatial phase-shifting algorithm[7] and a derivate method[8] have been developed to improve the retrieval speed without those transformations. However, these two methods are only applied in off-axis interferometry.
In terms of the temporal modulation, at least three interferograms are required by shifting the phase of a reference wave, such that the measured phase can be directly extracted using the corresponding phase-shifting algorithm. In general, for phase-shifting interferometry (PSI), the phase shift value between two adjacent frames is a preset constant, but it is difficult to attain this value in practice. To solve this problem, some generalized algorithms with unknown phase shifts have been developed[10–14]; for example, the advanced iterative algorithm (AIA)[11], self-calibrating[12], max–min algorithm[13], and normalized difference maps[14]. These methods need three or more frames, and hence are not feasible for real-time measurement.
Sign up for Chinese Optics Letters TOC. Get the latest issue of Chinese Optics Letters delivered right to you!Sign up now
Naturally the method using fewer frames in PSI can simplify the computation and enhance the retrieval efficiency. Recently, some two-step phase retrieval algorithms with an unknown phase shift have been reported[15–23]. In Ref. [15], only two interference terms are required to perform phase extraction. However, the phase shift corresponds to two values in this algorithm, and determination of the correct phase shift is necessary. In Ref. [17], a different method is provided to determine the phase shift by searching the maximum and minimum of the interference term. In Ref. [21], a method based on a Gram–Schmidt orthonormalization algorithm is proposed to reconstruct the phase. However, in the aforementioned two-step algorithms, the elimination of the background using a high-pass filter procedure is required, which is closely related to the accuracy of phase retrieval. In Ref. [22], combining the Hilbert transform, an improved method is presented, in which the background is eliminated by the subtraction operation. However, the phase shift must be measured in advance.
In this work, considering the characteristics of phase objects, such as biological cells, from two interferograms with an unknown phase shift, we intend to search for a rapid and effective phase retrieval approach with the derivative operation. This approach can be applied to any QPI, including on-axis, off-axis, and slight off-axis interferometry. Moreover, compared to the aforementioned two-step methods, neither the elimination of the background term nor measurement of the phase shift in advance is needed in this work.
For two-step PSI, the intensities of two interferograms can be respectively described as where and represent the coordinates in the recorded plane, is a low-frequency function which describes background intensity, is the modulation amplitude, and is the measured phase associated with the sample. is the spatial frequency of fringes, which is determined by the tilt angle between the sample and reference beams. is the phase shift between two interferograms, which is presumed to be in the range of to avoid possible ambiguity. Considering the rapid processing speed of the derivative operation, in this Letter, we show that, for phase objects, not only but also can be measured directly from the transverse derivatives of the interferograms.
The first-order derivative of each interferogram with respect to can be expressed as For brevity, the coordinates and are omitted in Eqs. (3) and (4). For most transparent phase objects, such as biological cells, both the background term and the amplitude modulation factor are constants over the interferogram approximately[8,9]. Therefore, Eqs. (3) and (4) can be simplified to
From Eqs. (5) and (6), we can see that the background term does not appear in the derivatives. This indicates that the background term has been eliminated by the simple derivative operation rather than the widely used high-pass filter. When the phase shift, , is known, the phase can be directly computed with Eqs. (5) and (6), which is given by
However, in many practical cases, the phase shift cannot be controlled precisely[23] or it must be measured in advance[22]. Here, we show an alternative method for computing it based on the first-order and second-order derivative maps of the interferograms, as described in the following procedure.
The derivatives of Eqs. (5) and (6) with respect to give the second-order derivatives of the interferograms
In general, the phase, , varies slowly across the fringe pattern for the phase objects. Thus the following useful approximation should exist In fact, Ref. [24] has demonstrated the effectiveness of Eq. (10). Consequently, Eqs. (8) and (9) can be simplified as From Eqs. (5), (6), (11), and (12), the phase shift, , can be computed as Owing to the fact that the value of is limited in the range of , Eq. (13) leads to a unique value of . Now that the phase shift is determined, the phase information can be obtained from Eq. (7) easily. It is noteworthy that this approach can be applied quite generally to any interferometry by controlling the value of , including on-axis, off-axis, and slight off-axis interferometry. In the on-axis case, the tilt angle is zero, so is zero and the phase can be simply described as
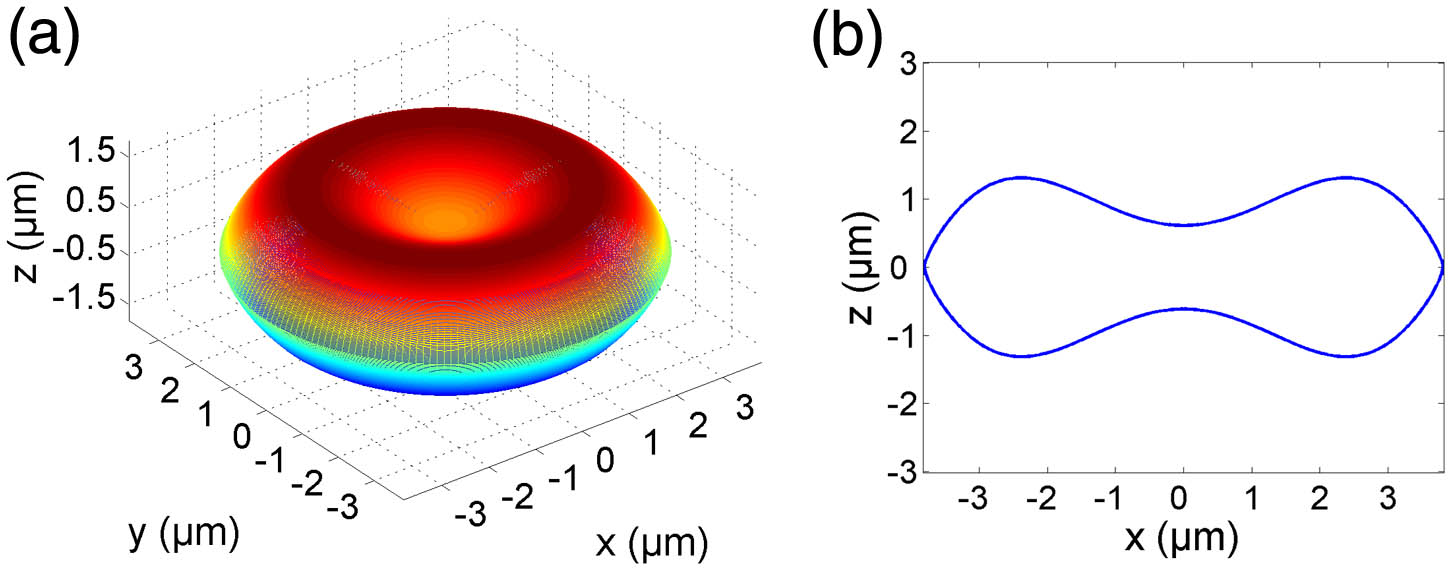
In order to verify the effectiveness of the algorithm proposed we performed a phase reconstruction of a red blood cell (RBC) by simulation. In general, a mature RBC has a unique biconcave disc shape with a diameter between 7 and 8.5 μm. In our simulation, we considered an average-sized RBC[25] which is given by This model is described by on the plane of a cylindrical coordinate system, where is the cell radius. The cell has a diameter of 7.65 μm, and a maximum and a minimum thickness of 2.84 and 1.44 μm, respectively. According to these parameters, the 3D model and the cross section of the cell can be reconstructed, which are presented in Figs. 1(a) and 1(b). Since RBCs lack a nucleus and some organelles, it can be treated as a homogeneous phase object. In the simulation, the refractive indices of the cell and the surrounding medium are set to be 1.395 and 1.335, respectively, so the relative refractive index is calculated as 1.045. These values are the same as the experimental values. In addition, the other parameters are as follows: the wavelength of the laser is 632.8 nm; both the sample and reference waves are assumed as plane waves; the spatial carrier frequency, , is 0.5336 rad/pixel; and the phase shift is preset as .
Figure 1.Average-sized RBC: (a) 3D model; (b) cross section.
In accordance with aforementioned parameters and the method, we can simulate QPI, including the phase reconstruction. Figure 2 shows the phase reconstruction procedure of the cell in off-axis interferometry. Figures 2(a) and 2(b) are two phase-shifted interferograms. Through the calculation, the first-order and second-order derivative maps of each interferogram are generated, which are presented in Figs. 2(c)–2(f), respectively. Then, we can directly calculate the phase shift from these four derivatives with Eq. (13). The calculated result is 0.7861 rad with the error of 0.0007 rad compared to the given value, showing excellent agreement. After determining the phase shift, the phase can be conveniently retrieved with Eq. (7), as shown in Figs. 2(g) and 2(h). In order to demonstrate the accuracy of this algorithm, we also calculated the thickness distribution of the cell. It can be obtained from the measured phase directly because of the uniform refractive index [shown in Fig. 2(i)]. The standard deviation of the thickness between the calculation and theoretical values is 0.0026 μm, and the absolute deviation of the maximum thickness is 0.006 μm.
Figure 2.Phase reconstruction of a RBC using derivative method in off-axis interferometry: (a) and (b) two phase-shifted interferograms; (c) and (d) first-order derivatives of (a) and (b), respectively; (e) and (f) second-order derivatives of (a) and (b), respectively; (g) and (h) 2D display and 3D display, respectively, of the reconstructed phase; (i) thickness distribution.
In order to discuss the suitable range of phase shift for this algorithm, other similar simulations have been made for different phase shift between 0 to . The phase shift values are sampled regularly with the increment of and the associated results are listed in Table 1. Both the preset values and calculated values of are listed in the first and second columns, respectively. The phase shift errors are given in the third column, and the calculated values of the maximum thickness as well as the mean deviations of the thickness are listed in the fourth and fifth columns, respectively. From Table 1, we can see that the calculated values of both and the maximum thickness agree very well with the given values; all the phase shift errors and the mean deviations of the thickness are below 0.005 rad and 0.005 μm, respectively, in a wide range of .
Preset α (rad)
Calculated α (rad)
Error α (rad)
Max Thickness (μm)
Mean Deviation (μm)
π/8
0.393
−0.0003
2.844
0.0015
2π/8
0.786
−0.0006
2.843
0.0014
3π/8
1.179
−0.0009
2.843
0.0014
4π/8
1.573
−0.0022
2.846
0.0026
5π/8
1.965
−0.0015
2.845
0.0020
6π/8
2.352
0.0042
2.851
0.0047
7π/8
2.747
0.0018
2.847
0.0031
Table 1. Phase Shift Extraction and the Calculated Thickness
Off-axis interferometry is a common recording mode in QPI. Many pertinent phase extraction methods have been reported. Here, we selected two typical methods to compare with our method in case of two-step phase-shifting. One is the Hilbert transform from Ref. [22], in which the Hilbert transform is applied to the difference between two interferograms. Another is the twice high-pass filters algorithm from Ref. [15]. In this method, only two interference terms from two filtered interferograms are applied to achieve the phase extraction. By using the aforementioned two methods to process two interferograms [Figs. 2(a) and 2(b)], the corresponding phases were obtained, as shown in Figs. 3(a) and 3(b), respectively. Figures 3(c) and 3(d) are the 3D display maps of Figs. 3(a) and 3(b), respectively. From Figs. 2(g), 3(a), and 3(b), or Figs. 2(h), 3(c), and 3(d), we cannot find any difference between them. To quantity these results, we calculated the standard deviation and the mean square error (MSE) between the measured value of each phase and the theoretical one, as shown in Table 2. It can be seen that all the standard deviations are close. In addition, the MSE value of our method and that of the twice filters algorithm are same, which are below that of the Hilbert transform. Moreover, we also compared the processing time in these three cases as present in the third column of Table 2. Our method, namely the derivative method, takes 1.8526 s, whereas the Hilbert transform and twice filters algorithm take 2.0625 and 2.512 s, respectively. Obviously, the derivative method is faster than the Hilbert transform and the twice filters algorithm.
Approaches
Standard Deviation (rad)
MSE (rad)
Processing Time (s)
Hilbert transform
0.6850
0.024
2.0625
Twice filters
0.6848
0.017
2.512
Our method
0.6847
0.017
1.8526
Table 2. Standard Deviation, MSE, and Processing Time with Different Approaches
Although the off-axis QPI has been widely and successfully used, it has a disadvantage of requiring much spatial frequency bandwidth. Slight off-axis interferometry provides the possibility for optimizing the detector bandwidth owing to the incomplete separation between the desired and undesired waves. Similar to the aforementioned off-axis QPI, we compared the capability of the aformentioned three algorithms for slight off-axis interferometry. In this work, the spatial frequency, , is 0.1067 rad/pixel. Through the numerical simulations, the phase maps using the Hilbert transform, the twice filters algorithm, and the algorithm we proposed are presented [shown in Figs. 4(a)–4(c), respectively]. It can be seen that Figs. 4(a) and 4(c) show a good agreement, which are different from Fig. 4(b). Then, these three results were compared with those of the off-axis case. From Figs. 4(a) and 3(c), or Figs. 4(c) and 2(h), no significant difference is found. However, compared with Fig. 3(d), some information is missing in Fig. 4(b). It is because the Fourier high-pass filter procedure not only eliminates the low-frequency background term but also eliminates a part of the high-frequency information.
Figure 4.Reconstructed phase maps with different algorithms in slight off-axis interferometry: (a) Hilbert transform; (b) twice filters algorithm; (c) our method.
It is worth pointing out that the method we proposed in this work is not only suitable for off-axis interferometry, but is also applicable to the on-axis case. The simulation process of the RBC phase reconstruction in an on-axis case is the same as that in an off-axis case; the only difference is that the spatial frequency, , is zero. Figure 5(a) is one of the on-axis interferograms. Figures 5(b) and 5(c) are related first-order and second-order derivatives maps, respectively. Via the calculation, the value of the phase shift is 1.5707 with a small error compared with the preset value of . Then we can reconstruct the phase using Eq. (14). The 2D display and 3D display of the measured phase are shown in Figs. 5(d) and 5(e).
Figure 5.Phase reconstruction of a RBC using derivative method in on-axis interferometry: (a) interferogram; (b) first-order derivative; (c) second-order derivative; (d) 2D display of the reconstructed phase; (e) 3D display of the reconstructed phase.
In conclusion, a simple and efficient phase extraction method with the derivative algorithm under two-step PSI is proposed. By only calculating the first-order and second-order transverse derivatives of two phase-shifted interferograms, the phase shift can be determined directly, and then the measured phase can be extracted as well. The effectiveness and accuracy of this method are proven by simulation results of the average-sized RBC in cases of off-axis, slight off-axis, and on-axis interferometry. Moreover, it is proven that the method has the ability of fast data processing.
References
[1] G. Popescu. Quantitative Phase Imaging of Cells and Tissues(2011).
Yuanyuan Xu, Yawei Wang, Ying Ji, Minjie Liang, Weifeng Jin, Min Bu, Xuefu Shang, Hao Han. Fast phase retrieval method based on twice derivatives in phase-shifting interferometry with a blind phase shift[J]. Chinese Optics Letters, 2015, 13(Suppl.): S21001