Haihong Bao, Wei Jin, Hoi Lut Ho. Tuning of group delay with stimulated Raman scattering-induced dispersion in gas-filled optical fiber[J]. Chinese Optics Letters, 2020, 18(6): 060601
Copy Citation Text
We report the first demonstration of group delay tuning with stimulated Raman scattering-induced dispersion in a hydrogen-filled hollow-core optical fiber. A pump laser induces a sharp refractive index change near the S0(0) Raman transition of hydrogen molecules, enabling the control of the group velocity of signal pulses around the Stokes wavelength. Experiments with an 80-m-long hollow-core fiber filled with 2.5 bar hydrogen achieved continuous tuning of the pulse delay up to 1.42 ns by varying the Raman amplification from 0 to 10 dB. The tunable pulse delay is realized by changing the pump power as well as the hydrogen pressure. This work provides a new technique for controlling the pulse propagation in optical fibers with high flexibility.
Dynamically controlling the delay of optical pulses is important in optical communication, signal processing, and sensing systems[1–3]. Tunable pulse delay has been demonstrated in optical fibers through nonlinear light-matter interactions near optical resonances such as electromagnetically induced transparency (EIT) in gas-filled hollow fibers[4–6], stimulated Brillouin scattering (SBS)[7–12], and stimulated Raman scattering (SRS) in solid silica fibers[13]. EIT is performed in a three-level molecular system and has resonances located at fixed wavelengths corresponding to molecular absorption lines and usually requires a low gas pressure[5]. SBS can be operated at any desired wavelength by tuning the pump wavelength, but the characteristics of SBS resonances in conventional solid optical fibers are primarily determined by the core material (i.e., doped silica) and cannot be tuned easily[14]. SRS in silica core fibers has broad Raman resonances (tens of THz), leading to a smooth dispersion change and, hence, weak modification of the pulse group velocity[13,15].
Rotational Raman resonances in hydrogen have a much narrower linewidth at atmospheric conditions (∼100 MHz)[16,17]. In the SRS process, the pump light modulates the refractive index (RI) of the optical medium near Raman resonances, which induces a dispersion change around the Stokes wavelength[18]. Though the RI change may be small, the sharp RI variation near the Raman resonance can significantly reduce the group velocity of the signal pulses around the Stokes wavelength and result in a detectable pulse delay. Such an induced dispersion can, in principle, be dynamically tuned by varying the wavelength and power level of the pump source as well as the pressure, composition, and concentration of gases, providing a highly flexible means of controlling the light dispersion. Recently, we observed the dependence of SRS-induced dispersion on the hydrogen-nitrogen mixing ratio and demonstrated the detection of trace hydrogen[19].
In this Letter, we report the first demonstration of a group delay control by exploiting SRS-induced dispersion in a hydrogen-filled hollow-core photonic crystal fiber (HC-PCF). By varying the pump power level, the signal pulse delay can be tuned continuously in a linear fashion. Tuning of the optical pulse delay on the scale of a nanosecond is realized.
Sign up for Chinese Optics Letters TOC. Get the latest issue of Chinese Optics Letters delivered right to you!Sign up now
SRS induces Raman gain near the Stokes wavelength, which is associated with the imaginary part of the Raman susceptibility of the gas medium. SRS also induces an RI change related to the real part of , which may be expressed as[18]where is the speed of light, is the peak gain coefficient that is proportional to gas concentration (), is the pump light intensity, is the linewidth-normalized frequency detuning parameter, is the Raman linewidth, and is the Raman frequency shift. Due to the narrow linewidth of Raman resonances of hydrogen, the rapid RI variation would lead to a large change in the group RI and, hence, an appreciable change in the group velocity and pulse group delay. The group delay experienced by a signal pulse near the Stokes wavelength over length is established as[8]where is the Raman gain and is the group velocity. As can be seen from Eq. (2), the group delay is proportional to the Raman gain at the Stokes wavelength () over the Raman linewidth and can be dynamically tuned by varying the pump power. The Raman linewidth of hydrogen is pressure dependent, which gives us another degree of freedom to control the signal pulse delay. Two pressure-dependent effects, i.e., molecular collisions () and fiber-wall collisions (), contribute to the Raman linewidth:
Molecular collisions contribute a Lorentz broadening line shape when the gas pressure , which, for the transition of hydrogen, may be expressed as[20]
The wall collisions dominate the linewidth contribution at lower pressures ()[21]: where is the molecular self-diffusion coefficient at room temperature, is the core radius of HC-PCF, is the gas density, which is proportional to the gas pressure, and is the mean free path of the hydrogen molecules.
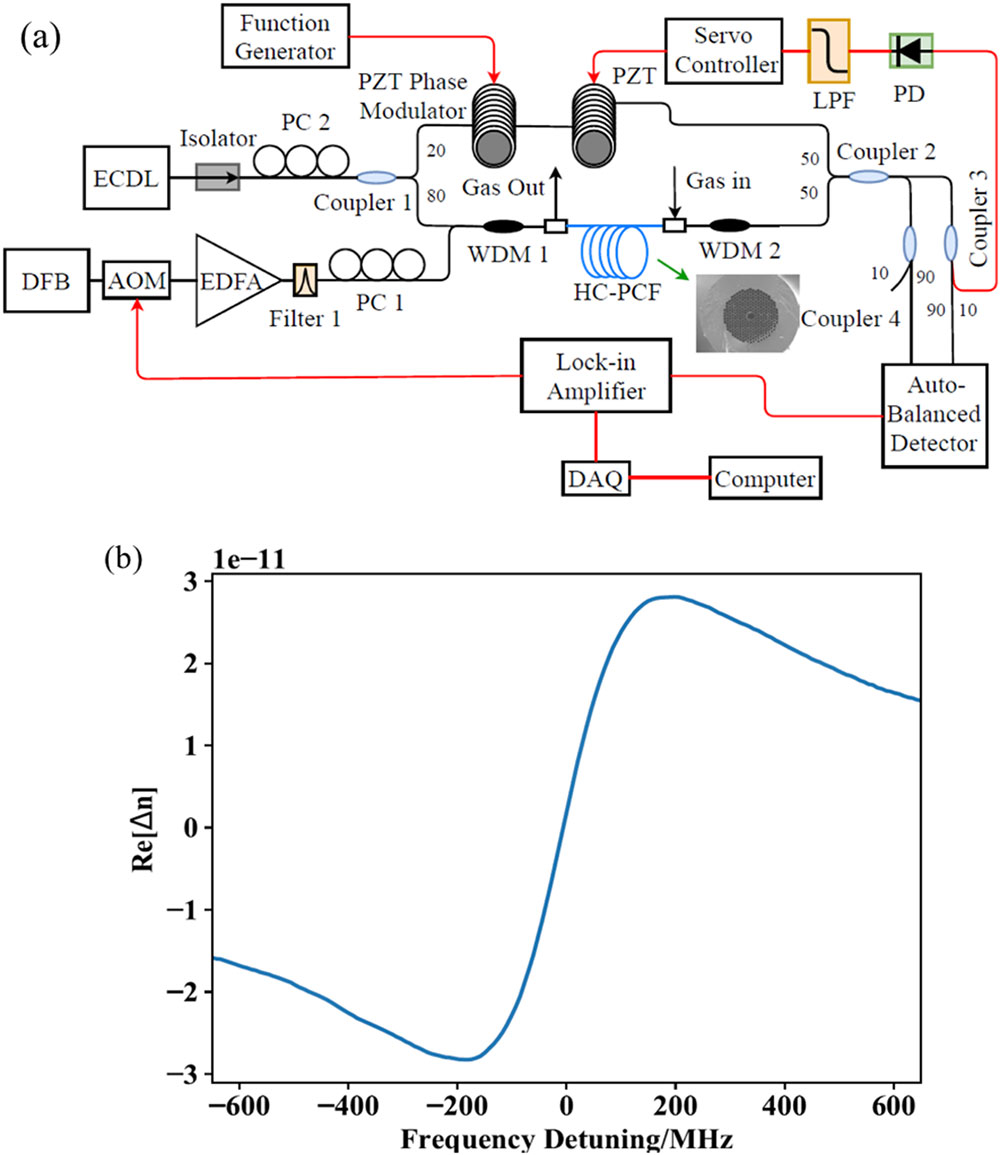
To evaluate the magnitude of the RI change and the group RI () change, we measured the laser-induced RI change around the transition () of hydrogen using an 80-m-long HC-PCF (NKT HC-1550-06) filled with pure hydrogen at the gas pressure of 4 bar. The gas filling process is the same as that in Ref. [19] The experimental system is shown in Fig. 1(a). The pump beam from a distributed feedback laser (DFB) with a wavelength around 1532.1 nm is intensity-modulated sinusoidally at 50 kHz by an acousto-optic modulator (AOM). A fiber Mach–Zehnder interferometer (MZI) powered by a signal laser beam from an external cavity diode laser (ECDL) is used for the RI measurement. The wavelength of the signal beam is fixed at the Stokes wavelength (1620.055 nm) and the SRS-induced RI change is determined by measuring the accumulated phase change of the signal light. The accumulated phase change is related to the Raman-induced RI change by:
Figure 1.(a) Experimental setup for the measurement of SRS-induced dispersion. LPF: low-pass-filter; DAQ: data acquisition; PC: polarization controller; EDFA: erbium-doped fiber amplifier. The calibration phase modulator is made by wrapping single-mode fiber (SMF) around a piezoelectric tube. Filter 1 is used to filter out the amplified spontaneous emission noise of the EDFA. WDM 1/2: 1620 nm/1530 nm wavelength-division multiplexer. WDM 1 is used to combine the pump and signal beams and WDM 2 is used to filter out the pump. Inset: scanning electron microscopy image of the HC-PCF (HC-1550-06 fiber with core diameter of ). (b) SRS-induced RI change measured with an 80-m-long HC-PCF filled with 4 bar hydrogen.
The first harmonic () of the MZI output, which is linearly proportional to the induced phase change, is lock-in detected. The detected phase change is calibrated by comparing it with a reference phase modulation produced by a piezoelectric phase modulator (PZT) when the pump is off. The calibration phase modulator is also driven sinusoidally at 50 kHz, with the driven voltage increased slowly until a phase modulation amplitude of rad is achieved. The magnitude of the lock-in detected phase change due to SRS-induced dispersion is compared with that generated from the calibration phase modulator by use of an electrical spectrum analyzer (ESA). The details about the calibration procedure can be found in Ref. [22]. The SRS-induced RI can then be recovered by using Eq. (6). The recovered RI change around the Raman transition of hydrogen is shown in Fig. 1(b). A very sharp RI change is obtained near the Raman resonance. The maximum RI change is with pump power delivered into the HC-PCF, corresponding to a group RI change of . The group RI change is nearly 7 orders of magnitude larger than the RI change, which may be used to effectively reduce the group velocity of the signal pulses around the Stokes wavelength.
To demonstrate the tuning of the group delay with the hydrogen-filled HC-PCF, a stimulated Raman system operating at the Raman transition of hydrogen is set up and shown in Fig. 2(a). The 3-ns-duration Gaussian signal pulses are generated by modulating the continuous wave (CW) output of an ECDL, and its wavelength is fixed at the Stokes wavelength of 1620.38 nm. The 150-ns-duration rectangular pump pulses are generated by modulating the CW output of a DFB laser fixed at . The pump pulses are amplified by an erbium-doped fiber amplifier (EDFA) and combined with signal pulses via WDM. Pump pulses and signal pulses are co-propagating and overlapping temporally within the hydrogen-filled HC-PCF by delayed synchronization. 4-bar pure hydrogen is pressurized into the 80-m-long HC-PCF. At the output from the HC-PCF, the pump pulses are filtered out by the second WDM and the delayed signal pulses are recorded by an oscilloscope.
Figure 2.Experimental setup and results of dynamically controlling the laser-induced pulse delay with SRS in a hydrogen-filled HC-PCF. (a) The experimental setup. IM represents the intensity modulator. (b) The observation of 1 ns signal pulse delay with the relative signal pulse power amplification of 10 dB using 4 bar hydrogen-filled, 80 m-long HC-PCF. (c) The demonstration of dynamically controlling the signal pulse delay by varying the signal power amplification with different hydrogen pressures.
The peak power level of the pump pulses is actively tuned to induce the delay of the signal pulses. Figure 2(b) shows the measured delayed signal pulses for Raman amplification () of 0 and 10 dB. The Raman amplification is defined as where and are the input and output signal power, respectively. is related to the Raman gain by
From Eqs. (2) and (8), the pulse delay is linearly proportional to . The pulse delay for 10 dB Raman amplification is , giving a relative delay factor of 0.33. The peak powers of the pump pulses and signal pulses delivered to the HC-PCF are estimated to be and , respectively. Dynamic controlling of signal pulse delay from 0 to 1 ns can be achieved by tuning the power level of the pump pulses. Figure 2(c) shows that the signal pulse delay varies linearly with the increasing Raman amplification from 0 to 10 dB. The output signal pulses have a broader duration than the input pulses. The pulse broadening factor is measured to be with , where and are the full width at half-maximum (FWHM) of the input and output signal pulses, respectively, at the Stokes wavelength. The maximum RI and group RI variation can be determined using Eqs. (1) and (2). With 10 dB Raman amplification, the group velocity reduction of the signal pulses at the Stokes wavelength is calculated to be . The changes of the RI and group RI are estimated to be and , respectively.
By changing the hydrogen pressure in HC-PCF, the normalized pulse delays are varied correspondingly. In Fig. 2(c), the slopes of the fitting lines infer normalized pulse delays of 0.142 ns/dB, 0.1 ns/dB, and 0.068 ns/dB with hydrogen pressure of 2.5, 4, and 5.5 bar, respectively. The Raman linewidth can be estimated to be 259, 368, and 540 MHz.
The Raman linewidth is also measured with the experimental setup shown in Fig. 3(a). The signal beam is from a CW ECDL laser while the pump beam is from a CW DFB laser and intensity-modulated at 100 kHz. The pump power level delivered to the HC-PCF is . The frequency difference between the pump and signal beams is tuned to match the Raman transition of hydrogen. The Raman gain profile is lock-in detected when the pump wavelength is tuned across the Raman transition. In Fig. 3(b), the measured Raman gain lines show various linewidths with 2.5, 4, and 5.5 bar hydrogen pressurized into the same 80-m-long HC-PCF. The corresponding Raman linewidth is estimated to be 230, 334, and 524 MHz, which agrees well with the result from the pulse delay measurement.
Figure 3.(a) Experimental setup for the measurement of the Raman resonance linewidth. (b) The measured Raman resonance of the 80-m-long hydrogen-filled HC-PCF. The FWHM of the Raman resonance is estimated to be 230, 334, and 524 MHz for 2.5, 4, and 5.5 bar hydrogen, respectively.
The use of SRS in gas-filled HC-PCF to control the group delay has extra benefits. Gas-filled HC-PCF has a much higher damage threshold and can handle a much higher pump power level than silica fibers[23]. It has been demonstrated that the HC-PCF can be operated with pump pulses up to peak power of 300 W for Raman amplification with hydrogen[24]. Hence, for the signal pulse of 3-ns-duration, it would be theoretically possible to achieve a 256 ns pulse delay or a relative delay factor of 85, which may be useful for a range of application in communication, signal processing, and sensing systems.
In conclusion, we studied the dynamic control of the group delay using SRS-induced dispersion in hydrogen-filled optical fibers. Small but rapid variation of Raman-induced RI leads to a significant group velocity change of signal pulses at the Stokes wavelength. We achieved a pulse delay as much as 1.42 ns with a Raman amplification of 10 dB in an 80-m-long HC-PCF filled with 2.5 bar hydrogen. The signal pulse delay can be actively tuned by adjusting the pump power level and gas pressure inside the hollow core. This technology is compatible with the existing optical fiber systems and would have the potential to be applied to optical communication systems with a wavelength complexing capacity.