Rafael Ramis, Benoit Canaud, Mauro Temporal, Warren J. Garbett, Franck Philippe. Analysis of three-dimensional effects in laser driven thin-shell capsule implosions[J]. Matter and Radiation at Extremes, 2019, 4(5): 055402
Copy Citation Text
Three-dimensional (3D) hydrodynamic numerical simulations of laser driven thin-shell gas-filled microballoons have been carried out using the computer code MULTI-3D [Ramis et al., Phys. Plasmas 21, 082710 (2014)]. The studied configuration corresponds to experiments carried at the ORION laser facility [Hopps et al., Plasma Phys. Controlled Fusion 57, 064002 (2015)]. The MULTI-3D code solves single-temperature hydrodynamics, electron heat transport, and 3D ray tracing with inverse bremsstrahlung absorption on unstructured Lagrangian grids. Special emphasis has been placed on the genuine 3D effects that are inaccessible to calculations using simplified 1D or 2D geometries. These include the consequences of (i) a finite number of laser beams (10 in the experimental campaign), (ii) intensity irregularities in the beam cross-sectional profiles, (iii) laser beam misalignments, and (iv) power imbalance between beams. The consequences of these imperfections have been quantified by post-processing the numerical results in terms of capsule nonuniformities (synthetic emission and absorption images) and implosion efficiency (convergence ratio and neutron yield). Statistical analysis of these outcomes allows determination of the laser tolerances that guarantee a given level of target performance.
I. INTRODUCTION
Direct drive inertial confinement fusion (DD-ICF)1–4 relies on the irradiation of spherical capsules by a cluster of laser beams. To achieve a high-convergence implosion appropriate for thermonuclear ignition and burn, a high level of irradiation symmetry is required.5 For this purpose, the use of a large number of beams, carefully distributed on the 4π space of directions, is imperative. Ideally, if the number of beams were infinite, the problem would become one-dimensional (1D), and high-convergence implosions could be reached with modest laser energy. However, real laser facilities have a limited number of beams, ranging from as high as several hundreds in ignition facilities6–8 to just 6–10 beams in experimental facilities.9–12 A discrete number of beams implies that the implosion is a genuine three-dimensional (3D) process. Although some aspects (e.g., energetics and linear stability) can be analyzed using simplified tools, 3D analytical and numerical models are required for a fully consistent analysis. The first approach to the 3D nature of the problem is study of the illumination symmetry, i.e., the distribution of the laser flux arriving at the target surface.13–19 Semianalytical tools (Skupsky’s axially symmetric model) have also been developed and applied.20,21 This allows estimation of the relative performances of different laser beam arrangements. Nevertheless, these studies are relevant only to the initial stages of the implosion. As time goes on and the capsule collapses, the geometry of the problem is modified. The light is no longer absorbed near the target surface; instead, it is absorbed volumetrically inside the plasma corona surrounding the capsule. As the transport of energy from the absorption region to the capsule surface smooths irradiation irregularities, the ablation pressure is not directly related to the incident intensity. Two-dimensional (2D) hydrodynamic simulations provide a first approach to these issues. They allow investigation of how asymmetries in illumination give rise to asymmetries in the hydrodynamic processes.22–24 This is particularly appropriate for quasi-axisymmetric configurations where the laser beams are organized in rings. Each ring is composed of a large number of beams whose centerlines make the same angle with the axis of the vacuum chamber. Nevertheless, this approach fails when the number of beams in each ring is small, or when beam imperfections (e.g., misalignments or power imbalance) have to be taken into account. In that case, 3D simulations are imperative.25–27 This paper focuses on the study of these 3D effects, i.e., those not accessible to 1D and 2D simulations. Although the analysis could be extended to similar configurations, a specific experimental configuration—an exploding pusher implosion—has been taken as reference. “Exploding pusher” experiments,28 although having a configuration (small glass balloons filled with deuterium gas) inappropriate for energy production, have been used since the 1970s to assess some important dynamical aspects of DD-ICF.
The experimental parameters and the numerical model are discussed in Secs. II and III, respectively. Section IV is devoted to the analysis of 1D features: sensitivity of compression ratio and neutron yield to changes in laser energy and modeling parameters. Section V is devoted to 2D features: axisymmetric implosions and their sensitivity to the polar direct driver parameter δPDD (defined in Sec. II). In Sec. VI—the core of this paper—the 3D analysis is carried out. The consequences of several types of laser imperfections are considered: accidental disconnection of one of the laser beams, intensity irregularities in beam cross-sectional profiles, alignment errors, and power imbalance between beams. From raw numerical data, miscellaneous post-processed results are obtained and discussed. These include integrated scalar quantities (neutron yield and emitted power) and miscellaneous synthetic images (emission and absorption). The corresponding statistical analysis allows determination of the laser tolerances compatible with a given goal (neutron yield, convergence ratio, etc.).
II. EXPERIMENTS AT THE ORION LASER FACILITY
In this paper, we consider the configuration used in some of the experiments carried out at the ORION laser facility.9,29,30 The target is a spherical SiO2 shell with a radius of 250 µm and a thickness of 2.7 µm, filled with D2 gas at 10.3 bars.
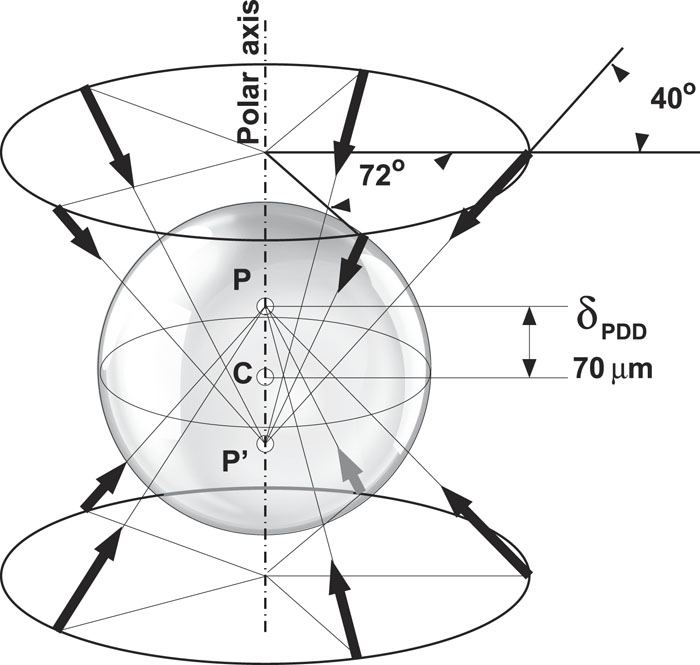
This capsule is irradiated by 10 laser beams, arranged as indicated in Fig. 1. The beams, with an angle of incidence of 40° with respect to the equatorial plane, are distributed around the polar axis in two rings, with five beams in each ring. Two consecutive beams of the same ring are separated by 72° in azimuth. Static illumination calculations show that when the beam centerlines are pointing to the target center, polar regions are over-illuminated, to the detriment of equatorial regions.14 This has been corroborated by the hydrodynamics simulations discussed in Sec. V A. To improve the irradiation uniformity, the polar direct drive (PDD) technique31 has been applied, with the beam centerlines being moved to intersect the polar axis at a distance δPDD from the target center (below/above the equatorial plane for beams coming from above/below the equatorial plane). Each beam has a nominal energy of 300 J, delivered in 700 ps, with a trapezoidal pulse shape with a constant plateau preceded by a linear rise of 200 ps and ending with a linear drop of 150 ps. The laser wavelength is 351 nm, and the nominal full width at half maximum (FWHM) beam diameter is Δ = 500 µm. In most of our simulations (except those in Sec. VI B), we assume a super-Gaussian intensity profilewhere I(r) is the intensity at a distance r from the beam centerline. However, the laser random phase plates were originally designed to produce an elliptical uniform focal spot smaller than the diameter of the present target. To accommodate the beam diameter to the current target diameter, a 2 mm defocusing was introduced. This defocusing gives rise to nonuniformities in the beam intensity, the consequences of which are analyzed in Sec. VI B.
Figure 1.Scheme of irradiation layout. To improve irradiation uniformity, beam centerlines aim at points P and P′, over the polar axis, but separated by a distance δPDD from the capsule center C.
The above configuration has been simulated numerically in one, two, and three dimensions. For 1D calculations, an adapted version of the Lagrangian hydrodynamic code MULTI-IFE32 has been used. It includes separate ion and electron temperatures, tabulated equations of state, 3D laser light ray tracing, thermal diffusion, multigroup radiation transport, deuterium–deuterium burning, and 3He particle diffusion. Multidimensional 2D and 3D simulations have been carried out using the code MULTI-3D.25,33 This code utilizes a physical model simpler than that available in MULTI-IFE. Only the essential physics is included in 3D, namely, hydrodynamics, tabulated equations of state with a common temperature for ions and electrons, laser ray tracing with bremsstrahlung absorption, and flux-limited electronic heat conduction. In plasma–laser interaction at intensities ≃1015 W cm−2, the heat flux is constrained to be below a fraction f of the free-streaming flux. The value of f can be determined by comparing numerical results with experiments.34 In Ref. 35, it was found that approximately 0.03 < f < 0.10. Here, we take an intermediate value f = 0.06, which we retain throughout all simulations in this work (except for those in Sec. IV, carried out specifically to check the influence of f on implosion parameters). This value is also consistent with Fokker–Planck kinetic simulations for laser intensities below 1015 W cm−2 and pulse duration less than 1 ns.36 None of radiation transport, nonlinear laser–plasma interaction, magnetic field, nonlocal thermal flux, or burning physics are presently available in the 3D code. Consequently, the results presented here are less accurate than those of 1D and 2D codes with more detailed physical packages. However, the relative influence of geometric parameters, in particular those related to three-dimensionality, can be analyzed consistently by MULTI-3D.
Ideally, for the nominal configuration described above (i.e., a spherically symmetric target irradiated with perfectly aligned and balanced beams without irregularities), the symmetries of the problem allow the computational domain to be reduced to one half of a 72° spherical wedge (strictly, a 36° half-wedge would be enough). Boundary conditions are imposed on the equatorial plane and on the meridional planes with azimuth φ = 0 and φ = 72°. These planes are treated as slipping surfaces for hydrodynamics and as reflecting mirrors for light propagation. Only one laser beam (azimuth φ = 36°) is directly incident in the computational domain.
MULTI-3D uses a conservative Lagrangian hydrodynamic algorithm for unstructured grids. Figure 2 shows a block of the 3D numerical grid. The external surface is discretized by up to 1024 triangular surface elements. The thin glass shell is modeled by 27 layers of piled prismatic cells with triangular bases. The internal gas region is discretized by a grid composed of four contorted tetrahedral sub-blocks, each of which is subdivided into tetrahedral and octahedral cells, all of a similar size. This arrangement, in contrast to a uniform discretization in spherical coordinates, does not exhibit singularities either at the polar axis or at the origin. The computational time step, limited by the Courant–Friedrichs–Lewy (CFL) condition,37 is thus not restricted by such singularities. Thermodynamic variables are either directly defined at cells (e.g., density) or computed at cells from values defined at nodes (e.g., temperature). The hydrodynamic algorithm used by MULTI-3D38 computes the force acting on an interface from the difference of pressures in the two adjacent cells. This force is distributed to the vertices, where the acceleration is computed. Each prismatic or octahedral cell is subdivided into several tetrahedra, all sharing the same thermodynamic variables, but having pressures inversely proportional to their individual volumes. (To preserve spherical symmetry, each prismatic cell in the glass shell is subdivided into six tetrahedra, overlapping in space.) This arrangement guarantees that the volumes of cells are always positive. Before the volume of a tetrahedron can become negative, it first needs to become close to zero. When this is about to happen, the huge pressure pushes apart the nodes, thereby preventing collapse. In total, a block has up to 21 284 nodes and 35 872 cells (subdivided into 220 416 tetrahedra). For arbitrary irradiation, 10 basic blocks are joined together to cover the full 4π solid angle. The number of integration steps (≃50 000) and the CPU time (≃36 000 s) depend on the number of blocks, grid resolution, and irradiation symmetry.
Figure 2.Basic block of the numerical grid used in 3D simulations. The gas region is covered by four contorted tetrahedral sub-blocks TB1, TB2, TB3, and TB4. The glass shell is modeled as a layered arrangement of prismatic cells LB. With nominal irradiation, only one block is required. In that case, reflective boundary conditions are applied on the planes of symmetry. For arbitrary irradiation, 10 blocks are pasted together to build a full sphere.
To study the effects of small nonuniformities in the irradiation, it is necessary that the numerical algorithm preserve the symmetry of the problem. That is, calculated implosions should be spherically symmetric if the pressure distribution is spherically symmetric. Otherwise, one cannot distinguish between numerical and physical distortions. Let us denote by the ideal node accelerations in a spherically symmetric configuration. are radial and with identical modulus at all nodes belonging to the same layer. Conversely, the accelerations delivered by the numerical algorithm for the same configuration are close to , but they are neither perfectly aligned in the radial direction nor completely uniform in each layer. This numerical artifact would break the spherical symmetry. Although the induced distortions are initially small, they will be amplified by Rayleigh–Taylor hydrodynamic instability. To get rid of this effect, the following correction is applied to the numerical acceleration supplied by the numerical algorithm in an arbitrary (symmetric or asymmetric) configuration:This expression produces symmetric accelerations (i.e., ) when the distribution of pressures is spherically symmetric (i.e., when ). As , the tensorial quantity is close to the unit tensor. For a layered grid, like that shown in Fig. 2, takes the same value for all nodes on the same radial direction, and it has to be evaluated only once, at the beginning of the simulation, as a function of the angular arrangement of grid elements.
As the laser wavelength (351 nm) is smaller than the target size (500 µm), laser coupling can be treated using the optical approximation. Laser deposition is evaluated by integrating a large number Nr of individual ray trajectories, distributed in space and in time. This discretization induces numerical noise in the distribution of laser power density. If Nθ is the number of grid divisions in a 90° angle, then the number of surface elements scales as , and the power fluctuations scale as the inverse of the square root of the number of rays per unit of surface, . These irregularities in laser absorption induce distortions in the shell, which will be amplified during the implosion owing to Rayleigh–Taylor instability. For grid sizes larger than the cut-off wavelength (below which the instability does not occur) the maximum numerical growth rate γmax occurs for perturbations whose wavelength λmax is four to five times the grid size. The growth rate of a Rayleigh–Taylor mode is basically proportional to the square root of the product of acceleration times wavenumber, so . The expected final size of perturbations would be (at a fixed time)where C1 and C2 are problem-dependent constants. For a given δr, the number of rays depends strongly on grid resolution: . The exponential dependence on Nθ limits in practice the spatial resolution of our simulations. For the present problem, it has been found numerically that C1 ≃ 2.2 µm and C2 ≃ 0.7 (for time 700 ps). For Nθ = 36 (the highest resolution used here) and δr ≃ 2 µm, the number of rays is Nr ≃ 8 × 10⁶. That means that, despite the fact that the ray tracing algorithm has been parallelized, most of the CPU resources are consumed by this part of the code. To alleviate this situation, several optimization techniques have been developed: (i) The starting point of each trajectory is selected inside the beam cross-section based on quasi-random sequences (see Ref. 39, Sec. 7.7, p. 309). Quasi-random sequences are advantageous in comparison with pseudo-random sequences, allowing, in this application, the reduction of Nr by a factor of four. (ii) The rays in the wings of the laser profile are numerous, but they carry only a small fraction of the beam power. To avoid superfluous calculations, the rays whose power is below 10% of the maximum are selected randomly, with a probability proportional to the carried power. (iii) In the early phases of irradiation, the numerical noise in absorption is directly transformed into noise in ablation pressure. Conversely, in later stages, when a plasma corona has been generated, heat transport from absorption regions to the ablation surface helps to smooth out nonuniformities. On the other hand, irregularities generated in the initial phases have more time to be amplified by hydrodynamic instabilities than those generated at later phases. For these two reasons, relatively more rays are required at the beginning of irradiation. The distribution of rays between several (two or four) time intervals has been optimized to minimize the numerical noise. In most of the calculations presented here, one half of the ray trajectories have been assigned to the 0–100 ps interval, and the rest to the 100–700 ps interval.
The quantities delivered directly by the code [3D time-dependent density , temperature , etc.] have been post-processed to obtain derived magnitudes (e.g., neutron yield and X-ray emission) and to generate synthetic images. At high temperature, several deuterium–deuterium nuclear reactions can occur:The cross-sections of the first two reactions are similar and several orders of magnitude larger than that of the third. The number of neutrons generated per unit volume by the first reaction iswhere nD is the ion number density. The reactivity , dependent on ion temperature Ti, has been taken from Ref. 40. As MULTI-3D uses a single-temperature model, Ti has been set equal to the average plasma temperature T. On the other hand, the power of thermal radiation emitted per unit volume iswhere σ is the Stefan–Boltzmann constant, and λP is the Planck mean free path for radiation. In this work, only the emission from the SiO2 shell has been taken into account. λP has been computed by the SNOP code.41 Neglecting reabsorption of emitted particles, 2D synthetic images can be generated by integrating or along a given direction, either at a specific moment or integrated over time. Analogously, images obtained by integrating turn out to be qualitatively similar to absorption shadowgraphs.
IV. ONE-DIMENSIONAL ANALYSIS
To analyze the target sensitivity to several physical and numerical parameters, 1D simulations (i.e., assuming perfect spherical symmetry) are carried out. The results are summarized in Table I. The total laser energy is taken as a free parameter in the range from 0.75 kJ (one fourth of the nominal value) to 12 kJ (four times the nominal value). The first five cases in Table I are computed taking into account radiation transport and the last five cases without radiation transport. The same flux limit factor (f = 0.06) is used in all the cases of this table. As the laser energy increases, larger ablation pressures give rise to faster implosions with shorter stagnation times timp. Larger kinetic energies induce higher compression ratios Rimp (the cube root of the initial gas volume divided by its final volume) and higher peak ion temperatures (max Ti). The maximum compression is limited by the fact that for large laser energies, a large fraction of the glass shell is ablated. The mass depletion of the imploding shell reduces the implosion kinetic energy available for compression. This effect is particularly obvious in the cases without radiation. Thermonuclear cross-sections are very sensitive to ion temperature, so a modest increment of ion temperature leads to an exponential growth of the number of neutrons (“Yield”). The fraction of absorbed light (“Abs.”) decreases with laser power, owing to (i) the smaller size of the collapsing target and (ii) the reduction of plasma collisionality and bremsstrahlung absorption at high temperature. A fraction (“Rad.”) (from 18% to 26%) of the absorbed energy is emitted as thermal radiation (approximately one half during the implosion and the other half during stagnation). Radiation transport is not currently implemented in the 3D version of the MULTI code. To quantify the consequences of this simplification, several 1D simulations without radiation transport have been carried out (lower half of Table I). The overall hydrodynamic behavior is not greatly modified, but, without radiation losses, implosions are stronger. This, together with the absence of radiative cooling in the hot spot, gives rise to higher peak ion temperatures and higher neutron yields.
Input (kJ)
Abs. (%)
Rad. (%)
timp (ps)
Rimp
max Ti (keV)
Yield 109
0.75
72
18
1500
5.6
3.3
0.06
1.5
68
25
1220
7.5
4.6
1.16
3
62
26
951
10.2
5.6
25
6
53
23
736
11.8
9.4
314
12
44
19
594
11.9
15.5
1279
0.75
74
…
1500
8.9
3.5
3.9
1.5
71
…
1046
10.0
6.1
66
3
64
…
774
10.2
9.7
331
6
56
…
610
8.6
14.8
522
12
46
…
494
6.7
19.2
606
Table 1. Summary of 1D simulation results: sensitivity to laser energy with (upper half) and without (lower half) radiation transport. Values in boldface are the results of the reference calculation.
The influence of the thermal flux limit factor f is illustrated by the results shown in Table II. For low values of f, the inhibition of heat transport from the plasma corona to the ablation layer induces higher corona temperatures. The subsequent drop in plasma collisionality reduces the absorption of laser light. The combined effect is a reduction of the shell kinetic energy and degradation of the implosion: larger stagnation times, lower convergence ratios, lower ion temperatures, and lower neutron yields. From Table II one can conclude that for the considered target, the neutron yield is very sensitive to f. For example, for the commonly accepted values of f (from 0.03 to 0.1), the variations reach one order of magnitude. In such circumstances, hydrodynamic calculations are only qualitative concerning the neutron yield. However, the relative influence of different parameters can be analyzed through numerical simulations where f is always set to the same fixed value.
f
Abs. (%)
Rad. (%)
timp (ps)
Rimp
max Ti (keV)
Yield 109
0.01
26
7
1552
6.3
3.3
1.1
0.02
37
13
1282
7.1
4.1
2.2
0.03
46
19
1147
8.2
5.0
4.9
0.04
53
22
1059
9.2
5.1
9.9
0.05
58
24
999
9.9
5.5
17
0.06
62
26
951
10.2
5.6
25
0.08
66
27
905
10.4
6.1
39
0.10
68
28
877
10.4
6.3
48
0.20
72
30
818
10.4
6.9
66
0.30
73
30
806
10.3
7.1
71
0.60
74
31
785
10.2
7.2
76
1.00
74
31
781
10.2
7.3
77
∞
75
31
774
10.1
7.2
80
Table 2. Summary of 1D simulation results: influence of flux limit factor f. Values in boldface are the results of the reference calculation.
For the nominal irradiation, with perfectly aligned and balanced beams, the implosion is almost axisymmetric. As reported in Ref. 25, the azimuthal nonuniformities can be one order of magnitude smaller than the polar ones, even with only four or five beams per ring. This occurs in the shock-ignition configuration proposed for LMJ,42 as well as in the configuration considered here. This circumstance allows us to discuss the essential features of the nominal implosion in terms of a 2D geometry. Nevertheless, as there are still some 3D aspects, the simulations of this section have been carried out using full 3D settings.
Figure 3 shows the evolution of the gas–glass interface as a function of time. This graphical representation is particularly useful to qualitatively understand the events that occur during the implosion. Initially, the gas–glass interface is spherical, but as time goes on, the sphericity is lost and the P4 asymmetry becomes clearly discernible. Meridional regions (with polar angle θ ≃ 45°) implode faster than polar (θ ≃ 90°) and equatorial (θ ≃ 0°) regions. At time 600 ps, the difference in radius is 27 µm, corresponding to a 24.3% excess of average velocity in the meridional regions. On the other hand, the dependence on azimuthal angle φ is considerably weaker. At the equator, the radius at φ = 36° (i.e., at one of the planes containing the incident beams) is 5 µm smaller than that at φ = 0°. For θ ≃ 45°, the situation is just the opposite: the radius at φ = 36° is 5 µm bigger than the radius at φ = 0. This is due to the fact that the region between two beams of the same cone (θ ≃ 45° and φ ≃ 0°) receives energy from both beams and consequently implodes faster than the region located directly under one of the beams (θ ≃ 45° and φ ≃ 36°). As time goes on, the spherical shell becomes first a bicone, at a time around 650 ps, and later, at stagnation, takes the shape of a “peg-top” toy. After stagnation, the radial velocity changes sign, first at the places with highest implosion velocity (i.e., at θ ≃ ±45° and φ = 0°, ±72°, ±144°), giving rise to a set of 10 jet-like structures (visible in Fig. 3 for t ≳ 800 ps). Up to that moment, the problem was practically axisymmetric and could be understood considering the events that occur over one of the meridional planes.
Figure 3.Time evolution of the reference target: the gas–glass interface at different times. The zoomed inset shows the evolution near the stagnation time. The implosion is essentially axisymmetric during the first 760 ps, after which the fivefold rotational symmetry induced by the irradiation scheme becomes obvious.
Figure 4 shows the temperature distribution over the plane OXZ (φ = 0°) throughout stagnation and rebound. At time 640 ps, the biconical shell is seen, in this representation, as a dark diagonal line. At this moment, the shock wave has not yet arrived at the center. The dark quarter circle corresponds to the unperturbed gas. As time goes on, the glass shell bends inward. At time 680 ps, the shock wave arrives at the center and rebounds. Afterwards, the shock reflects several times at the internal face of the shell and at the center of the target. This process gives rise to the formation of a “hot spot” region, with temperatures above 5 keV. Material from the internal face of the glass shell, in direct contact with this region, is ablated and incorporated into the hot gas. At time 760 ps, this process drills 10 symmetric holes at the places where the glass shell is in closer contact with the hot spot (i.e., θ ≃ ±45° and φ = 0°, ±72°, ±144°). The hot gas escapes through these holes and creates the arrangement of jets shown in Fig. 3. At later times, the plasma cools, and each mass element diverges from the center with an asymptotically constant velocity.
Figure 4.Temperature distribution on the meridional plane OXZ during the final stages of collapse and at the beginning of expansion. All frames have been drawn using the same space and temperature scales.
Self-emission synthetic images from the 3D simulation of the nominal target are shown in the upper row of Fig. 5. This sequence can be compared, frame by frame, with the sequence shown in Fig. 3. During the implosion, most of the self-emission occurs in the dense plasma near the ablation surface, so the shape of the target is clearly recognizable for t ≲ 750 ps. At stagnation (t = 800 ± 50 ps), radiation comes from the shell material around the gas core, and accounts for about one half of the total emitted energy. Finally, during expansion, emission gradually decreases, and the shape becomes irregular. The 10-jet feature in Fig. 3 is not visible in the self-emission representation.
Figure 5.Implosion sequence in terms of self-emission synthetic images. The upper row corresponds to the nominal irradiation and the lower row to irradiation with one of the beams completely switched out. All frames have been drawn with the same spacial scale, but in order to optimize the definition of small details, the color scale is different in each frame.
Figure 6 shows the time evolutions of the incident and absorbed laser power, the average density of deuterium, the radiation pulse, and the neutron pulse (the last two magnitudes being obtained by post-processing the output of the 3D simulation). The neutron peak occurs at time 800 ps, when the density of deuterium is maximum, and has a FWHM of around 50 ps.
Figure 6.Some time-dependent magnitudes from the 3D simulation of the nominal target configuration (perfectly smooth, aligned, balanced, and synchronized laser beams).
The nominal value of the parameter δPDD, discussed in Sec. II and represented in Fig. 1, was 70 µm. The present simulations allow assessment of the adequacy of this value. Figure 7 and Table III show the results obtained with different values of δPDD. Without PDD (i.e., with δPDD = 0), the asymmetry mode P2 is dominant, and the compressed gas acquires a disk-like shape at stagnation. With reversed PDD (i.e., with negative δPDD), this feature is even stronger. On the other hand, with excessive PDD (i.e., with δPDD = 140 µm) the final shape is elongated along the polar axis. Looking at Table III, it must be noted that the efficiency of laser absorption is almost insensitive to small displacements of the beam centerlines (δPDD is a small quantity in comparison with the radius of the target, 250 µm). On the other hand, both the average density reached by the deuterium gas and the neutron yield depend on the degree of symmetry reached at stagnation. The optimum is obtained for the nominal value of δPDD. Although the geometry of the hot spot changes dramatically with δPDD, the changes in neutron yield are relatively small. Basically, one can assume that the total amount of energy transferred to the hot spot is very similar in the four cases. Consequently, densities, temperatures, and confinement times are also similar. As long there is no material mixing at a molecular level, the thermonuclear yields, obtained by integrating Eq. (3.4) in space and time, are similar. This situation is in contrast with the ignition of ICF capsules, where the hot spot includes only a fraction of the fuel, so any geometric distortion or contact between the hot spot and the surrounding material cools the hot spot and precludes ignition.
Figure 7.Evolution of the gas–glass interface for different values of the PDD parameter. Each row corresponds to a different simulation. The indicated times are relative to the stagnation time of each case.
Although some important aspects of implosions have been analyzed through 1D (e.g., laser absorption) or 2D simulations (e.g., δPDD optimization), the study of the effects caused by irradiation irregularities requires the full 3D settings. In this section, we analyze the consequences of unavoidable beam imperfections, namely, irregular beam profiles, alignment errors, and power imbalance between beams. In real experiments, all these imperfections occur simultaneously, but in order to evaluate their relative importance, we consider them separately one by one. In general, owing to the lack of symmetry, a numerical grid formed by joining 10 blocks like the one shown in Fig. 2 is needed.
A. Missing beam
As an illustrative example, we consider the situation where for some reason (e.g., a hardware failure) one of the beams is lost, while the remaining beams work normally. (A similar configuration was discussed in Ref. 26. There, assuming that one of the beams was known a priori to be unavailable, repointing of the remaining beams was investigated.) The results are represented in the lower row of Fig. 5 as a sequence of synthetic emission images. Initially, the part of the target surface located below the missing beam is only marginally irradiated by the wings of the neighboring beams. The absorbed intensity is only 26% of the value under an active beam. This strong reduction gives rise to lower ablation pressure and lower implosion velocity. At time 500 ps (when the average radius is 68% of its initial value), the implosion velocity in that region is only 50% of the nominal value. The local delay in the motion of the shell produces a bubble-shaped distortion, elongated in the direction of the missing beam and clearly visible in Fig. 5 for t ≳ 600–700 ps. It is noteworthy that, despite the strong distortion, the thermonuclear yield is reduced only by a factor of four, from 5.58 × 10¹⁰ neutrons with 10 balanced beams to 1.29 × 10¹⁰ neutrons in the absence of one of the beams.
B. Irregularities in the laser cross-sectional profile
The actual laser cross-sectional profile departs considerably from the symmetric super-Gaussian profile described by Eq. (2.1). The phase plates used in the experimental campaign were optimized to produce an elliptical focal spot smaller than the present target size. To accommodate the spot size to the actual target size, defocusing was introduced. This gives rise to irregular beam profiles like that shown in Fig. 8. A series of simulations were carried out using the same irregular profile in each beam, but rotated through random angles around the beam centerlines. The results in terms of stagnation time and neutron yield are quite insensitive (≲1%) to the actual angles. Figure 8 shows the results of one of these simulations during the final phases of the implosion. The inhomogeneities in irradiation induce the inhomogeneities in ablation pressure, implosion velocity, and shell shape. Larger distortions are manifest when the realistic profile is used. As in the previous case, the neutron yield is not greatly modified: from 5.58 × 10¹⁰ with super-Gaussian beams to 4.36 × 10¹⁰ with irregular beams. Stagnation occurs 50 ps earlier with irregular irradiation. The larger implosion velocity is a consequence of a better laser–plasma coupling. This suggests that the 500 µm FWHM diameter, used to idealize the beam profile as a super-Gaussian one, is slightly overestimated. A set of simulations with circular beams of different diameters were carried out. In terms of stagnation time and core shape, the best fit to the realistic results was obtained with a diameter of 430 µm.
Figure 8.Consequences of intensity irregularities in the cross-sectional profile of the laser beam. The upper row corresponds to a super-Gaussian symmetric profile. The lower row has been obtained with a realistic intensity distribution. Size scales are different at different times, but equal for each pair of frames with the same value of time. The semitransparent (light green) surface is the 1 g cm−3 isochore. The dark surface (blue) is the gas–glass interface.
To analyze the consequences of alignment errors, we carry out simulations where the beam cross-section and the power profile maintain their nominal values, but where each beam centerline (i = 1, …, 10) is aimed at a point separated from the nominal one (P or P′ in Fig. 1). The three components of the vector are chosen as uncorrelated random values with Gaussian distribution and standard deviation σr. We consider several values of σr (0, 25, 50, and 100 µm). For each value, we perform a set of simulations (≃4) with different random seeds. The symmetry of the implosion degrades as σr increases. This is clearly visible in Fig. 9, where synthetic images of the compressed core have been generated for each simulated case. Figure 9(a) shows the instantaneous line-integrated density [i.e., ] at the moment of stagnation. This representation is analogous to time-resolved shadowgraphy of the compressed core. For σr = 0 (perfect alignment) the core is symmetric with respect to the horizontal and vertical axes. For small alignment errors, σr = 25 and 50 µm, the shape of the compressed core is a distorted version of the unperturbed one, with a dense equatorial feature and spikes along the polar axis. However, for large errors, σr = 100 µm, the final configuration can no longer be identified with the unperturbed one. Bubble-like structures appear along the directions with poor irradiation. Wrinkles near the target center are also visible.
Figure 9.Synthetic images from 3D simulations with different levels of alignment accuracy. The frames in each row correspond to four different simulations with the same level of accuracy but different random seeds. For each simulation, two images have been synthesized: (a) and (b). The same orientation and the same scale have been used for all frames, but in order to improve the visibility of small details, the pseudo-color scales are independent.
These features change from case to case, so the consequences of alignment errors in terms of core compression and neutron yield can only be analyzed statistically. Figure 9(b) shows, for the same cases as represented in Fig. 9(a) and at the same scale and orientation, the time-integrated X-ray emission. This representation is analogous to an X-ray image produced by a pinhole camera. Although the emission has been integrated in time, most of the radiation is emitted during stagnation. Comparing one by one the frames on both sides of Fig. 9, one can easily identify common features. However, bright emission spots (white and red, in pseudo-color scale) are distributed irregularly. Their location, shape, and intensity depend on the details of the implosions, which in turn depend on the random seeds used in each simulation. The radiating areas occur at isolated places in the core and do not represent its actual size. For this reason, analysis of the emission images by themselves gives no direct information about the peak compression attained in the gas core, and can even be misleading. This is illustrated in Fig. 10, where, for each simulation reported in this subsection and in Sec. VI D, the average radius of the gas filling, Rg (obtained directly from the 3D simulation), and the radius of the bright spot, (computed from the synthetic emission image), are plotted vs the neutron yield Y (post-processed from the 3D simulation). Although the points are scattered, there is an evident correlation between Rg and Y (more compression, more neutrons). Conversely, the values of Re do not show any correlation with either Y or Rg. The quantitative influence of the alignment error σr on the neutron yield Y is shown in Fig. 11. The circles and the vertical bars represent the mean value and the standard deviation for each group of cases with the same value of σr. As expected, the average yield decreases when the irradiation irregularity increases. From this figure, one can determine the degree of symmetry required to achieve a given yield. For example, if one wants to generate ≥36 × 109 neutrons (two thirds of the nominal value) in 50% of the shots, the alignment precision should be better than 38 µm (8% of the capsule diameter).
Figure 10.Radius of the core as a function of the neutron yield for all cases simulated in Secs. VI C and VI D. Black diamonds show the average radius of the D gas at stagnation. Empty squares show the radius inferred from the synthetic emission images in Figs. 9(b) and 12(b).
Figure 11.Sensitivity to beam alignment: neutron yield Y vs alignment error σr. Each black diamond corresponds to a different simulation. For each set of simulations done for the same value of σr, the mean value and the standard deviation are represented by a circle and a vertical bar, respectively. The dashed curve joining the mean values can be used to estimate the beam alignment accuracy required to achieve a given performance.
D. Sensitivity to power balance between beam lines
Although the hardware is the same in all beam lines, several factors can give rise to slight differences in energy and power. Considerable effort is currently being devoted to reduce these differences to acceptable levels.43 Here, as in the alignment studies, we assume random deviations of beam energies, but now with the beams perfectly aligned and synchronized. The energy of beam i is set towhere E0 = 300 J is the nominal energy, and δai are uncorrelated random numbers with Gaussian distribution and standard deviation σe. Additionally, we impose Ei ≥ 0. That is, for large values of σe, some beams can be completely switched off. As in Sec. VI C, we consider several values of σe (0%, 10%, 20%, 40%, and 60%), and for each value, we perform a set of simulations (≃4) with different random seeds. The results are displayed in Figs. 12 and 13. The consequences of beam energy errors are qualitatively similar to those of alignment errors. Both the symmetry of the implosion and the yield degrade as σe increases. Comparing Figs. 11 and 13, one can determine the relative importance of the two sorts of beam imperfections and thereby assess which components of the laser system are more critical and require improvement.
Figure 12.Synthetic images from 3D simulations with different levels of inter-beam power imbalance. The frames in each row correspond to four different simulations with the same level of accuracy but different random seeds. For each simulation, two images have been synthesized: (a) and (b). The same orientation and the same scale have been used for all frames, but in order to improve the visibility of small details, the pseudo-color scales are independent.
Figure 13.Sensitivity to beam energy balance. Neutron yield Y vs energy error σe. Each black diamond corresponds to a different simulation. For each set of simulations done for the same value of σe, the mean value and the standard deviation are represented by a circle and a vertical bar, respectively.
The implosion of thin-shell capsules has been studied numerically using the MULTI-3D computer code. A specific experiment carried out at the ORION laser facility has been taken as reference (500 µm glass shells filled with D2 gas at 10.3 bars, irradiated by a 3 kJ, 700 ps, 351 nm laser system). 1D simulations show that the neutron yield, the main figure of merit considered in this work, is very sensitive to the physical (beam energy) and numerical (flux limiter and radiative cooling) parameters. The absolute yield cannot be predicted directly from the simulations. However, its sensitivity to geometric aspects can be analyzed by means of simulations where all the other physical and numerical parameters take fixed values. Although the number of beams used in the experiment is small (10 beams arranged in two cones with 5 beams in each), 3D simulations show that, as long as alignment errors and inter-beam energy balance errors are absent, this problem is very close to an axisymmetric one. The simulations also confirm that the value of the polar direct drive parameter actually used in the experimental campaign gives the best results in terms of implosion symmetry and neutron yield. Full 3D hydrodynamic simulations allow the study of effects that are inaccessible to 2D simulations: (i) the influence of realistic cross-sectional laser profiles instead of idealized ones, (ii) the consequences of errors in laser alignment, and (iii) the consequences of errors in the energy balance between beams. The results have been interpreted in terms of scalar parameters (convergence ratio and neutron yield) and through synthetic images: line-integrated density (similar to absorption shadowgraphs) and self-emission (similar to pinhole camera images). Both types of images clearly reflect the asymmetry of the implosion. However, they do not give direct information about the compression reached by the core. In particular, no correlation has been found between the average radius of the compressed core and the apparent radius of the bright spots in self-emission images. On the other hand, the statistical analysis allows quantification of the laser requirements (alignment and beam balance) to achieve a desired implosion performance (e.g., neutron yield). This sort of information will be very useful for the design of future experiments and for the improvement of laser systems.
Rafael Ramis, Benoit Canaud, Mauro Temporal, Warren J. Garbett, Franck Philippe. Analysis of three-dimensional effects in laser driven thin-shell capsule implosions[J]. Matter and Radiation at Extremes, 2019, 4(5): 055402