H. L. Saadon. Effect of Fe concentration on the nonlinear refraction and reverse saturable absorption in ferroelectric X-cut LiNbO3 crystal[J]. Chinese Optics Letters, 2015, 13(7): 071901
Copy Citation Text
In this Letter, the effects of the iron (Fe) dopant concentration on the nonlinear optical properties of iron-doped ferroelectric X-cut crystals plates are studied by using the Z-scan technique with a cw laser at the wavelength of 532 nm. The amount of iron in the compound is varied from 0 to 0.15 mol%. Measurements of nonlinear refractive index and the nonlinear absorption coefficient are determined. The sign of the nonlinear refractive index is found to be negative and the magnitude is on the order of . This nonlinear effect increases as the concentration increases from 0 to 0.15 mol%. A good linear relationship is obtained between nonlinear refractive index, nonlinear absorption coefficient, and concentration.
Interest in the development of laser technology, nonlinear optical materials with different nonlinear absorption processes like saturable absorption (SA), reverse saturable absorption (RSA), and two-photon absorption (TPA), has attracted significant attention of researchers in view of nonlinear optical device applications. Studies on different optical materials revealed that many materials exhibits more than one nonlinear absorption process simultaneously depending on the wavelength or intensity of the laser beam, doping concentration of the active material, and so on[1–6]. Li et al.[7] reported the observation of RSA in the pure Z-cut crystal with picosecond laser. Wang et al.[8] found the optical nonlinearity in the thin film on the picosecond scale is much larger than that of the pure [7]. Kostritskii et al.[9] found a transition from SA to RSA with the intensity increase in reduced crystal at cw illumination with the red (644 nm) and green (514.5 nm) laser beams. Recently there also has been an increasing interest in the third-order nonlinear susceptibility and the photorefractive effect crystals[10–13] because the propagation of a strong laser beam in optical nonlinear material is closely related to the nonlinear refraction and absorption[7,14] and the nonlinear refraction caused by the photorefractive effect in an crystal is very large.
Among the experimental methods used for the investigation of nonlinear optical properties of materials, the most comfortable and simplest is Z-scan technique, which allows the determination of both the value and sign of nonlinear refractive index [15].
Using cw Z-scan experiments absorption and nonlinear refraction of the samples under investigation can be determined. It is very important to study the dependence of the optical nonlinearity on the concentration.
Sign up for Chinese Optics Letters TOC. Get the latest issue of Chinese Optics Letters delivered right to you!Sign up now
This Letter reports the Z-scan studies of pure and Fe-doped ferroelectric X-cut crystals at different doping concentrations. The nonlinear refractive index and nonlinear absorption were measured with cw laser beam at 532 nm. The optical limiting behavior has been studied.
The experimental setup for cw Z-scan is reported in Refs. [16,17]. Experiments are performed using a cw (YAG) laser operating at 532 nm. A lens was used with the focal length of . The laser beam waist at the focus was measured to be 16 μm and the Rayleigh length was found at 1.51 mm to satisfy the basic criteria of the Z-scan experiment. All samples are X-cut 1 mm-thick plates with surfaces polished at an optical grade. Thus, the sample thickness is less than the Rayleigh length for the system. The sample was mounted on a computer-controlled translation stage that moved the sample in the vicinity of the lens focus starting from a position ahead of focus () and moving toward a position behind the focus (). The scanning range was about 40 mm in all cases. All measurements were carried out at room temperature for both closed-aperture and open-aperture Z-scan experimental setup.
The experiments are performed for four samples of crystals plates, three of them doped with iron (Fe). The crystals were prepared by the Czochralski technique. The specimens were doped by iron at various molar concentrations; 0.0, 0.05, 0.1, and 0.15 mol%.
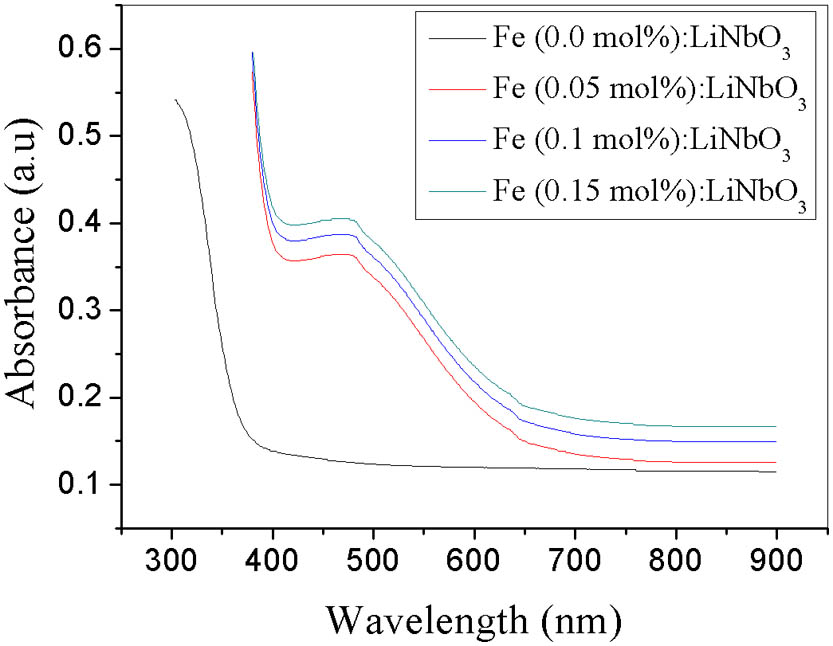
The UV–visible absorption spectrum of X-cut Fe ferroelectric doped crystals is described in Fig. 1. The optical absorption peak is approximately equal to 470 nm. One may choose the excitation wavelength of 532 nm for the nonlinear optical measurements. In comparison, in Ref. [18], Fe-doped showed no clear resonance absorption peak. One possible explanation is that the Fe impurities were incorporated as aggregates into the host. It shows that the absorption edge of Fe-doped successively shift to the violet band in comparison with that of pure . It is well-known that the position of absorption edge in crystal is decided by the forbidden band gap with p state as valence band and d state as conduction band. In Fe-doped crystals when Fe ions enter into lattice of crystal, they substitute Li ions and locate in Li sites[19]. This will decrease energy gap since the polarization ability of Fe ions is greater than that of the Li ions, so the absorption edge shifted to the red band gap in comparison with that of pure . This shift in the optical absorption is consistent with behaviors reported in Refs. [18,20,21]. This red shift in optical absorption edge can be attributed to the overall band structure of is changing due to Fe-doping[22].
Figure 1.Optical absorption spectra of ferroelectric X-cut crystals at different concentrations of Fe.
For the study of nonlinear optical properties, samples are put in a position that nonlinear regime is achieved. Figure 2 shows the curves for the closed-aperture Z-scan which are obtained at various concentrations of Fe doped with a fixed peak intensity of . It can be seen from the transmittance curve that the signal profile with a peak followed by a valley indicates a negative (self-defocusing) optical nonlinearity. The normalized transmittance for the closed-aperture Z-scan can be written as[15–17]where is the peak intensity at focus, is the wavevector with being the laser wavelength, is the effective length with being the linear absorption coefficient and being the thickness of the sample, and is the linear transmittance of the aperture given by where is the radius of the aperture and is the radius of the laser spot before the aperture.
Figure 2.Closed-aperture Z-scan measurements of the ferroelectric X-cut crystals at doping Fe concentration for (a) 0.0, (b) 0.05, (c) 0.1, and (d) 0.15 mol% Fe. Solid line, theoretical fit.
The origin of nonlinear refraction can be electronic or thermal in nature[17]. Under cw laser it is expected that the major contribution to the observed optical nonlinearities to the thermal in nature. The energy from the focused laser beam is transferred to sample through linear absorption and is manifested in terms of heating the medium leading to a temperature gradient and, in turn, to the refractive index change across the sample which then acts as a lens. For the Fe-doped crystal, the closed-aperture Z-scan shows a peak–valley distance of . This peak–valley distance is more than 1.7 times the Rayleigh length , which is indicated by thermal nonlinearity.
The open-aperture Z-scan measurements are plotted in Fig. 3. The results in Fig. 3 are obtained at different concentrations of Fe-doped . The open-aperture curves exhibit a normalized valley, indicating the presence of RSA in the samples. The normalized transmittance for the open-aperture Z-scan can be given by[15–17]where is the nonlinear absorption coefficient.
Figure 3.Open-aperture Z-scan measurements of the ferroelectric X-cut crystals at different doping Fe concentrations. Solid line, theoretical fit.
Nonlinear absorption in ferroelectric X-cut crystals plates could be due to RSA. RSA is known as positive type of absorption induced by free-carrier absorption (FCA), TPA, or with the combination of the processes[23]. The origin of TPA requires at least twice incident laser energy less than the direct band gap energy [1]. Therefore, the role of TPA in the nonlinear optical effect is not within the range , where and . In the present case, the major nonlinear response is due to the RSA.
The measured values of nonlinear refractive index and nonlinear absorption coefficient of ferroelectric X-cut Fe-doped crystals plates have been determined by means of Eqs. (1) and (2), respectively. The results obtained by such method are listed in Table 1. A peak–valley characteristic of closed experiments is negative and thermal defocusing is the most important mechanism of nonlinearity in these experiments. The sign of the nonlinear refractive index of a material is thus immediately clear from the sample of graph. The sensitivity to nonlinear refraction is entirely due to aperture, and absence of aperture completely eliminates the effect[15]. The values of and are comparable to the already reported in Ref. [24] for the pure crystals. These results are much larger than the previously reported in Ref. [9] at 514.5 nm and pure films at 532 nm[8]. But these results are smaller than that reported previously by A. K. Kole et al.[25] at pulse laser wavelength of 1064 nm for MgO-doped crystal.
Sample
n2(cm2/W)
β (cm/kW)
Fe (0.0 mol%): LiNbO3
−3.12×10⁻⁸
2.36
Fe (0.05 mol%): LiNbO3
−4.75×10⁻⁸
3.73
Fe (0.1 mol%): LiNbO3
−6.11×10⁻⁸
5.15
Fe (0.15 mol%): LiNbO3
−7.84×10⁻⁸
7.05
Table 1. Nonlinear Refractive Index n2 and Nonlinear Absorption Coefficient β at Different Fe Concentrations in Ferroelectric X-Cut LiNbO3 Crystals
The effect of doped Fe concentration on nonlinear refractive and nonlinear absorption is shown in Fig. 4. The nonlinear refractive index and the nonlinear absorption coefficient increase linearly with the increase of Fe-doping concentration in crystals, indicating that the contribution to nonlinear coefficients arises due to the presence of the Fe. This may be attributed to the fact that as the number of particles increases when the concentration increases, more particles get thermally agitated resulting in an enhanced effect.
Figure 4.Nonlinear refractive index and nonlinear absorption coefficient as a function of Fe concentration for ferroelectric X-cut crystals.
In conclusion, the nonlinear refractive index and nonlinear absorption coefficient of ferroelectric X-cut pure and Fe-doped crystals plates at different Fe concentrations (0.0, 0.05, 0.1, and 0.15 mol%) are successfully measured by the cw Z-scan technique. The sign and magnitude of nonlinear refractive index are evaluated, and it is found to be on the order of . The X-cut undoped and Fe-doped crystals exhibit self-defocusing nonlinear behavior. RSA phenomena is the major nonlinear mechanism observed for the crystals. The crystal samples with different Fe concentrations can be of prime importance to define such parameters needed for the use of these materials in devices and applications.
References
[1] R. L. Sutherland. Handbook of Nonlinear Optics(2003).
H. L. Saadon. Effect of Fe concentration on the nonlinear refraction and reverse saturable absorption in ferroelectric X-cut LiNbO3 crystal[J]. Chinese Optics Letters, 2015, 13(7): 071901