Abstract
Quasi-single-photon sources are attracting a lot of interest in many fields at present; however, the knowledge is very poor about their performance. In this Letter, by using the standard Hanbury-Brown-Twiss measurement method, we investigate in detail the characteristics of the photons from an attenuated continuous single-mode red laser. For the first time to our knowledge we obtain the coincidence counting spectrum of a commercial single-photon source, which demonstrates that an appropriately attenuated continuous laser can be utilized as a quasi-single-photon source for general applications.A single-photon source has been widely used in quantum information science[1], especially in quantum-key-distribution systems[2]. Up to now, many schemes have been proposed to generate single photons, such as emission from individual molecules[3], nitrogen vacancy centers[4], or quantum dots[5]. However, due to low emission rates, rapid saturation, and rigorous experimental condition all of them are only performing in the laboratory. For most commercial products quasi-single-photon sources are generally used, which are obtained by fine attenuation of a highly stable laser[6]. For example, by attenuating a pulsed single-mode laser to make the average photon number close to 0.1 one can get a practical quasi-single-photon source[6,7]. However, by directly attenuating a continuous laser, the single photons will be generated randomly, which has not been reported yet. In this Letter, based on the Hanbury-Brown-Twiss (HBT) coincidence counting measurement method[7,8], a commercial quasi-single-photon source has been investigated in detail and the coincidence counting spectrum has been obtained for the first time to our knowledge.
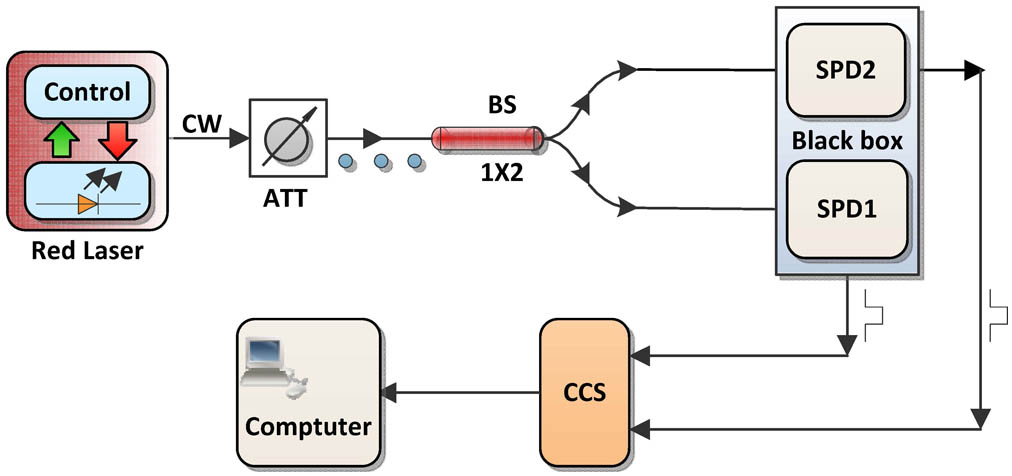
The experimental setup is schematically shown in Fig. 1, where two single-photon detectors (SPDs) are utilized to perform the photon counting, and the coincidence counting system (CCS) further analyzes the coincidence counting, which indicates the two-order degree of photon correlation[9].

Figure 1.Experimental setup.
A commercial compact laser system coupled with a modular single-mode fiber delivery system produces continuous-wave (CW) coherent light with . Due to its internal active temperature control, the laser is mode-hop free and wavelength stabilized. Furthermore, a closed loop control provides long term power stability. The variable optical attenuator (VOA) follows behind the laser and produces continuously variable attenuation. By finely attenuating the laser, the quasi-single-photon train can be generated, which goes forward through a 50/50 beam splitter (BS) and detected by SPD1 and SPD2, respectively. These two SPDs are integrated in a black box to avoid ambient light and have almost the same performance parameters with dark counts per second (cps). The SPD is composed of a photoelectric converter, a preamplifier, and a discriminator, as shown in Fig. 2; therefore it can generate a corresponding pulse upon the arrival of each photon. The pulses from the SPDs are finally processed by the CCS with coincidence counting spectrum analysis software.
Sign up for Chinese Optics Letters TOC. Get the latest issue of Chinese Optics Letters delivered right to you!Sign up now
Figure 2.Principle and internal configuration of the SPD.
First, to directly observe and evaluate the quasi-single-photons, a high-speed oscilloscope (OSC) has been employed to measure the output pulses from two SPDs. The results are partly shown in Fig. 3, where we can find that the pulse trains are totally different and distribute discretely, which means the photons go into the two SPDs nearly one by one, and it also indicates that the attenuation is strong enough.
Figure 3.Pulses output simultaneously from the two SPDs. a1: SPD1, a2: SPD2, b1 and b2 are the details of the waveforms in a1 and a2, respectively.
Subsequently, the pulses are processed by the CCS and the computer, where a standard spectrum analysis software (MAESTRO-32) is employed to analyze the data, and the coincidence counting spectra are finally achieved. Figures 4 and 5 illustrate some of the typical results.
Figure 4.Envelope diagram of counts (logarithm) vs. delayed time under different total count rates (a–d: 1.5 Mcps, 150 kcps, 15 kcps, and 1.5 kcps).
Figure 5.Coincidence counting spectra with details (inside) under different total count rates (a–d: 1.5 Mcps, 150 kcps, 15 kcps, and 1.5 kcps).
There is a little difference between Figs. 4 and 5; that is, the counts are shown in their logarithms in Fig. 4, while in Fig. 5 they are displayed linearly. Carefully compare the left sides of Figs. 4(a)–4(d), we can find that coincidence counts at 51 ns (fixed delay between start and stop pulses) are gradually reducing to zero as the total count rates become smaller, which means that the multiphotons are almost zero at lower count rate (15 kcps or less); in other words, nearly all of the weak optical pulses are composed of only one photon.
Moreover, there are some interesting aspects shown in Figs. 4 and 5. At higher total count rates [Figs. 4(a), 5(a) and 4(b), 5(b)] the spectrum curves are exponential, which is the typical loss feature of a classical coherent light. However, at lower total count rates [Figs. 4(c), 5(c) and 4(d), 5(d)] the spectrum curves become flatter and the coincidence counts are reduced greatly, while a spectrum peak appears conspicuously at the right side (). We have known that the laser is attenuated to single photon stream at a count rate less than 15 kcps, so the peak at 2000 ns tells us that most of the time intervals between two adjacent single photons are around 1949 ns (2000 ns minus 51 ns), which implies that the randomness of the single photons will be weaker at much lower total count rates. According to our experimental results, by attenuation of a continuous laser to get a quasi-single-photon source, the suitable total count rate is between 15 and 150 kcps in this case.
In conclusion, based on the standard HBT measurement method with two separate SPDs, we investigate the commercial quasi-single-photon source in detail and present the performance of the photon source from an attenuated continuous single-mode red laser. For the first time, according to our knowledge, the coincidence counting spectrum has been obtained for a commercial quasi-single-photon source. Compared with other single-photon sources, our scheme is relatively more convenient to be carried out, especially at room temperature, and the randomness of the generated single photons is much better than others, while our single-photon source has great stability due to a high-quality continuous laser. Thus, it will be widely used in practical quantum communications.
References
[1] D. Bouwmeester, A. K. Ekert, A. Zeilinger. The Physics of Quantum Information(2000).
[2] N. Gisin, G. Ribordy, W. Tittel, H. Zbinden. Rev. Mod. Phys., 74, 145(2002).
[3] T. H. Lee, P. Kumar, A. Mehta, K. Xu, R. M. Dickson, M. D. Barnes. Appl. Phys. Lett., 85, 100(2004).
[4] C. Kurtsiefer, S. Mayer, P. Zarda, H. Weinfurter. Phys. Rev. Lett., 85, 290(2000).
[5] P. Michler, A. Kiraz, C. Becher, W. V. Schoenfeld, P. M. Petroff, L. Zhang, E. Hu, A. Imamoglu. Science, 290, 2282(2000).
[6] A. R. Dixon, Z. L. Yuan, J. F. Dynes, A. W. Sharpe, A. J. Shields. Opt. Express, 16, 18790(2008).
[7] X. Wang. Phys. Rev. Lett., 94, 230503(2005).
[8] M. Giovannini. Phys. Rev. D, 83, 023515(2011).
[9] H. J. Kimble, M. Dagenais, L. Mandel. Phys. Rev. Lett., 39, 691(1977).