
Yuanfeng Di, Zhong Zuo, Daowang Peng, Daping Luo, Chenglin Gu, Wenxue Li. Dual-comb spectroscopy from the ultraviolet to mid-infrared region based on high-order harmonic generation[J]. Photonics Research, 2023, 11(7): 1373
- Photonics Research
- Vol. 11, Issue 7, 1373 (2023)
Abstract
1. INTRODUCTION
Optical frequency combs (OFCs) have contributed to a great number of spectroscopic applications with their frequency accuracy and long-term stability. Dual-comb spectroscopy (DCS), as an emerging tool, has been demonstrated as a powerful spectral measurement technique for material characterization and precision metrology with high frequency resolution, fast measurement speed, and extensive spectral coverage [1,2]. Utilizing a broadband coherent dual-comb source can enable high-resolution and high-sensitivity measurement of simultaneous detection of multiple absorption bands, intermediate monitoring in complex chemical dynamic systems, and many other regions of interest. For their extensive detection capability, OFCs with wide spectral coverage from the ultraviolet (UV) to the mid-infrared (MIR) region are quite desirable for DCS applications. In particular, in the MIR of molecular fingerprinting, most molecules exhibit strong fundamental vibrational transitions with a quantity of intense absorption lines. Broadband DCS can detect trace molecules in parallel with ultrahigh sensitivity up to parts-per-billion (ppb) concentration [3–5]. In the near-infrared region, with the commercially advanced high-power erbium-doped (ytterbium-doped) fiber laser and Ti:sapphire laser, DCS has contributed to various nonlinear spectroscopies with advanced optical componentry and mature photonics technology. It has been adopted to resolve the hyperfine structure of rubidium (Rb) atoms with tri-comb spectroscopy (TCS) [6,7], laser-induced breakdown spectroscopy (LIBS) [8], and Doppler-free two-photon spectroscopy [9,10]. Combined with pump-probe spectroscopy, DCS could provide a new dimensional conception of high temporal resolution on the femtosecond time scale and high spectral resolution on the megahertz frequency scale. In the visible region, as a complement to the infrared region, DCS could also be a powerful tool for interpreting the atomic and molecular transitions with their overtone bands. Using a frequency-doubled fiber laser in the green region, it can be used to depict the dense rovibronic spectrum of iodine () [11] and the time-resolved plasma evolution of iron (Fe) [12]. By monitoring the probing atomic, ionic and biomolecular intermediates, it can help to decipher the reaction mechanism of the complex catalytic processes to improve the chemical design for energy efficiency [13,14]. In the ultraviolet region, DCS may not be as dominant as it is in the infrared region, but it still holds its reign with its high-resolution benchmark [15]. For example, atmospheric trace gas detection has been reported in the ultraviolet region with DCS, where there are the large absorption cross sections of air pollutants like nitrous oxide and many other highly active astrophysical molecules [16–18]. In addition, OFCs’ advanced capabilities in the ultraviolet region help perform high-resolution spectroscopy, precise measurements, and direct frequency comb spectroscopy [19–21]. As a result, obtaining a broadband coherent comb source with a simple and robust architecture is critical.
Substantial effort has been devoted to the generation of broadband coherent optical frequency combs. With the commercially advanced fiber laser in the near-infrared region, nonlinear frequency conversion serves as the common way to shift the near-infrared spectra to other spectral regions to achieve broader spectral coverage. Mid-infrared wavelengths are typically attained by frequency downconversion processes of difference frequency generation (DFG) and optical parametric oscillators (OPOs) [22–24]. Ultraviolet and visible regions are reached through multi-step frequency upconversion processes such as sum frequency generation (SFG) and second-harmonic generation (SHG) [25,26]. At present, OFCs in each spectral region develop independently. It is a challenging task to fulfill frequency conversion at both mid-infrared and UV regions simultaneously, especially for simultaneously preserving the coherence. Generally speaking, it is necessary to introduce supercontinuum generation to fill the gaps in the broadband spectrum. The complicated supercontinuum generation extends the spectral coverage at the great additional cost of constraining the deterioration of the coherence property [27,28]. Recently, leveraged by the advancement of the periodically poled lithium niobate waveguide (WG-PPLN), the excellent spatial confinement enhances many high-order nonlinear processes and significantly improves the frequency conversion efficiency. Diddams
In this paper, we report a coherent dual-comb spectroscopy over the UV to MIR region with a simple and robust configuration. Driven by the mid-infrared pump pulses, up to the ninth-order harmonic (395 nm) was directly generated in an aperiodically poled lithium niobate (APPLN) waveguide through high-order harmonic generation (HHG). Combined with the pumping wavelength tuning, the output spectra can cover a great range in the infrared region and can be tuned almost continuously in the visible region. In order to investigate the coherence at each generated spectral region, DCS was performed from the fundamental to the eighth-order harmonic. The measured dual-comb spectra with the distinctive tooth-resolved structure demonstrated that quadratic nonlinearity in HHG would not significantly deteriorate the phase noise. In all the generated spectral regions from the UV to the MIR, coherence is well preserved in complex cascaded quadratic nonlinear processes, which is beneficial for long-term averaging to achieve a higher signal-to-noise ratio and measurement sensitivity. Absorption spectroscopy of methane at multiple spectral regions of different harmonics was performed to characterize the spectroscopic capability of our system, exploring multiple fundamental vibrational bands and its overtone of methane molecules.
Sign up for Photonics Research TOC. Get the latest issue of Photonics Research delivered right to you!Sign up now
2. EXPERIMENTAL SETUP AND RESULTS
The experimental setup is illustrated in Fig. 1(a). The mid-infrared OFCs based on the optical-optical modulation technique served as the pump sources for the HHG process, which has been introduced in our previous works [4,5]. The two mid-infrared sources, seeded by a tunable CW quantum cascaded laser (Daylight, operated at 3.73 μm, tunable from 3.71 to 3.9 μm) in optical-optical modulated optical parametric amplification (OPA), delivered 3 nJ mid-infrared pulse trains at a repetition rate of . The pump pulse duration is [33,34]. The difference between these two combs was set to 150 Hz. As depicted in Fig. 1(b), the 25-mm-long waveguides (CTL Photonics) were made of aperiodically poled lithium niobate on a lithium tantalate substrate, with a facet cross section of (coated with AR across 1.2–5.5 μm). The poling periods were designed and set to be linearly decreasing from 32 to 23 μm with guidance from the simulation analysis. For the two branches, the mid-infrared light was coupled into the waveguide using AR-coated molded aspheric lenses (, Thorlabs C028TME-E) as illustrated in Fig. 1(c). The polarization direction of the MIR pump pulse is adjusted by using a half-wave plate. We added two AR-coated germanium wedges before the waveguide to optimize the dispersion of the pump pulses. The output light from the waveguide was collimated using an aluminum-coated off-axis parabolic mirror. The two outputs were combined by a beam splitter (BS) and interfered on a photodetector, generating a radio frequency (RF) comb composed of distinguishable heterodyne beats between pairs of comb teeth. Therefore, the optical coherence property between two OFCs can be revealed in the generated RF comb through heterodyne detection. Then, the combined lights passed through a gas cell to verify the capability of spectral measurement of our system. For different spectral measurement ranges, gas cells with different path lengths were used. After dispersed by a prism, a partial harmonic spectrum over the UV to near-infrared region is shown in Fig. 1(d). In the following paragraphs, the harmonics of different orders are abbreviated as H1–H9. The gas cell is filled with methane at a pressure of 50 mbar. In the MIR with a larger absorption cross section, an 8-cm-long gas cell was used to record the strong absorption lines of the fundamental methane vibrational frequencies. In the visible and near-infrared regions, due to the comparatively lower absorption cross section, a multi-pass gas cell (Aerodyne, AMAC-76LW) was used to obtain longer effective path.
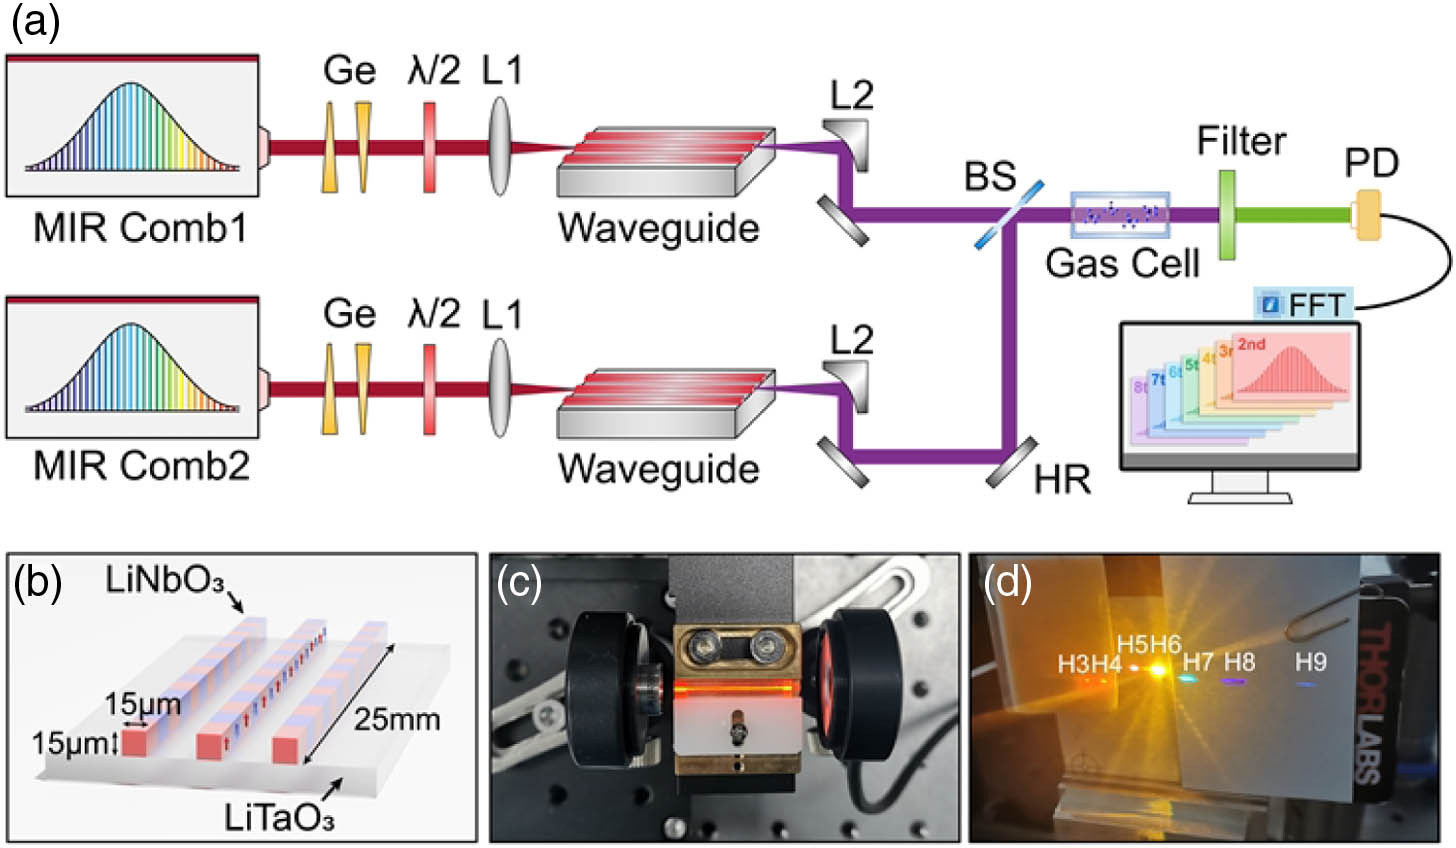
Figure 1.(a) Experimental setup of the coherent dual-comb system. The MIR comb delivered a 3-nJ mid-infrared pulse train at a repetition rate of 108.4 MHz. Then the mid-infrared pulses were focused into the APPLN waveguide, generating multiple OFCs output covering from the mid-infrared to ultraviolet region. Ge, AR-coated germanium wedges.
Up to ninth-order harmonics were observed with 230 mW incident MIR pump power. The highest ninth-order harmonic at 395 nm is near the transparency limit wavelength of lithium niobate crystal. The pump pulse centered at 3550 nm, and its full width at half-maximum (FWHM) is 155 nm. The measured output power and conversion efficiency are shown in Table 1, and the corresponding spectra are plotted in Fig. 2(a). For each harmonic, the output power was measured after certain bandpass filters with the subtraction of the respective noise floor. The coupling efficiency into the waveguide was estimated to be 60%. The total conversion efficiency is calculated to be 26.1%. Benefiting from the waveguide structure, the APPLN waveguide enhanced various quasi-phase-matching (QPM) processes with high conversion efficiency. And the conversion efficiency can be further improved with delicately designed QPM periods. Output Power of Each Generated Harmonic from the APPLN WaveguideHarmonic Wavelength Output Power Conversion Efficiency Power Meter Spectrometer H1 3570 nm 22.18 mW Thorlabs S405C Bristol 771B H2 1780 nm 19.21 mW 13.9% Thorlabs S122C Yokogawa AQ6370 H3 1190 nm 11.23 mW 8.14% H4 890 nm 4.55 mW 3.30% H5 720 nm 0.22 mW 0.16% Thorlabs S120VC Ocean Optics HR4000 H6 600 nm 0.84 mW 0.61% H7 510 nm 20.84 μW 0.015% H8 450 nm 3.77 μW 0.0027% H9 395 nm 1.68 μW 0.0012%
![]()
Figure 2.(a) Output spectra of the generated harmonics from H1 to H9. (b) Simulated evolution process in the frequency domain. (c) Simulated evolution in the time domain, revealing the harmonic generation location and the corresponding poling periods. Each harmonic is normalized, and the group velocity of the pump pulse is set to zero to center the temporal profile.
Numerical simulation was conducted based on the nonlinear envelope equation (NEE) to investigate the evolution process of the generated harmonics in the APPLN waveguide [35,36]. The simulation parameters were set to be consistent with the experimental setup. The dispersion parameters of the waveguides considering the cross-sectional geometry were calculated using finite-element simulations. The evolution processes in the frequency domain and the temporal domain were plotted in Figs. 2(b) and 2(c), respectively. In the time domain, each harmonic was normalized individually to analyze the generation dynamics in the cascaded HHG process. The group velocity of the fundamental harmonic (H1) was set to zero to center the temporal profile. The abundant poling periods fulfilled multiple QPM conditions for various three-wave mixing processes. Analyzing the generation location of every generated harmonic in Fig. 2(c), it helps to understand which three-wave mixing processes should be responsible for the generation of each harmonic. It can be seen that HHG mainly results from the second-harmonic generation (SHG) and sum frequency generation (SFG) of low-order harmonics. Downconversion from high-order harmonics to lower-order harmonics rarely exists in our QPM waveguide. The interaction dynamics of harmonics with the quadratic nonlinearity could be understood as a three-dimensional problem. For one thing, at the perfect QPM period, quasi-phase-matching processes can be fulfilled efficiently with high conversion efficiency. It can be seen that H2 is mainly generated at 6.08 mm from the front facet, which corresponds to the perfect QPM period of 29.81 μm. Besides the fundamental QPM periods, SHG and SFG processes can also be fulfilled with higher-order poling periods , where represents the poling period and is an odd integer [30]. For example, H6 is generated at the third-order QPM period of 28.57 μm, located at 9.52 mm from the front facet. For another thing, the frequency conversion processes require enough power for all the interacting harmonics. Under decreasing period of waveguide direction, the SHG period for H4 (24.56 μm) appears at 20.67 mm from the front facet, which is later than the H2 period (29.81 μm) at 6.08 mm from the front facet. The QPM period appearing sequence would evidently affect the conversion efficiency. In the experiment, the conversion efficiency for H4 is 3.30% for the period decreasing condition and 0.11% for the period increasing condition, confirming the importance of the period appearing sequence for high-efficiency conversion processes. The SHG poling period of H2 should take precedence over that of other frequency conversion processes to build up the higher-order harmonics through frequency upconversion. For the last thing, SFG processes would only occur when both participating fields temporally overlapped. Due to the absence of the perfect QPM period for H5, H7, and H9 when the interacting pulses temporally overlapped, they were merely generated with lower conversion efficiency at the point of intersection. As to the ninth-order harmonic, the generated pulses around 5 mm from the front facet are owing to the SFG of H2 and H7, and the generated pulses around 17 mm should be attributed to direct third-harmonic generation (THG) of H3 at higher-order QPM periods. The simulation results determine which quadratic nonlinear process dominates the certain frequency conversion process and provide helpful guidance towards experimental configuration.
To investigate the coherence characteristic of each generated harmonic, DCS was performed for H1 to H8. The output power of the ninth-order harmonic (H9) was too low to obtain an agreeable interferogram signal. Multiple bandpass filters were used to filter the certain order harmonic. Three photodetectors, including a mid-infrared photodetector (VIGO, MIP-10-250M-V91), an InGaAs photodetector (Thorlabs, PDA10CF-EC), and a Si avalanche photodetector (Thorlabs, APD430A2/M), were used to acquire the heterodyne signals of H1, H2–H4, and H5–H8, respectively. The signals were recorded digitally by a data acquisition card (Alazar Tech, ATS9350). We used the adaptive sampling method as the external clock to resample the signal to remove the fluctuation of the repetition rate offset [4,37].
![]()
Figure 3.Dual comb spectra from H1 to H8. (a) The first column shows the dual-comb spectra retrieved from the measured interferogram, which is coherently averaged 150,000 times. (b) The second column represents the Fourier transformation result of continuous data stream of time length 1 s with 1000 times of coherent averaging. (c), (d) The third and fourth columns are the zoomed-in plots of (b).
Molecular absorption spectroscopy of methane () was performed to verify the spectral measurement capability of our system. Methane has four independent vibrational frequencies, two of which have been identified as strong bands at 3.3 μm ( band) and 7.7 μm ( band) [40,41]. The optically active vibrational bands would induce absorption at the fundamental, overtone, and combination bands. For our dual-comb system, methane absorption phenomena were observed at 3550, 1750, 1185, and 900 nm individually, most of which should be attributed to the P-branch of the band and its overtone (, , ). For the MIR with a large absorption cross section, an 8-cm-long gas cell was used for H1. For the near-infrared and visible regions, using a multi-pass gas cell, the effective absorption light path length was adjusted to be 1, 8, and 8 m for H2, H3, and H4, respectively. Figures 4(a), 4(b), 4(g), and 4(h) show the absorption spectra retrieved from the measured interferograms coherently averaged 75,000 times. Multiple absorption lines can be clearly identified at four harmonic spectral regions. The absorption lines extracted from the background spectra are plotted in Figs. 4(c), 4(d), 4(i), and 4(j) as gray solid lines. The theoretical results calculated from the HITRAN database are plotted in Figs. 4(c), 4(d), 4(i), and 4(j) as red solid lines for comparison, which agree well with the experimental observations. Other than a few absorption lines around 1800 nm originating from water in the atmosphere, the majority should be attributed to the P-branch of the methane band and its overtone. Figures 4(e), 4(f), 4(k), and 4(l) depict the magnified view of part of the absorption spectra. It is one of the attractive features of our light sources to detect multiple ro-vibrational bands at separate spectral locations. In the MIR of 3550 nm, the linewidth of measured absorption lines is approximately 680 MHz, which is much larger than the Doppler-limited linewidth of 260 MHz due to the collision broadening contribution. In the visible region of 900 nm, the measured linewidth is approximately 1060 MHz, which is close to the Doppler-limited linewidth of 1040 MHz. These results demonstrate the potential of our scheme to achieve the parallel measurement of complex mixtures covering multiple spectral regions.
![]()
Figure 4.Dual-comb spectroscopy of methane absorption. The gas pressure of methane is 50 mbar. The effective light path length is 8 cm, 1 m, 8 m, and 8 m for H1–H4, respectively. (a), (b), (g), (h) Dual comb absorption spectra at 3550, 1750, 1185, and 900 nm region. The spectra were coherently averaged 75,000 times. (c), (d), (i), (j) Extracted absorption lines (gray) from the dual-comb spectra and the theoretical absorption profiles (red) from the HITRAN database. (e), (f), (k), (l) Magnified view of part of the methane absorption lines. Gray lines stand for experimental extracted lines, red lines for theoretical profiles from HITRAN, and purple lines for residual between theoretical result and experimental observation.
In addition, the wavelength tuning characteristics of our system were also demonstrated by changing the wavelength of the MIR pump pulse. The pump wavelength was altered through the wavelength of the MIR continuous-wave laser or the poling period of the fan-out PPLN crystal in optical parametric amplification. During the tuning process, the coherence property of the mid-infrared pump comb is well-maintained, which has been demonstrated in our previous work [33]. As shown in Fig. 5, with the wavelength tuning of the pump pulse from 3.3 to 4.3 μm, the corresponding harmonics were also shifted accordingly. Figures 5(a)–5(c) represent the measurement results of the three spectrometers, respectively. The near-infrared spectra vary in the range of 1100–1400 nm and 850–1000 nm for H3 and H4. As to the visible region, because there are multiple overlapping spectral regions of higher-order harmonics, the resulting spectrum can be tuned nearly continuously between 375 and 800 nm. The flexible spectra, which cover a wide range of spectral regions from the UV to MIR, provide a compact and dependable dual-comb source for multi-target detection. It is believed that the optical coherence of the generated OFCs can be maintained over the whole tuning range. This scheme could pave the way for future broadband OFC generation, benefiting a wide range of spectroscopic applications.
![]()
Figure 5.Wavelength tuning characteristics of the dual-comb system, with the MIR pumping wavelength tuning from 3.3 to 4.3 μm. (a) Tunable spectra for H1 and H2, measured with a fast Fourier transform analyzer (Bristol 771B). (b) Tunable spectra for H3 and H4, measured with an optical spectrum analyzer (Yokogawa AQ6370). (c) Tunable spectra for H5–H9, measured with a fiber spectrometer (Ocean Optics HR4000).
3. CONCLUSION
In conclusion, we report the generation of coherent dual-comb sources at multiple spectral regions from UV to MIR through high-order harmonic generation driven by a mid-infrared pump pulse. With the adoption of APPLN waveguide, up to ninth-order harmonic was generated, which is limited by the transparency range of the nonlinear material. Our experimental configuration greatly restrains the phase noise degradation and helps to preserve the pump coherence for every generated harmonic. We investigated the coherence of every harmonic through DCS at every generated spectral region from 450 to 3600 nm. The measured mode-resolved dual-comb spectra demonstrated the well-preserved coherence during the cascaded quadratic nonlinear processes from the fundamental to eighth-order harmonic. The methane absorption spectroscopy was performed at 3550, 1750, 1185, and 900 nm, verifying the application capability of detecting multiple ro-vibrational bands simultaneously, which could provide a much more insightful perspective on the molecular structure. Besides, the flexible tunability of the generated spectra shows the spectral extension capability of our dual-comb source, which is beneficial for future spectroscopic applications. The system performance can be further improved through delicate waveguide design to achieve higher conversion efficiency or a high-power broadband pump source to realize continuous spectral coverage. Thus, the mode-resolved spectra with a distinctive teeth structure proved the well-preserved coherence of our dual-comb sources, and our results could be helpful for future exploitation of broadband coherent optical frequency combs.
APPENDIX A: FOURIER-LIMITED RELATIVE COMB TOOTH LINEWIDTH
To further evaluate the coherence property of every generated harmonic in the HHG process, longer interferogram signal was recorded and analyzed. Figure
![]()
Figure 6.Fourier transformation results of 10-s-long continuous data stream. The linewidth of individual comb tooth is 0.1 Hz in RF domain for every harmonic from H1 to H8. It equals the Fourier limit of 10-s-long recording time, demonstrating the coherence of our dual-comb sources. OF, optical frequency domain; RF, radio frequency domain.

Set citation alerts for the article
Please enter your email address
© Copyright 2018-2021 | Chinese Laser Press. All Rights Reserved 沪ICP备15018463号-20