
Yanyan Cao, Chao Wang, Qinwei Ma, Shaopeng Ma, "Experimental investigation of the startup time difference between high-speed cameras," Chin. Opt. Lett. 13, 070401 (2015)
- Chinese Optics Letters
- Vol. 13, Issue 7, 070401 (2015)
Abstract
High-speed cameras (HSCs) are widely used in research and industry to investigate rapid processes. With the help of advanced photometric algorithms[
However, the assumption of a simultaneous startup might not always hold. When a HSC receives the electrical trigger signal, a module in the camera will “check” the signal and then “start” the image recording, and there should be a time delay, although very short, for the “check and start” operation. For different cameras, especially when the cameras are of different models, there are probably small differences between the trigger modules, and the “check and start” time delay for the two cameras may thus be different. Therefore, the image recordings of the two cameras may not start up simultaneously, and there may be a STD. Consequently, there is a time offset between the two time axes, and a corresponding image offset between the two recorded image series. Obviously, this will lead to measurement errors, if the time axis is determined in the traditional way. In some cases, the measurement results will be meaningless if the STD is large. However, the STD of HSCs has not received the attention of researchers.
This Letter systematically studies the STD of HSCs. A STD measuring system based on a specially designed light signal generator is first constructed, and the STDs of different HSC assemblies consisting of one brand of HSC (Photron) are systematically measured. It is found that there is a large STD in a certain percentage of triggers for all HSC assemblies, even when the two cameras are of the same model and the same batch, and are synchronized with a suggested synchronizing line[
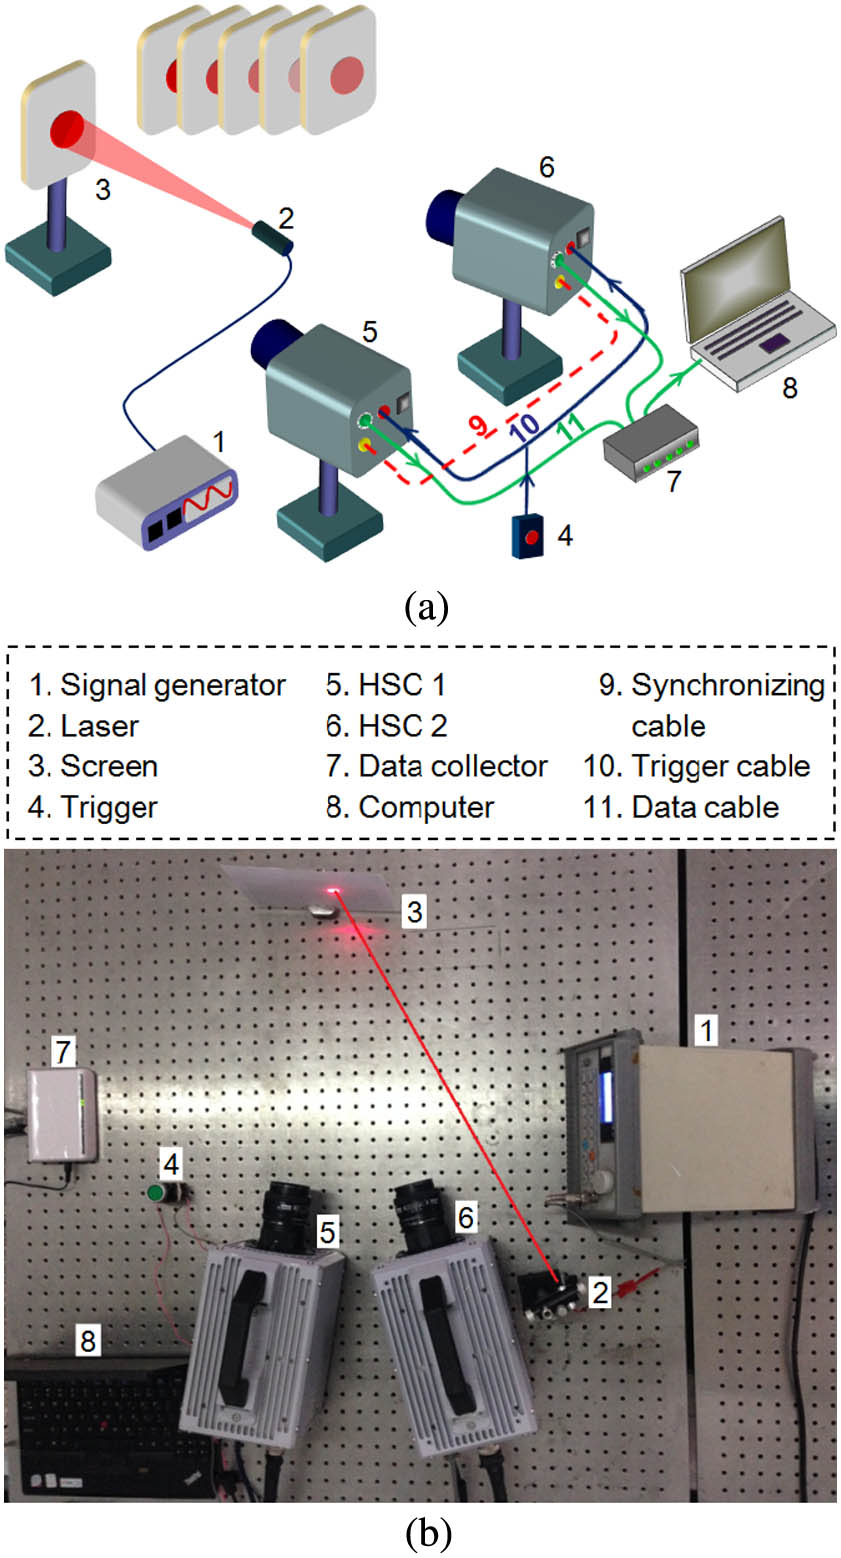
The system shown in Fig.
![]()
Figure 1.Measurement system: (a) Schematic setup. (b) Experimental setup.
After the experiment, the images recorded by the two cameras are exported for analysis. As shown in Fig.
![]()
Figure 2.Principle of STD determination.
![]()
Figure 3.Examples of two situations of STD: (a) STD error. (b) No STD error.
To investigate the STD of two-camera systems, an experiment was conducted using two different models of HSCs, the Photron Fastcam-SA1.1 (monochrome) and the Fastcam-SA2 (color). In the experiment, the image capturing rates of the two cameras were set as 10000 frames per second (fps). Measurements were made in 10 groups. In each group of measurements, the two cameras were connected properly with the trigger first, and then the cameras and the laser were powered on for 30 min for preheating. Each group comprised 20 measurements. For each measurement, the two cameras were triggered and 5000 images were captured and then exported for analysis. After the 20 measurements were made, the cameras and laser were powered off and the trigger disconnected. After the experiments, the images were analyzed, and the STD for each measurement was obtained, as shown in Fig.
![]()
Figure 4.Distribution of STD error: (a) Percentage of STD error. (b) Position of STD error.
Figure
The effect of the image capturing speed on the STD error was investigated by conducting the above experiment for different frame rates of 10000, 20000, 30000, 40000, and 50000 fps. For each frame rate, 20 measurements were made, and the STD error was recorded and analyzed. Figure
![]()
Figure 5.STD error for different frame rates: (a) Percentage of STD error. (b) Time difference. (c) Image offset.
Two synchronizing trigger modes are used in these five camera assemblies: parallel signal trigger and synchronizing cable trigger. For the first mode, a trigger signal is divided into two signals and then connected to the two cameras. For the second mode, a synchronizing cable is added to the two cameras based on the parallel signal trigger mode[
The different assemblies of the cameras listed in Table
| Camera | Model of camera 1 | Model of camera 2 | Synchronizing | Frame rate ( |
|---|---|---|---|---|
| I | Photron SA 1.1 | Photron SA 2 | No | 1, 2, 3, 4.25, 5.4 |
| II | Photron SA 1.1 | Photron SA 2 | Yes | 1, 2, 3, 4.25, 5.4 |
| III | Photron SA 5 | Photron SA 5 | No | 1, 2, 3, 4, 5, 6, 7.5, 10, 15, 30 |
| IV | Photron SA 5 | Photron SA 5 | Yes | 1, 2, 3, 4, 5, 6, 7.5, 10, 15, 30 |
| V | Photron SA 1.1 (2009) | Photron SA 1.1(2013) | Yes | 1, 2, 3, 4.2, 5, 6, 7.5, 10, 15, 30 |
Table 1. Assemblies of HSCs
![]()
Figure 6.Percentage of STD error for different assemblies of HSCs listed in Table
The present study developed a system that measures the STD of two HSCs started by one trigger, and systematically studied the STD for one brand of HSCs (Photron). It was found that there was a STD error for a sizable percentage of triggers, and no STD for others. In the worst case, the percentage of STD error reached 35%. The STD could be positive or negative, because either camera could operate earlier than the other. In the worst case, the STD reached several hundreds of microseconds, which is equivalent to an image offset of tens of images. The STD was large enough and the percentage of occurrence of obvious STD high enough for the STD to be analyzed using different models of HSCs.
Systematic investigations of the percentage of STD error for different assemblies of HSCs showed that the uniformity of the two cameras was the most important factor affecting the percentage. Even a difference in batch number could lead to a high percentage of STD errors. The synchronizing cable was the second most important factor affecting the percentage. Using the synchronizing cable, the percentage could be reduced to 1/2 or 1/3. However, even in the most ideal situation (i.e., cameras of the same model and batch, synchronized with the cable), there was still a STD error in a certain percentage (about 2%) of measurements.
The existence and magnitude of the STD error must be addressed in experiments where the strict synchronicity of two HSCs is required. The random nature of the STD error observed in this study shows that the synchronicity must be monitored during an experiment. Experiments that can be repeated easily should be conducted again when there is a STD error. Meanwhile, two image series obtained in an experiment that can only be conducted once must be realigned using the measured STD. In practice, the STD can be monitored and measured using high-frequency sinusoidal light projected on the margin of the field of view, with the light being produced by a small electrical device and led by two optical fibers.
References
[1] R. Hartley, A. Zisserman. Multiple View Geometry in Computer Vision(2000).
[2] M. A. Sutton, J. J. Orteu, H. W. Schreier. Image Correlation for Shape, Motion and Deformation Measurements: Basic Concepts, Theory and Applications(2009).
[3] A. J. Rosakis, O. Samudrala, D. Coker. Science, 284, 1337(1999).
[4] M. Yazici, J. Wright, D. Bertin, A. Shukla. Compos. Struct., 110, 98(2014).
[5] C. Periasamy, H. V. Tippur. Meas. Sci. Tech., 24, 025202(2013).
[6] J. G. Zhu, H. M. Xie, Z. X. Hu, P. W. Chen, Q. M. Zhang. Surf. Coat. Tech., 206, 1396(2011).
[8] P. L. Reu, T. J. Miller. J. Strain. Anal. Eng., 43, 8(2008).
[9] V. Tiwari, M. A. Sutton, S. R. McNeill. Exp. Mech., 47, 4(2007).
[10] M. Rossi, F. Pierron, P. Forquin. Meas. Sci. Technol., 25, 025401(2014).
[12] Z. B. Zhou, P. W. Chen, F. L. Huang, S. Q. Liu. Opt. Laser. Eng., 49, 366(2011).
[13] X. Peng, X. L. Liu, Y. K. Yin, A. M. Li. Opt. Lett., 36, 157(2011).
[14] D. L. Lau, K. Liu, L. G. Hassebrook. Opt. Lett., 35, 2487(2010).
[15] F. Yu. Opt. Laser. Eng., 48, 1(2010).
[17] . Fastcam SA 1.1 Hardware Manual(2007).


Set citation alerts for the article
Please enter your email address

© Copyright 2018-2021 | Chinese Laser Press. All Rights Reserved 沪ICP备15018463号-20