Jing Ma, Canhua Xu, Yangguang Yao. Real-time observation of liquid crystal molecular directions based on a snapshot polarimeter[J]. Chinese Optics Letters, 2017, 15(6): 061601
Copy Citation Text
The polarization state of transmitted light is linked to liquid crystal (LC) molecular distribution. The dynamic behavior of a twisted nematic LC molecule is measured with a home-built 10 kHz snapshot polarimeter. Only the transient molecule rotations are observed when the external voltage changes, and the molecules return to their original orientations quickly even when high voltage is applied. Our observations cannot be attributed to the traditional electro-optic effect. The invalidation of the static external field indicates the shielding effect of redistributing impurity ions in an LC cell.
Owing to their large birefringence, high modulation accuracy, and low power consumption, liquid crystal (LC) devices have been widely used in the fields of display and non-display areas[1–5]. However, the relatively long response time remains a major obstacle to transient applications, such as fast display and phase modulation. Numerous efforts have focused on LC materials, device configuration, and driving methods to improve LC response[6–9].
In theory, LC molecules can be symbolized by a rigid stick with an induced electric or magnetic dipole on it, which will rotate to a different orientation owing to the spontaneous polarization under an external field[10–12]. Therefore, the speed of an LC device depends on the process of molecule redistribution. The previous research indicates that, besides the external field, the existence of impurity ions also plays an important role in the dynamic behavior of LC molecules. Theoretical analyses show that an electrical double layer generated from the redistribution of ionic impurities diminishes the external field, and the molecules return to their original distribution after a transient excitation[13,14]. But few experimental proofs on this dynamic process have been presented, as far as we know.
Due to the electro-optic (EO) or magneto-optic (MO) effect, the LC molecular orientation can be analyzed through the measurement of transmitted polarization. However, in early works, the polarimeters were used sequentially, and the time-resolved analysis was based on various input and output polarization states and multiple synchronized acquisitions[15,16]. In recent years, a snapshot Mueller matrix polarimetry based on wavelength-polarization encoding was designed to study LC dynamic behaviors, such as optical bistability, instantaneous depolarization, etc.[17,18]. But there has not been much discussion on the function of ion impurities in the EO effect. Very recently, we reported an alternative polarimetry based on the interference in a birefringent crystal wedge to perform the snapshot polarization measurement[19]. In this Letter, the technique is used to achieve LC molecular orientation with a setup that is significantly less complicated and has a comparable speed of 10 kHz to the latest reported Mueller matrix polarimetry[20]. The average molecular director in a twisted nematic LC cell was measured and discussed under the drive of rectangular voltages. The results show that the molecular director modification is not synchronized with the external electric field directly. It varies on the edges of the rectangular voltage and recovers at the platform region. Our observations support the theory based on redistributed ionic impurity.
Sign up for Chinese Optics Letters TOC. Get the latest issue of Chinese Optics Letters delivered right to you!Sign up now
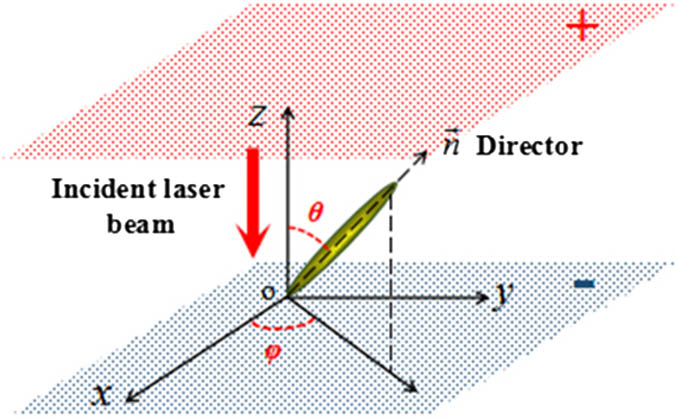
The sketch of the LC molecule is shown in Fig. 1. The light birefringence exists between the long and short molecular axes. Particularly in a twisted nematic LC cell, a helical arrangement of molecules is formed under the condition of planar anchoring. By applying an external electric field, the LC molecule moves up or down owing to the attached spontaneous polarization.
Figure 1.Sketch of the molecular director orientation in an LC cell.
Due to the inhomogeneous distribution, the director in Fig. 1 is not addressed to a particular LC molecule. It relates to the birefringence of the whole LC cell and can be understood as an effective director on average. Correspondingly, and in this article describe the orientation of this effective molecular director. The variation of the molecular orientation induces the change in the light birefringence as follows[10]: where and are the ordinary and extraordinary indices of the LC, respectively; is the out-of-plane angle of the molecular director to the external electric field ( direction) in Fig. 1, which is related to the phase delay as where is the thickness of the LC cell, and is the wavelength of the incident light. Without the external electric field, the molecular directors are parallel to the plane but enforce a certain degree of twisting due to the rub angle difference between the two surfaces. Due to the waveguiding of the nematic helix[21], the transmitted polarization is rotated following the helical structure of the LC material. Therefore, the in-plane angle in Fig. 1 is simply equivalent to the principal axis angle of the transmitted polarization, which can be calculated from phase delay and amplitude angle :
Ignoring the diattenuation, the depolarization and molecular distribution nonhomogeneity in the direction are weak in a ferroelectric LC[10]. So, angles of and are sufficient to describe the orientation of the molecular direction. The dynamical behavior of the LC molecules can be detected by real-time measurements of the transmitted polarization.
The setup of polarization measurement is shown in Fig. 2. An He–Ne laser is used as the light source and is expanded after the LC cell. A birefringent crystal wedge and a polarizer with the axis at 45° are included in the light path of the phase-delay measurement; an added quarter-wave plate with the fast axis at 45° is inserted before the crystal wedge in the light path of the amplitude angle measurement. In our setup, a semi-circular quarter-wave plate is applied to integrate these two measurements into one light path. Therefore, there are two sets of fringes present at the left and right sides of the light spot, as shown in the insert of Fig. 2. The light intensity along the horizontal direction in the middle of the light spot is recorded by a linear array camera, and the data are transferred and analyzed by a LabVIEW program on the computer.
Figure 2.Setup of single-shot polarization state measurement. The inset shows two groups of fringes that are separated by a dark vertical line in the middle of the light spot.
The optical axes of the crystal wedge are on the and directions, respectively, as shown in Fig. 2. The wedge angle is in the direction. So the material thickness difference induces a continuously varied phase delay along the direction in the light spot. If the wedge angle is , the induced phase delay can be expressed as where is the wavelength of the measured light; and are the ordinary and extraordinary indices of the crystal material, respectively. If the polarized state of the incident light is described by a Jones matrix as[22]the Jones matrix for the crystal wedge can be written as
After passing through the crystal wedge and the subsequent 45° mounted polarizer, the light intensity is
Equation (7) shows that the positions of the interference fringe are linearly dependent on phase delay . Therefore, can be calculated from a fringe location measurement after a suitable calibration. In the light path of the amplitude angle measurement, the light intensity on the camera is
Using Eq. (3), the light intensity can be rewritten as
Here, Eq. (9) has the same formation as Eq. (7). So the polarized principal axis angle can also be detected by a fringe location after a suitable calibration. Detailed descriptions on our measurement method, setup, calibration, and error analysis were reported very recently[19].
In general, phase delay and polarized principal axis angle are linearly dependent on the fringe positions and can be detected directly by the fringe locations. Because and are related to the orientation of the LC molecule, the response of the LC molecule can be recorded and analyzed with our setup.
The twisted nematic LC material under study is a mixture of the SLC25 series, which has a birefringence around 0.083 at 632.8 nm. The voltage is applied through transparent, conductive films on two cell surfaces with a gap of about 3.4 μm. The twisted angle of the LC molecules on the two surfaces is , which can be confirmed by an independent detection with a polarizer. A polarized He–Ne laser with 3 mW power at 632.8 nm is used as the light source. The normal incident light with a beam spot of about 1 mm is expanded to more than 15 mm after the LC sample. The subsequent measurement setup includes: a quartz wedge () with dimensions of and a wedge angle of 1°, a polarizer with the axis at the 45° direction (an extinction ratio of ), and a high-speed linear array CMOS camera (Teledyne DALSA, LA-CM-04K08A) with an 80 kHz scanning frequency available. In our experiments, a 10 kHz scanning frequency is used (0.1 ms time resolution). An additional semi-circular quarter-wave plate at 632.8 nm with the axis at the 45° direction is inserted before the quartz wedge for the measurement. The parameters of the quartz wedge are chosen to produce a fringe interval of about 5.1 mm, which spans 1140 pixels on the camera. This is because in all the experiments, a fringe location uncertainty of pixel is obtained, and, according to Eqs. (7) and (9), measurement errors of and can be estimated for the and measurements, respectively. The ambient temperature is controlled at . The temperature variation of the optical index in the quartz wedge can be neglected, and the LC sample is kept in a single-twist nematic phase.
As in the normal applications, a 500 Hz rectangular voltage is applied to the LC cell. The threshold for a Fredericks transition[23] is 7 V for our sample. To avoid the diffraction phenomenon occurring at the driving threshold, we select rectangular voltages with ranging from 8 to 20 V and zero central offset in the experiments. and are measured by the fringe locations and presented in Figs. 3 and 4, respectively. The rectangular voltage is induced at time zero and turned off at 4744 ms. Before the driving, is about 159.0°, but it changes to a smaller value during the driving. In particular, drops to zero with a of 20 V, which means that most molecular directors are parallel to the strong external field. Thus, the light birefringence vanishes. At the same time, changes from the initial to a maximum value of 43.0°. The initial is equal to the LC molecular rub angle at the exit surface due to the waveguiding of nematic helix. When most of the LC molecules are parallel to the external electric field, returns to the principal axis angle of the incident light. The difference of 59° in agrees with the twisted angle () of our sample.
Figure 3.Phase delay under 500 Hz rectangular driving voltage with different amplitudes.
On the rising edges of Figs. 3(a) and 4(a), the response time of and decreases rapidly with the increase of driving voltage, such as 131.0 ms at 8 V and 2.4 ms at 20 V for and 134.0 ms at 8 V and 7.1 ms at 20 V for , respectively. The results show that a higher driving voltage will accelerate the LC response. On the falling edge of Figs. 3(b) and 4(b), the falling time is independent of the driving voltage, about 40 ms for both angles. The response time dependence is derived from the fact that the LC molecule is dragged by the external field on the rising edge and recovers to the original orientation on the falling edge. The falling time provides the response time limit for increasing the driving voltage. The stable values of and under the driving depend on , as shown in Fig. 5. The transmitted light presents an elliptical polarization until the rises to 20 V. The saturation of both angles is observed at high driving voltages.
Figure 5.Phase delay and polarized principal axis angle under different driving voltages.
Small oscillations with an amplitude of 2.5° in , 1.5° in , and frequency of 1 k Hz are recorded in all the curves in Figs. 3 and 4. The inset of Fig. 3(b) shows the oscillation in , which reflects the swing of the LC molecular director. The small amplitude indicates the molecules cannot follow the external field. The reason might be the damping of the LC molecule or the attenuation of the internal electric field. But the first reason does not result in the modification of the and average values during the driving. So, we introduced the model of redistribution of ionic impurities to explain our observations[13,14]. In an actual LC device, the impurity ions are inevitably generated in the production of the LC material, coating, seal, or even electrode. As this theory predicted, the ionic impurities will transport to the two surfaces of the LC sample under the driving and further build an internal field to cancel the external field. Therefore, the LC molecules return to the original distribution after a transient excitation. This phenomenon is more prominent in experiments with a lower driving frequency.
Figures 6 and 7 are the experimental results with 1 Hz rectangular voltage and a of 20 V. During a driving time of 6 s, 12 peaks are recorded. The molecule rotates on both the upward and downward edges of the driving voltage. In Figs. 6(b) and 7(b), single peaks of and are plotted. The data points on the figures have the time interval of 0.1 ms. Rising edges of 2.4 and 7.1 ms for and are detected, and the fall edges of both angles are about 40 ms, similar to the oscillations mentioned above. The LC molecular direction is not directly synchronized with the external field, as predicted in the EO effect theory for pure LC materials. It returns to the original distribution even when a high driving voltage is applied. The peaks smaller than the subsequent values in both angles might be attributed to the response of the driving circuits. The driving voltage dose not reach 20 V in the first period.
Figure 6.Evolution of phase delay angle under 1 Hz rectangular driving voltage.
Meanwhile, a transient current with a peak of 0.7 mA is measured with a series resistance on the driving edge. The current has a rising time shorter than 0.4 ms and about a 20 ms falling time. Because the ionic charge redistribution is slower than molecule rotation, a fast excitation and a slower relaxation can be found in Figs. 6 and 7. In the case of high-frequency driving, the ionic charge redistribution and the internal field are not fast enough to establish. Therefore, the change of the molecular director can be maintained, and the EO effect appears.
In conclusion, a snapshot polarization measurement setup is built up to study LC molecule dynamics under external fields. Transmitted polarization from a twisted nematic LC cell is measured and applied to analyze the molecular distribution. A small oscillation and a transient rotation of the LC molecule are observed under rectangular voltages with 500 and 1 Hz frequencies, respectively. Because the molecular orientation cannot be maintained even when static high voltage is applied, our observation cannot be explained by the traditional LC EO effect. The measured transient current indicates that the internal field originated from the redistribution of impurity ions, which plays an important role in LC molecular dynamics. More theoretical analyses, combined with LC viscosity, elastic coefficient, impurity concentration, etc., are necessary to explain the evolution curves of the molecular director in the future.
Jing Ma, Canhua Xu, Yangguang Yao. Real-time observation of liquid crystal molecular directions based on a snapshot polarimeter[J]. Chinese Optics Letters, 2017, 15(6): 061601