Yu Zheng, Fangwen Sun. Three-dimensional position measurement of a levitated nanoparticle in a vacuum by a Dove prism[J]. Chinese Optics Letters, 2019, 17(6): 060901
Copy Citation Text
Forward-scattering-light interferometry has become the most commonly used position detection scheme in optical levitation systems. Usually, three-set detectors are required to obtain the three-dimensional motion information. Here, we simplify the three-set detectors to one set by inserting a Dove prism. We investigate the role of a Dove prism in the position measurement process with an optical levitation system in vacuum. The relationship between the power spectral density and the rotation angle of a Dove prism is experimentally demonstrated and analyzed. This work shows that the Dove prism can greatly reduce the complexity of the experimental setup, which can be applied to compact optical levitation systems for studies in metrology, quantum physics, and biology.
Levitation systems in vacuum, especially optical levitation, have become one of the most popular optomechanical systems, due to low damping, isolation from the environment, and outstanding motion control ability[1]. Many basic physical topics have been investigated in this system such as Brown motion on the nanoscale[2], ultra-weak force detection[3–5], mechanical cooling of nanoparticles[6,7], and microscopic thermodynamics[8,9]. The prospect of a mesoscopic quantum platform in levitation systems has also been shown[10–14].
For all levitation experiments, it is fundamentally necessary to acquire the position of the levitated particle. In all the position detection schemes, forward-scattering-light interferometry combined with balanced photodetectors[2,15] has become the most commonly used scheme due to its large bandwidth and high sensitivity.
In the forward-scattering-light interferometry scheme, position information is hidden in the interference pattern between the trapping laser and the scattering light from the trapped particles[16–19]. Due to the asymmetry of the potential well[20], the movement of the trapped particle can be separated into three independent components with their motion directions perpendicular to each other. For a Gaussian beam trapping laser, the directions of the three components are respectively parallel to the propagation direction of the beam (set as the Z axis), the polarization direction of the laser (set as the X axis), and a direction perpendicular to the plane of the other two directions (set as the Y axis). To extract all the 3D position information in X-Y-Z axes from the interference pattern[6,7], first, a set of beam splitters is used to divide the forward-scattering light into 3 parts. Usually, a D-shaped mirror is applied to split one part of the light beams in two halves from the center along the X axis. A balanced photodetector measures the light intensity of the two halves of the light beams separately and outputs the difference, which is proportional to the displacement distance from the equilibrium position in the Y direction. The method for measuring the movement along the X direction is similar, except that the beam is split along the Y axis. The intensity difference between the forward-scattering light and a reference beam sample from the trapping laser is proportional to the displacement distance along the Z axis, which can be recorded to present the movement along the Z direction.
Sign up for Chinese Optics Letters TOC. Get the latest issue of Chinese Optics Letters delivered right to you!Sign up now
Although the conventional forward-scattering-light interferometry scheme is sophisticated, there are still two improvements that can be done. First, it is unnecessary to set three balanced detectors if we do not need to record all the three-dimensional (3D) movements simultaneously. Second, due to the residual internal stress of the optical component, the polarization of the trapping laser may deviate from the original direction. It may make the direction of the independent-moving axis deviate and introduce a cross talk from other axis motion in the position signal. Eliminating the cross talk by adjusting the D-shaped mirror is very inconvenient due to difficulties in the re-adjustment of subsequent optical components that are used to couple the light into the photodiode. Here, instead of rotating the D-shaped mirror to adjust the split angle on the forward-scattering light, we can rotate the light beam by inserting a Dove prism into the light path between the optical trap and the D-shaped mirror.
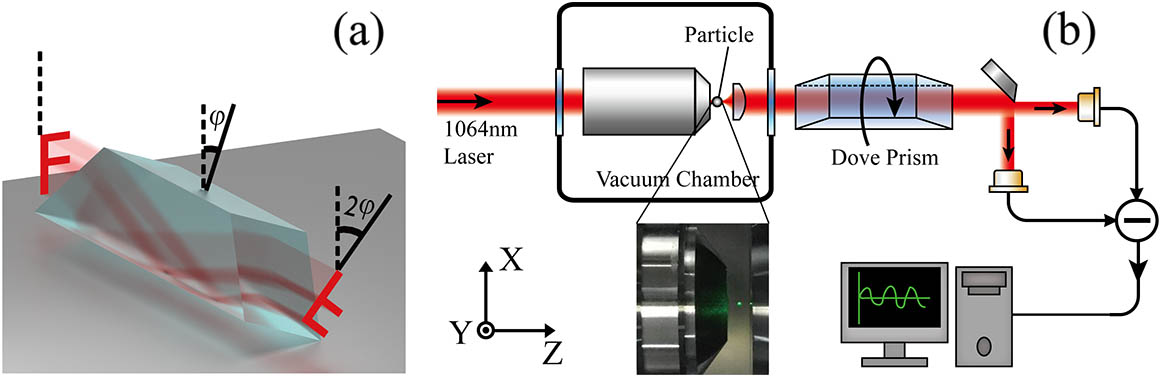
As shown in Fig. 1(a), the Dove prism can flip the image that propagates along its longitudinal axis, and when the Dove prism is rotated by around its longitudinal axis, the flipped image will be rotated by in the same direction around the axis of the Dove prism[21].
Assuming the rotation angle of the Dove prism is 0° when the two trapezoidal faces are perpendicular to the X axis, the outlet light pattern is just flipped vertically without rotation. It has been proved that the intensity difference between the left and right half is proportional to the displacement distance of the trapped particle from the equilibrium position in the X axis[18]. We can get that where is the displacement in the X axis, is the conversion factor between the intensity and displacement, and () is the intensity of the right (left) half of the forward-scattering-light beam. It means that where is the intensity distribution on the detection plane without a Dove prism. (, ) and (, ) are the position coordinates of the trapped particle in the circular coordinate or the Cartesian coordinates on the X-Y plane. depends on the numerical aperture (NA) of the condenser and can be assumed to be infinity here.
If we rotate the Dove prism by , the intensity distribution on the detection plane will be flipped and rotated by around the Z axis. The intensity of left and right half is
It means that the laser intensity on the right photodiode is from the bottom half of the forward-scattering-light beam, and the intensity on the left is from the top half. So, we can get that where is the displacement in the Y axis, is the conversion factor between the intensity and the displacement, and () is the intensity of the lower (upper) half of the forward-scattering-light beam. Therefore, from Eqs. (1) and (6), we can measure the displacement in the X and Y axis on the same balanced photodetector by rotating the Dove prism.
Since the movements along the X and Y directions are independent, we can get the output of the balanced detector as when the Dove prism is rotated by .
In the experiment, as shown in Fig. 1(b), a 200 mW 1064 nm TEM00 Gaussian laser with polarization along the X axis is focused by an objective () in a vacuum chamber. Silicon nanospheres are dispersed in ethanol and sent to the trapping position by an ultrasonic nebulizer. The forward-scattering-light that is collected by an aspheric lens () passes through the Dove prism (Thorlabs PM992M-B) and is split by a D-shaped mirror in half from the center along the Y axis. A homemade balanced photodetector (3 MHz bandwidth, AC couple) measures the light intensity difference between the two halves. The signal voltage from the balanced photodetector is recorded by a 250 MS/s digitizer (Spectrum M4i.4421-x8) and processed with MATLAB.
To measure all 3D positions of the trapped nanosphere, we set the Dove prism with its trapezoidal face perpendicular to the X axis and fine rotate the prism until the cross talk from the Y axis motion is minimal according to the power spectral density (PSD). Here we mark the rotation angle of the prism as 0°. Now, the output signal voltage of balanced detector is proportional to the displacement from the equilibrium position on the X axis. Then the prism is rotated by 45°. The signal voltage will be proportional to the displacement on the Y axis. Last, we remove the D-shaped mirror to put all the forward-scattering light into one photodiode of the detector. In this case, the signal voltage is proportional to the displacement on the Z axis. The PSD of movement in the X-Y-Z axis in vacuum is shown in Fig. 2, which can be fitted with[22]where is the eigen angular frequency of the trapped nanosphere, is the damping rate, is the mass of the nanosphere, is the environment temperature, and is the Boltzmann constant.
Figure 1.Schematic of 3D position detection with a Dove prism. (a) Light propagating along the longitudinal axis is inverted by 180° and the angle of rotation of the image is twice that of the rotation angle of the prism. (b) Schematic of the experiment setup. The green spot in the inset is a trapped particle that is illuminated by another 532 nm laser.
Figure 2.PSD of the motion in the X-Y-Z axis. The resonance frequencies are , 128.0 kHz, and 164.8 kHz, respectively. The black lines are fitting curves according to Eq. (8). The air pressure in the vacuum chamber is 8.1 mbar. The diameter of the trapped nanosphere is .
To get the conversion factor between the signal voltage and the actual displacement, we need to know the mass of the trapped particles. Here, we can obtain the damping rate by fitting the PSD and recording the damping rate at different air pressures, which can be fitted by[23]where is the radius of the nanosphere, , is the viscosity coefficient of air, and is the Knudsen number. is the mean free path of air molecules, where is the air pressure and is the mean diameter of the air molecules. As shown in Fig. 3, by setting the density of the particle to be , we can get that the diameter of the trapped particle is . The mass is .
Figure 3.Damping rate decreases with the air pressure. The dashed line is a fit according to Eq. (9).
In order to investigate the relationship between the measured signal and the rotation angle of the prism, we can make a Fourier transformation for Eq. (7) as where is the output of the balanced detector. The PSDs of the X and Y directional motions can be written as[22]where is the recording duration. So, the PSD of the recorded signal can be written as
Because the PSD output is an average of several samples to reduce random noise and the phase difference between X and Y directional motions is random, we can get
Therefore, Eq. (13) can be simplified to where , and . It means that the PSD of the detected data after the Dove prism at angle can be decomposed into an X part and a Y part, with scale factors and , respectively.
We record the PSD of position signal at different angles of the Dove prism, as shown in Fig. 4. During the rotation of the Dove prism from the original angle, the peak of the X resonance frequency is decreasing and the peak of the Y resonance frequency is rising. When the rotation angle is 45°, the peak of the Y resonance frequency reaches a maximum and the peak of X resonance frequency is negligible. Figure 5(b) shows the normalized scale factors of the X part and the Y part in Eq. (15) changing with the rotation angle of the Dove prism.
Figure 4.PSD of the position signal at different rotation angles of the Dove prism.
Figure 5.Peak height of the X and Y frequency parts in the PSD according to the rotation angle of the Dove prism. (a) The PSD when the Dove prism rotation angle is 25°. The black line is the fitting curve according to Eq. (15). (b) The scale factors of the X and Y parts according to Eq. (15) vary with the rotation angle of the Dove prism. The blue and red lines demonstrate and , respectively. is the rotation angle of the Dove prism.
In conclusion, we experimentally measured the position of the optical trapped particle in vacuum along X, Y and Z with one balanced detector by inserting a Dove prism and investigated the effect of the Dove prism on the position signal at different rotation angles. This experimental scheme can simplify the measurement system when it is not necessary to obtain the position information of different dimensions at the same time. This Dove prism enhanced position detection scheme provides a simple solution when the particle’s independent movement direction and measurement direction are not parallel, which may happen in a special beam trap[24].
References
[1] L. Neukirch, N. Vamivakas. Contemp. Phys., 56, 48(2015).
Yu Zheng, Fangwen Sun. Three-dimensional position measurement of a levitated nanoparticle in a vacuum by a Dove prism[J]. Chinese Optics Letters, 2019, 17(6): 060901