Abstract
We present experimental measurements that show direct determination of the dielectric properties of various metals relevant to plasmonics. In contrast to traditional measurements that typically rely on transmission and reflectance measurements, we launch surface plasmon-polaritons on a variety of different substrates and measure the propagation properties using terahertz time-domain spectroscopy. Surprisingly, we find that the extracted values for the dielectric constant for these metals differ by orders of magnitude from published data. In order to validate the obtained results, we separately measure the 1∕e decay length, both along the propagation direction and normal to the metal surface, and show that the results are fully self-consistent with experimental data. The generality of the measurement technique makes it a useful tool to estimate the properties not only of planar conducting substrates but also a wide variety of more complex plasmonic structures.1. INTRODUCTION
The dielectric properties of a medium are central to understanding phenomena such as reflection, propagation, and transmission of light. As such, a variety of techniques have been developed to measure this fundamental parameter of materials. In the case of transparent dielectrics, this is most easily accomplished by using simple transmission measurements, although reflection and waveguide measurements are also commonly used. Other possible approaches involve absorption spectroscopy, ellipsometry, Fourier spectroscopy, and so on [1]. In the case of metals, which are often in the form of thin films, the primary measurement techniques have relied on transmission and reflection measurements. At optical frequencies, where the reflectivity of most metals is not very close to unity (typical metal mirrors have reflectivity in the visible), the extracted values of the dielectric constant are generally reproducible and self-consistent [1,2]. Models describing the permittivity of metals are based typically on the Drude model, which relies primarily on the bulk plasma frequency. For most conventional metals, the plasma frequency lies in the ultraviolet and, thus, is relatively close to the optical frequencies of relevance. As one moves to longer wavelengths, such as the far-infrared or the terahertz spectral range, there are very few equivalent measurements [3–5]. There are a number of reasons for this, but primary among these is the fact that the high conductivity of most metals corresponds to near unity reflection. This raises the issue of what constitutes an appropriate reference, since perfect reflectors do not exist. Thus, most dielectric data for metals in the far-infrared rely on a fit to the Drude model using plasma frequencies that lie near the other end of the electromagnetic spectrum [3]. Such fits usually yield real and imaginary components of the dielectric constant that are many orders of magnitude larger than in the visible.
A correct assessment of the permittivity of metals is particularly relevant given the increased interest in the field of plasmonics in recent years [6]. Surface plasmon-polaritons (SPPs) are electromagnetic waves bound to a metal–dielectric interface that have unique dispersion properties that differ dramatically from the dispersion properties of freely propagating radiation. Given the Drude model fits to the dielectric properties, most metals are commonly assumed to be nearly perfect conductors in the long-wavelength regime (i.e., microwave and terahertz frequencies). From a computational point of view, this approximation dramatically simplifies analyses of various plasmonic structures. It has also given rise to assuming that experimentally measured surface waves on metal films are “spoof” plasmons [7], even though such a designation only applies strictly to bound waves on structured perfect electrical conductors. However, the perfect conductor approximation yields results that deviate from experimental results. For example, the out-of-plane spatial extent [8] for SPPs on unstructured metal films at low terahertz frequencies ( corresponds to ) using published dielectric data [3] yields values that are typically many centimeters to tens of centimeters. This is at odds with experimental data that shows that it is typically on the order of a few millimeters [9–11]. Similarly, transmission measurements using terahertz waveguides show significantly narrower resonances in numerical simulations based on a perfect electrical conductor approximation than has been obtained experimentally [12]. While fabrication tolerances play some role in this, neglecting loss in numerical simulations is also an issue.
In this article, we experimentally extract the complex refractive index and corresponding complex dielectric properties using a modified terahertz time-domain spectrometer. The approach is interesting and unique because it does not require a “perfect” reference; in fact the measurements are self-referenced via multiple measurements taken at different locations on the same substrate medium. Using this technique, we evaluate the propagation properties of SPPs on several different planar metal films. We find that the dielectric properties of three typical metals differ by orders of magnitude from predictions based on a simple Drude model fit. In order to demonstrate that these results are reasonable and self-consistent, we independently measure the in-plane and out-of-plane decay lengths for each metal and show that the results are self-consistent.
2. DESCRIPTION OF THE PHENOMENON
Before moving to the experimental details, we begin by discussing basic properties of SPPs relevant to the discussion here and the expected numerical values of these quantities based on previously published dielectric data [3,4]. The dispersion relation for SPP waves propagating along the interface between a planar metal film and a dielectric is well established and given by [8] where is the complex propagation constant of the SPP wave parallel to the propagation direction, is the radial frequency of the electromagnetic radiation, is the speed of light in vacuum, is the dielectric constant of the dielectric interface medium, and is the dielectric constant of the metal. For the purposes of the discussion here, we assume that is purely real and that only the metal is characterized by a complex dielectric constant, expressed as , where and are the real and imaginary components of the dielectric constant of the metal, respectively. The complex refractive index associated with the SPP propagation is given by .
For SPPs, there are two experimentally measurable parameters that characterize the spatial properties of these fields. The first is the attenuation length along the direction of propagation. The intensity of SPPs propagating along a smooth surface decreases as . Thus, the attenuation length, , is given by It is worth noting that within the terahertz community, it is common to define the attenuation length along the surface based on the electric field amplitude and not the intensity [9,12–14]. In such cases, the appropriate value of would simply be twice the value given here.
The second measurable parameter can be obtained from the propagation constant along the axis within the dielectric medium and can be written as [8] Here, the attenuation is defined in terms of the electric field decay normal to the surface into the dielectric (). Thus the attenuation length into the dielectric, , can be expressed as The exponential decay away from the metal surface arises from the fact that SPPs are electromagnetic waves bound to the metal–dielectric interface and, therefore, take on their maximum amplitude at the interface and decay as one moves away from the surface.
We now consider the SPP propagation properties for two metals (Au and Al) that are highly conducting and often used in plasmonics applications. In Figs. 1(a) and 1(b), we show the real and imaginary components of the complex dielectric constants, obtained using the Drude model and fit parameters from [3]. In stark contrast to the dielectric properties at optical frequencies, is typically larger than , and both are orders of magnitude larger than at visible frequencies [2,3]. In Fig. 1(c), we show the calculated values of the propagation length () along the propagation direction ( axis) as a function of frequency using Eq. (2). Similarly, using Eq. (4), we show the spatial extent of the SPP along the axis in Fig. 1(d).
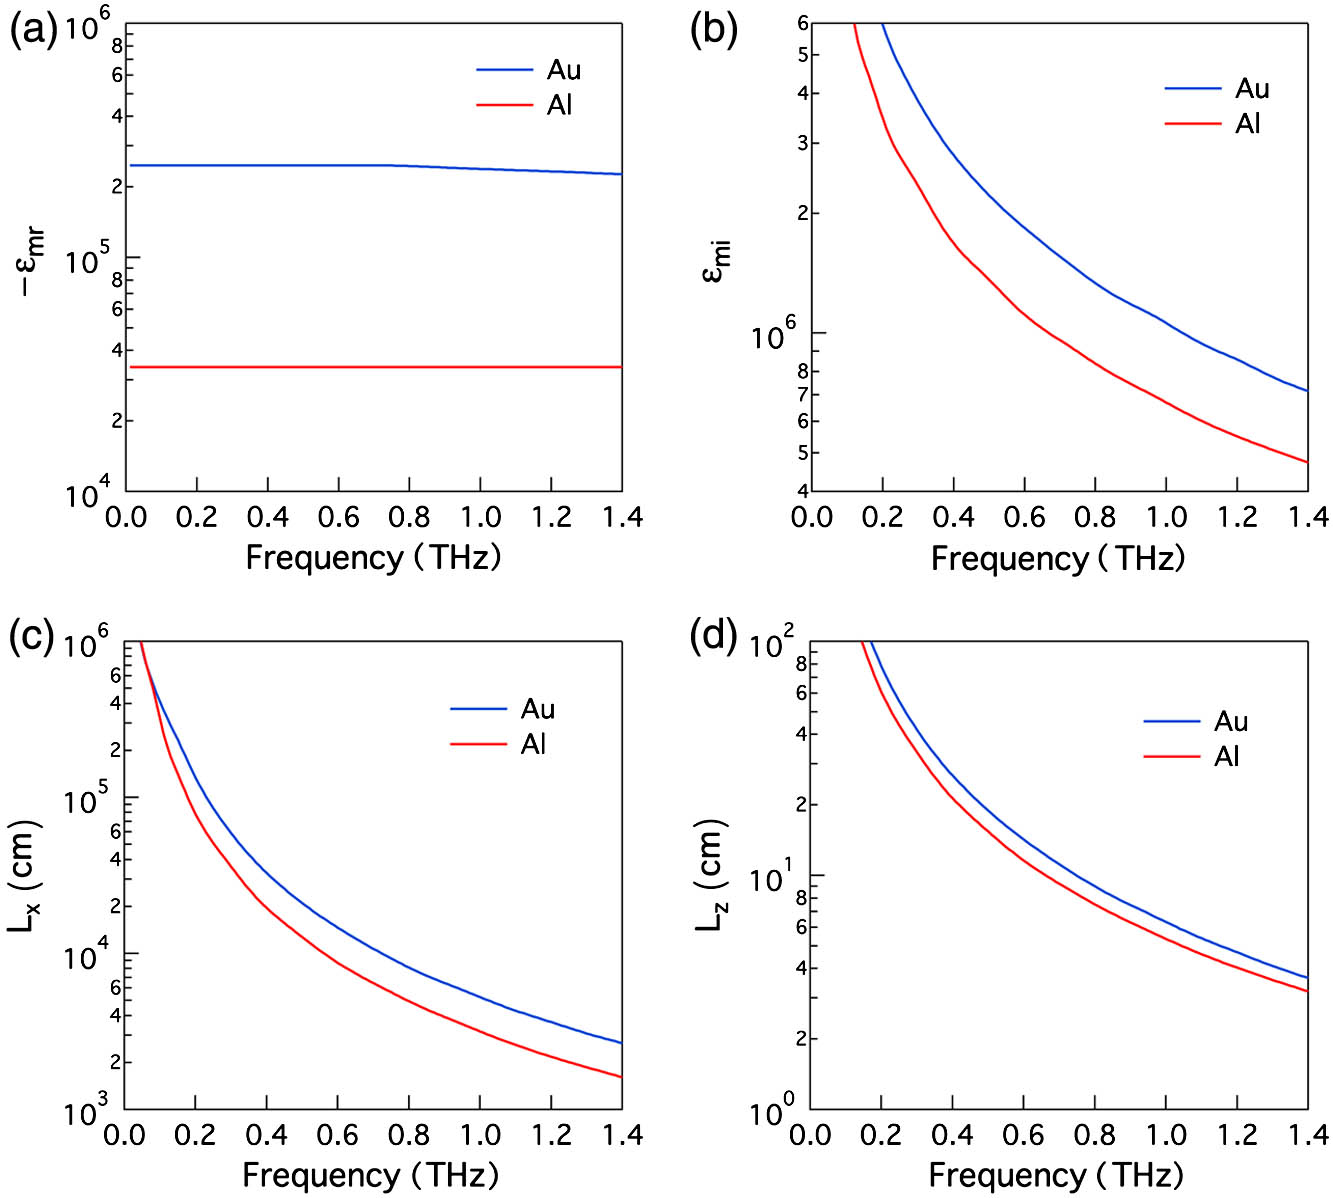
Figure 1.Dielectric and SPP propagation properties for Au and Al at terahertz frequencies based on published data, assuming . (a) Real component of the dielectric constant based on a Drude model fit. (b) Real component of the dielectric constant based on a Drude model fit. (c) propagation length, , along the axis. (d) spatial extent, , along the axis.
These dielectric properties give rise to a number of interesting predictions. For the sake of discussion, we consider what happens at 0.5 THz () using Au, though equivalent results are obtained at other frequencies and with other metals. Based on Eq. (1), . Therefore, the predicted propagation distance (i.e., ) and is (i.e., ), giving rise to the common perception that the surface wave is very loosely bound to the metal surface. As discussed above, none of these calculated values agree well with experimental results.
3. EXPERIMENTAL DETAILS
We used a modified terahertz time-domain spectroscopy system to characterize the properties of several different metals, as shown schematically in Fig. 2. The details of the measurement technique have been discussed in detail elsewhere [12]; however, for completeness, we provide a brief description here. Broadband terahertz radiation was generated using a 1 mm thick ZnTe crystal, which was then collected and collimated using an off-axis paraboloidal mirror. The radiation was focused using a 150 mm focal length polymethypentene (TPX) lens, such that it was normally incident on an input coupler, which consisted of a straight 300 μm deep rectangular cross-sectional groove that was 2 cm in length and fabricated in a 400 μm thick stainless steel metal foil. The purpose in using a 2 cm long groove was to minimize the divergence of the propagating SPP wave. The groove acted as a coupler by scattering a fraction of the incident radiation into SPPs [12,15]. We used the exact same input coupler for all of the studies, which was physically abutted to different 400 μm thick samples (Au, Al, and stainless steel), as shown schematically in Fig. 2. This ensured that we achieved identical coupling characteristics for each set of measurements. The small separation between the two pieces, coupler and sample, had minimal effect on the propagation properties of the coupled SPPs. Each of the metallic samples consisted of a 12.5 cm thick sheet with a surface roughness of rms (i.e., at 0.5 THz). For the Au sample, we deposited 2 μm of Au on a stainless steel sheet. We have previously shown that SPP properties are governed by the properties of the top metal layer, when its thickness is greater than a few hundred nanometers [16].

Figure 2.Schematic diagram of the excitation and detection scheme for measurement of the SPP propagation and sample dielectric properties. Broadband terahertz radiation is normally incident on a 2 cm long rectangular cross-sectional groove that is 300 μm deep. The groove is used to couple normally incident freely propagating broadband terahertz radiation into SPP waves that propagate along the sample surface. A ZnTe crystal that can be freely positioned anywhere above the sample surface is used to measure the component of the terahertz electric field via electro-optic sampling.
The time-domain properties of the component of the propagating terahertz electric field were measured using a second ZnTe detection crystal via electro-optic sampling [17]. The temporal resolution available with our apparatus was 6.66 fs. This crystal could be freely moved about the surface of the sample, as well along the axis, allowing for the electric field in the half-space above the metal surface to be completely mapped. We used this feature to measure the decay in the bound THz electric field along the and axes. Though not utilized here, when both and ZnTe crystals are used, the , , and components of the terahertz electric field can be measured independently in a calibrated manner at any point, which would allow for complete mapping of the terahertz electric field [11,18].
While the operational principles of this approach are essentially the same as with conventional terahertz time-domain spectroscopy, there is a minor difference. In order to understand this difference, consider a medium (i.e., the sample in Fig. 2) that is essentially a perfect electrical conductor, such that the refractive index of the propagating SPP wave is given by . In this case, both the optical probe beam and the coupled SPP wave move at a velocity of , the speed of light in vacuum. Therefore, regardless of the position of the detection crystal along the axis, we would observe a time-domain waveform that is unchanged within the temporal window that is scanned. However, if the medium is an imperfect metal, such that is no longer exactly equal to 1, then as the crystal is moved along the axis, the SPP pulse will propagate slower than the optical probe pulse. Thus, the measured terahertz waveform will shift in time (again ignoring losses). This temporal shift corresponds to a phase change in the frequency domain.
If we now consider losses associated with the imperfect metal, we would measure both a shift in time, as well as a change in the time-domain waveform, corresponding to changes in both the amplitude and phase. Thus, a measurement taken at two different points (at least) along the axis will yield the complex value of . Analytically, the transfer function associated with measurements at two different points along the axis separated by a distance is given by where both and are frequency dependent, is the radial frequency, and corresponds to the Fourier transform of the relevant time-domain waveform. Using the extracted complex value of , we can obtain the complex dielectric constant, , of the metal, using Eq. (1):
4. RESULTS AND DISCUSSION
We now begin by discussing the experimentally determined properties of Au. In Fig. 3(a), we show two time-domain waveforms measured for a separation distance of 10 cm. The waveform corresponding to was actually measured approximately 2 cm after the input groove and on the Au sample. As can be seen, we observe a time shift of 133 fs between the two waveforms. In the absence of any pulse reshaping, this time difference directly yields the real component of , [i.e., , from the relationship ]. For Au, this yields a value of . This is substantially larger than the value of 1.000000026 noted above, which would correspond to a time delay of 0.0087 fs based on the Drude model data.
Figure 3.SPP propagation and dielectric properties for Au. (a) Measured terahertz time-domain waveforms for two positions separated by 10 cm on the Au-coated metal sheet. The time shift arises from the difference in propagation velocities between the terahertz SPP and the optical probe pulses. (b) Corresponding amplitude and phase spectra. (c) Extracted values of and using the Eq. (5). (d) Calculated values of and using Eq. (6). (e) Comparison between the propagation length along the axis computed from (solid line) with and values obtained by taking measurements along the axis. (f) Comparison between the decay length along the axis computed from (solid line) with and values obtained by taking measurements along the axis.
In general, there is always some degree of pulse reshaping. Thus, a more complete analysis involving both the amplitude and phase associated with the waveforms is necessary to extract the complex refractive index of the propagating SPP. In Fig. 3(b), we show the amplitude and phase spectra for the terahertz electric field measured at two specific points along the axis, although data from multiple pairs of measurements were used to ensure accurate data extraction. This was accomplished by simply moving the detection crystal to different points along the axis and recording the terahertz time-domain waveform. Using this data and Eq. (5), we can readily extract the complex value of as a function of frequency, which is shown in Fig. 3(c). We note that below 0.1 THz and above 1.4 THz, the signal-to-noise ratio in the measurements was insufficient to obtain reliable refractive index values. As expected, the value differs only slightly from 1 (in fact, it is across the measured spectral range) and the value of κ is small, corresponding to low loss propagation. Using Eq. (6), we can compute the complex dielectric constant of Au, as shown in Fig. 3(d).
Since the dielectric constant values differ from published data to such a large extent, the obvious question that arises is whether or not the data makes any sense. As we demonstrated in Fig. 1, the published dielectric data yield decay lengths (both in-plane and out-of-plane) that are inconsistent with experimental data. In order to ensure that the results obtained here are self-consistent, we used the measurements discussed above for the terahertz SPP along the axis at eight different points over a length of 15 cm. We then computed the propagation length as a function of frequency, as shown in Fig. 3(e). Also shown in that figure is the value of computed using from Fig. 3(d). In a similar manner, we measured the out-of-plane decay length by moving both the crystal and optical probe beam to different heights above the sample surface and recording the corresponding time-domain waveforms. The decay lengths obtained from these measurements, as well as values for obtained from [again from Fig. 3(d)] are shown in Fig. 3(f). The agreement in both sets of data is excellent, demonstrating that the data is self-consistent. As a final point, we note that at 0.5 THz, () and (). These values are consistent with earlier measurements.
We repeated all of the same measurements for Al and stainless steel, as shown in Fig. 4. In measuring the time-domain waveforms for two different positions separated by 10 cm (not shown), we find that the time shifts are 167 and 733 fs (over a 10 cm long path length) for Al and stainless steel, respectively, which corresponds to and (again, ignoring losses). Based on the data in Fig. 1, it is not surprising that the time shift between Au and Al is approximately similar, with the shift being just slightly longer for Al. Since stainless steel is a much poorer metal, as discussed below, the delay time is correspondingly longer. In Figs. 4(a) and 4(b), we show the extracted complex dielectric constants of these two metals. Aside from the fact that both the real and imaginary components of for Au and Al are somewhat similar, it is interesting to note that the imaginary component for these two metals, which is proportional to the terahertz conductivity, is approximately an order of magnitude larger than that of stainless steel. This is generally consistent with the relative differences in their dc conductivities [3,19].
Figure 4.SPP propagation and dielectric properties for Al and stainless steel. (a) and (b) Extracted values and . (c) and (d) Comparison between the propagation length along the axis computed from (solid line) and values obtained by taking multiple measurements along the axis. (e) and (f) Comparison between the decay length along the axis computed from (solid line) and values obtained by taking measurements along the axis. Note the differences in the axes values between aluminum and stainless steel.
In Figs. 4(c) through 4(f), we show the extracted and measured values of and , which show excellent agreement between the computed values of these two quantities using their respective data and the independently measured values obtained by taking measurements along the and axes. Furthermore, there is a clear trend that is consistent with the notion that Au has the highest conductivity, with Al being only slightly smaller and stainless steel exhibiting a much lower conductivity: and . In other words, for a medium with a higher conductivity, an SPP will propagate over a longer length along the surface and also be more loosely bound on the dielectric side.
5. CONCLUSION
In conclusion, we have demonstrated self-referenced and self-consistent measurements of the dielectric properties of several different highly conducting materials using a modified form of a terahertz time-domain spectrometer that relies on measuring the propagation properties of SPPs. The extracted values of the complex dielectric constant of the metals are orders of magnitude different from published data but are in good agreement with experimental findings. The approach is generic and scalable since the governing system equations do not impose any restriction on the complexity or the size of the plasmonic medium or the surrounding dielectric medium. Thus, this approach is expected to be useful for characterizing other conducting materials that have demonstrated plasmonic behavior [20–22]. Knowledge of the dielectric properties is expected to have a profound influence on the operational properties of devices made from these materials, as well as a broad range of applications that rely on these material properties.
References
[1] E. D. Palik. Handbook of Optical Constants of Solids(1998).
[2] P. B. Johnson, R. W. Christy. Optical constants of the noble metals. Phys. Rev. B, 6, 4370-4379(1972).
[3] M. A. Ordal, L. L. Long, R. J. Bell, S. E. Bell, R. R. Bell, R. W. Alexander, C. A. Ward. Optical properties of the metals Al, Co, Cu, Au, Fe, Pb, Ni, Pd, Pt, Ag, Ti, and W in the infrared and far infrared. Appl. Opt., 22, 1099-1119(1983).
[4] H. Yasuda, I. Hosako. Measurement of terahertz refractive index of metal with terahertz time-domain spectroscopy. Jpn. J. Appl. Phys., 47, 1632-1634(2008).
[5] F.-Y. Ma, J.-P. Su, Q.-X. Gong, J. Yang, Y.-L. Du, M.-T. Guo, B. Yuan. Measurement of the optical constants of thin metal films by THz differential time domain spectroscopy. Chin. Phys. Lett., 28, 097803(2011).
[6] W. L. Barnes, A. Dereux, T. W. Ebbesen. Surface plasmon subwavelength optics. Nature, 424, 824-830(2003).
[7] J. B. Pendry, L. Martin-Moreno, F. J. Garcia-Vidal. Mimicking surface plasmons with structured surfaces. Science, 305, 847-848(2004).
[8] H. Raether. Surface Plasmons on Smooth and Rough Surfaces and on Gratings, 111(1988).
[9] K. Wang, D. M. Mittleman. Metal wires for terahertz wave guiding. Nature, 432, 376-379(2004).
[10] T.-I. Jeon, D. Grischkowsky. THz Zenneck surface wave (THz surface plasmon) propagation on a metal sheet. Appl. Phys. Lett., 88, 061113(2006).
[11] A. Nahata, W. Zhu. Electric field vector characterization of terahertz surface plasmons. Opt. Express, 15, 5616-5624(2007).
[12] W. Zhu, A. Agrawal, A. Nahata. Planar plasmonic terahertz guided-wave devices. Opt. Express, 16, 6216-6226(2008).
[13] R. Mendis, D. Grischkowsky. Undistorted guided-wave propagation of subpicosecond terahertz pulses. Opt. Lett., 26, 846-848(2001).
[14] N. C. J. Valk, P. Planken. Effect of dielectric coating on terahertz surface plasmon polaritons on metal wire. Appl. Phys. Lett., 87, 071106(2005).
[15] T. Thio, K. M. Pellerin, R. A. Linke, H. J. Lezec, T. W. Ebbesen. Enhanced light transmission through a single subwavelength aperture. Opt. Lett., 1972-1974(2001).
[16] X. Shou, A. Agrawal, A. Nahata. Role of metal film thickness on the enhanced transmission properties of a periodic array of subwavelength apertures. Opt. Express, 13, 9834-9840(2005).
[17] A. Nahata, A. S. Weling, T. F. Heinz. A wideband coherent terahertz spectroscopy system using optical rectification and electro-optic sampling. Appl. Phys. Lett., 69, 2321-2323(1996).
[18] N. C. J. van der Valk, T. Wenckebach, P. Planken. Full mathematical description of electro-optic detection in optically isotropic crystals. J. Opt. Soc. Am. B, 21, 622-631(2004).
[19] D. R. Lide. Handbook of Chemistry and of Physics(1995).
[20] J. Gómez Rivas, C. Schotsch, P. Haring Bolivar, H. Kurz. Enhanced transmission of THz radiation through subwavelength holes. Phys. Rev. B, 68, 201306(R)(2003).
[21] T. Matsui, Z. V. Vardeny, A. Agrawal, A. Nahata, R. Menon. Resonantly-enhanced transmission through a periodic array of subwavelength apertures in heavily-doped conducting polymer films. Appl. Phys. Lett., 88, 071101(2006).
[22] L. Ju, B. Geng, J. Horng, C. Girit, M. Martin, Z. Hao, H. A. Bechtel, X. Liang, A. Zettl, Y. R. Shen, F. Wang. Graphene plasmonics for tunable terahertz metamaterials. Nat. Nanotechnol., 6, 630-634(2011).


