Abstract
Laser-induced discharge plasmas (LDPs) have the potential to be inspection and metrology sources in extreme ultraviolet (EUV) lithography. An LDP EUV source was developed to avoid tin electrode erosion in which a tin pool was used as a cathode. A CO2 pulse laser was focused on the liquid tin target surface, and then a breakdown occurred in a very short time. The voltage-current characteristics of the discharge oscillated, lasting for several microseconds, and an RLC fitting model was used to obtain the inductance and resistance. An intensified charge-coupled device (ICCD) camera was used to investigate the dynamics of LDP, which can explain the formation of a discharge channel. The EUV spectra of laser-induced liquid tin discharge plasma were detected by a grazing incident ultraviolet spectrometer, compared with a laser-produced tin droplet plasma EUV spectrum. To explain the EUV spectrum difference of laser-induced liquid tin discharge plasma and laser-produced tin droplet plasma, the collision radiation (CR) model combined with COWAN code was used to fit the experimental EUV spectrum, which can estimate the electron temperature and density of the plasma.In extreme ultraviolet lithography (EUVL)[1], there are two main types of EUV light sources, laser produced plasma (LPP)[2] and laser induced discharge plasma (LDP)[3]. The tin-droplet LPP EUV source was already used in commercial photolithography owing to its high output power and conversion efficiency (CE)[4]. However, it is complicated to realize the synchronization of droplets and laser spots in space and time[5]. Owing to their simple structure and low cost[6], LDP sources were widely used in mask inspection and spectral metrology. LDP was developed from discharge-produced plasma (DPP). It used a pulse laser to produce pre-plasma. The pre-plasma triggers a breakdown between high-voltage electrodes, and a pulsed current is formed, producing plasma with higher temperature and density.
In 2002, Koshelev et al.[7] used a KrF excimer laser to study the EUV CE of a solid tin target in LDP for the first time. In 2004, Borisov et al.[8] proposed a rotating disc electrode solid tin target EUV light source to reduce the erosion of electrodes. In 2008, the Xtreme and Philips[9] made use of a couple of disc electrodes rotating in a tin pool. The thin liquid tin film covering the electrodes reduced the erosion and realized the continuous supply of the target at the same time. The lifetime and the CE of the EUV light source were enormously improved. In 2010, Lu et al.[10] made an observation of the time-resolved visible and EUV images, which indicated that the EUV emission occurred at the hot neck part of the plasma and moved along the anode–cathode gap. In 2015, Lim et al.[11] investigated tin plasma distribution in the post discharge stage of LDP by dark-field schlieren photographs. In 2016, Beyene et al.[12] studied the differences between nanosecond and picosecond LDP sources. In 2016, Lim et al.[13] studied the effect of current rising rate on solid tin target LDP sources. In 2014, Li[14] studied the plasma parameters of solid tin LDP and the influence of the time delay between a discharge pulse and a laser pulse on the EUV spectra.
In the scheme of rotating disc electrodes in a tin pool, when the rotating speed is high, the liquid tin will splash from the rotating electrode due to the centrifugal force. The stable control of tin layer thickness is not easy, and the thickness of tin layers will change with the rotating speed. So a wiper and other devices[9] that can control the thickness and prevent tin splashing are necessary, but make the source more complex. In this Letter, a tin pool cathode is proposed as the liquid cathode for the first time. The tin pool liquid cathode has a simple structure, and reduces the bad influence of electrode erosion. The voltage–current characteristics of LDP and the dynamics of discharge plasma are studied, and the differences of EUV spectra between LDP and LPP are discussed. By comparing the experimental spectra with the spectra calculated by the COWAN code and collision radiation (CR) model, the electron temperature and density are estimated.
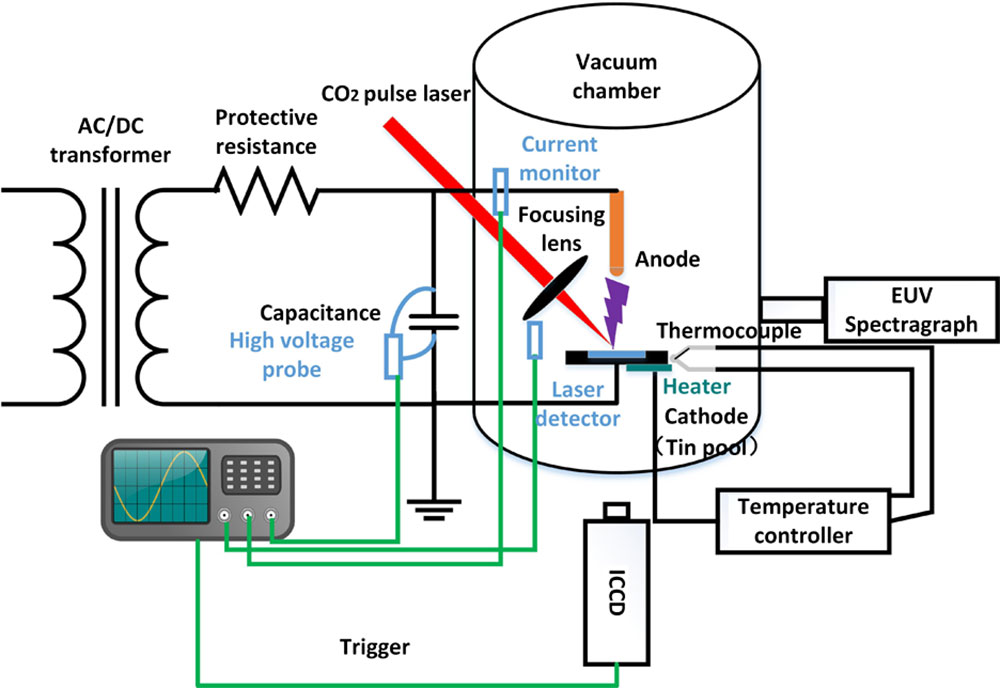
As shown in Fig. 1, the experiment was carried out in a vacuum chamber with a pressure of . A stainless steel hemisphere with a radius of 5 mm was used as the anode, and the cathode was a tin pool with a diameter of 4 cm and a depth of 3 mm. The tin pool was connected to a temperature controller that kept the Sn melting at around 250°C. The temperature was measured by a thermocouple (PT100). The discharge capacitance was 250 nF and the discharge voltage was transformed to thousands of volts via the AC/DC transformer. The distance between the two electrodes was 7 mm.

Figure 1.LDP plume and EUV spectrum detection experimental setup.
A pulsed laser with an energy of 145 mJ, a pulse width of 90 ns, and a repetition rate of 1 Hz was focused on the liquid tin cathode surface through a ZnSe lens with a focal length of 150 mm. The voltage and current were measured by a high-voltage probe (Tektronix P6015A) and a current monitor (Pearson 4997).
An ICCD camera (Stanford 4 Quik E) with a zoom lens facing toward the discharge axis recorded the visible light images of the LDP. The actual size of a single pixel was calibrated with a micrometer. A mid-infrared photovoltaic detector (VML 10T4) was used to detect the laser signal that triggered the ICCD camera.
A grazing incidence EUV spectrometer worked in a vacuum system, was perpendicular to the discharge axis, and detected the extreme ultraviolet spectra produced radially. A zirconium (Zr) film was placed between the chamber and the spectrometer as a filter of 6–18 nm. The thickness of the Zr film was 500 nm. The wavelength was calibrated using the absorption edge of the Zr film at 6.0 nm. The integration time of the X-ray CCD was 1 s.
With a voltage of 10 kV, the waveforms of the laser signal (black line), discharge voltage (blue line), and current (red line) are shown in Fig. 2. At 0 ns, the laser spot arrived on the surface of the liquid tin. Tens of nanoseconds after the laser peak, the voltage decreased and the current increased. The highest reverse voltage was about 6.25 kV and the peak current was about 1.2 kA. The whole process of discharge lasted about 13 μs. The figure only showed one cycle, which was about 4.4 μs.
Figure 2.Waveforms of the laser signal, discharge voltage, and current.
Because the inductance is the key factor influencing the discharge rising speed, it is important to know the discharge parameters. An RLC circuit[15] model was developed to obtain the equivalent resistance and inductance. The fitting curves of the current (green line) and voltage (yellow line) basically coincided with the experimental ones. The inductance was about 2.59 μH and the resistance was about 1.63 Ω. The inductance and resistance of the circuit were reduced slightly at higher discharge voltages for the plasma with a high density and temperature.
The ICCD camera was applied to record the process of discharge at 10 kV. The exposure time was set to 5 ns; 8 images with different delays shown by the arrows in Fig. 2 were chosen to show the dynamics of the discharge plasma shown in Fig. 3. During the laser pulse, the plasma expanded to the anode[16,17], as shown in Fig. 3(a). Under the influence of high voltage, after tens of nanoseconds delay, the discharge developed. As shown in Fig. 2(b), the voltage dropped while the current began to increase. The fastest expansion was in the normal direction due to the acceleration of the electric field, as shown in Fig. 3(b). With the increase of current, high density plasma formed near the cathode and anode, and two parts of the plume expanded and joined together, as shown in Fig. 3(c). A plasma column began to form, as shown in Fig. 3(d), and then the column expanded radially, as shown in Fig. 3(e). The variations of plasma shape depended on two forces, the magnetic contraction force and the thermal expansion force. With a further increase of current, the magnetic contraction force began to exceed the thermal expansion force. When the current approached the peak, a neck formed in the middle of the gap[10], as shown in Fig. 3(f). With the decrease of current, the density of the plasma was not high enough to support the column and first began to collapse from the middle of the gap, as shown in Fig. 3(g). Finally, the plume near the anode disappeared and then the plume near the cathode shrunk gradually, as shown in Fig. 3(h). The dynamics of the discharge plasma columns experienced the formation, the expansion, the contraction, and the dissipation.
Figure 3.Images of the laser-induced discharge plasma plume.
With the voltage of 10 kV, the spectra of the LDP EUV source with a liquid cathode (blue line) and a solid cathode (red line) are shown in Fig. 4. In our LDP experiment, the generation process of plasma could be divided into two phases: the laser produced initial plasma and the discharge produced plasma. In the first phase, the EUV was hard to detect, because the EUV of the LPP was mainly emitted in the normal direction to the cathode, so the EUV spectra mainly came from the second phase. The LDP spectra ranged from 13 to 14 nm. The profiles of the LDP spectrum with a solid tin cathode were almost the same, except that the intensity with the liquid cathode was a bit stronger than that with a solid one due to the reduction of target erosion.
Figure 4.Sn LDP spectrum versus the calculated spectrum.
A liquid droplet Sn LPP EUV source was set up in our previous work; the experimental device was described in Chen’s article[5]. For comparison, the same type of laser was used in the LPP. The spectrum of the LPP EUV source is shown in Fig. 5. The LPP spectrum ranged from 13 to 16 nm, which was much wider than the LDP spectra, and was concentrated at 14.0 nm. The intensity of the LDP spectrum was more concentrated at 13.5 nm.
Figure 5.Sn droplet LPP spectrum versus the calculated spectrum.
The COWAN code[18] was used to calculate the energy levels, radiation transition wavelengths, and probabilities of the Sn ions. Oscillator strength spectra of the resonant lines at different ion stages were achieved, as shown in Fig. 6. The UTAs (unresolved transition arrays) of that mainly contributed to the in-band emission were calculated.
Figure 6.Transition radiation spectra of the Sn ions.
With the collision radiation model proposed by Colombant and Tonon[19], the charge state populations under different electron temperatures and densities were calculated. By comparing the experimental results with calculated spectra under different conditions, the ranges of electron temperatures and densities were estimated.
Assuming an electron temperature of 20 eV and density of , the main ion populations were 11.6%, 47.1%, 36.9%, and 4.0%. At an electron temperature of 25 eV and density of , the main ion populations were 0.4%, 8.9%, 43.7%, 38.6%, 7.9%, and 0.4%. Considering Gauss broadening, the calculated spectra are shown in Figs. 4 and 5. They are similar to the LDP and LPP experimental spectra. The peaks, especially the one at 13.5 nm, were in good agreement. The temperatures in the LDP with the solid and liquid cathodes were almost the same. As shown in Fig. 6, with the increase of the ion charge, emission lines moved to the shorter wavelengths and became more concentrated around 13.2 nm[20]. The EUV spectrum in the liquid LDP experiment had more peaks below 13.5 nm, and the EUV spectrum in the liquid droplet LPP experiment had a peak at 14.2 nm, which meant that a higher temperature was achieved in the former. In the liquid droplet LPP, the and ions played an important role while the and dominated the in-band emission in the liquid LDP.
In this Letter, laser-induced liquid tin discharge plasma was investigated. The voltage-current characteristics were obtained at a laser energy of 145 mJ and a 7 mm discharge gap; by fitting the waveforms of current and voltage, the inductance and resistance of the discharge circuit were obtained. With the increase of voltage, the equivalent resistance and inductance were slightly reduced. The plume dynamics of the discharge plasma columns experienced the formation, the expansion, the contraction, and the dissipation.
The EUV spectrum of laser-induced liquid tin discharge plasma was obtained and compared with that of laser-produced solid tin plasma. Both plasmas had the same EUV spectral profile, while the intensity of liquid tin discharge plasma was slightly stronger. By comparing with the EUV of laser produced tin droplet plasma, we found that the LDP EUV had a stronger intensity and was more concentrated at 13.5 nm. The COWAN code was used to calculate the UTAs of ; the CR model was used to calculate the ion populations with different electron temperatures and densities, which helped to verify the correctness of the spectra. The LDP source with a liquid cathode had a higher EUV output and a longer lifetime than with the solid one.
References
[1] O. Wooda, C. S. Koay, K. Petrillo, H. Mizuno, S. Raghunathan, J. Arnold, D. Horak, M. Burkhardt, G. McIntyre, Y. Deng, B. L. Fontaine, U. Okoroanyanwu, A. Tchikoulaeva, T. Wallow, J. H.-C. Chen, M. Colburn, S. S.-C. Fan, B. S. Haran, Y. Yin. Proc. SPIE, 7271, 727104(2009).
[2] M. Kerkhof, H. Jasper, L. Levasier, R. Peeters, R. van Es, J. W. Bosker, A. Zdravkov, E. Lenderink, F. Evangelista, P. Broman, B. Bilski, T. Last. Proc. SPIE, 10143, 101430D(2017).
[3] E. Hotta, Y. Sakai, Y. Hayashi, G. Niimi, B. Huang, Q. Zhu, I. Song, M. Watanabe. International Conference on Optical and Photonic Engineering(2015).
[4] A. Endo. Conference on Lasers and Electro-Optics(2015).
[5] H. Chen, X. B. Wang, L. Duan, H. Lan, Z. Chen, D. Zuo, P. Lu. J. Appl. Phys., 117, 193302(2015).
[6] M. Benk, K. Bergmann. J. Micro-Nanolith. Mem., 11, 021106(2012).
[7] K. Koshelev, V. Y. Banine, V. Ivanov, G. Zukakishvili. Sematech EUVL Source Workshop(2002).
[8] V. M. Borisov, A. V. Eltsov, A. S. Ivanov, Y. B. Kiryukhin, O. B. Khristoforov, V. A. Mishchenko, A. V. Prokofiev, A. Y. Vinokhodov, V. A. Vodchits. J. Phys. D, 37, 3254(2004).
[9] M. Yoshioka, P. Zink, G. Schriever, M. Corthout. Proc. SPIE, 7140, 71401F(2008).
[10] P. Lu, S. Katsuki, N. Tomimaru, T. Ueno, H. Akiyama. Jpn. J. Appl. Phys., 49, 096202(2010).
[11] S. Lim, S. Kitajima, P. Lu, T. Sakugawa, H. Akiyama, S. Katsuki, Y. Teramoto. Jpn. J. Appl. Phys., 54, 01AA01(2015).
[12] G. A. Beyene, I. Tobin, L. Juschkin, P. Hayden, G. O’Sullivan, E. Sokell, V. S. Zakharov, S. V. Zakharov, F. O’Reilly. J. Phys. D, 49, 225201(2016).
[13] S. Lim, T. Kamohara, S. H. R. Hosseini, S. Katsuki. J. Phys. D, 49, 295207(2016).
[14] X. Q. Li. Research of 13.5 nm extreme ultraviolet radiation from tin plasma produced by laser-assisted discharge(2014).
[15] I. Tobin. Optical and EUV studies of laser triggered Z-pinch discharge(2014).
[16] T. He, C. Wei, Z. Jiang, Z. Yu, Z. Cao, J. Shao. Chin. Opt. Lett., 16, 041401(2018).
[17] Q. Shi, Y. Zhang, K. Wang, C. Wang, P. Zhao. Chin. Opt. Lett., 16, 121401(2018).
[18] R. D. Cowan. J. Opt. Soc. Am., 58, 808(1968).
[19] D. Colombant, G. F. Tonon. J. Appl. Phys., 44, 3524(1973).
[20] G. O’Sullivan, B. Li, R. D’Arcy, P. Dunne, P. Hayden, D. Kilbane, T. McCormack, H. Ohashi, F. O’Reilly, P. Sherdian. J. Phys. B, 48, 144025(2015).