Bo Xiong, Zhenhui Du, Lin Liu, Zheyuan Zhang, Jinyi Li, Qiling Cai. Hollow-waveguide-based carbon dioxide sensor for capnography[J]. Chinese Optics Letters, 2015, 13(11): 111201
Copy Citation Text
A sensor for capnography, based on a hollow waveguide (HWG) and tunable diode laser absorption spectroscopy (TDLAS), is presented; the sensor uses direct absorption spectroscopy and requires neither frequent calibration nor optical filters, giving it a significant advantage over existing techniques. Because of the HWG, the measurement achieved a concentration resolution of 60 ppm at a measurement rate of 25 Hz, as characterized by Allan variance. The length of the HWG was selected to efficiently suppress the optical fringes. This setup is perfectly suited for the detection of by capnography, and shows promise for the potential detection of other breath gases.
The technology of capnography, which involves monitoring carbon dioxide concentration during the process of breathing, has a great importance in the field of medical diagnostics[1–4]. The variations of the concentration within a single breath and the end-tidal () level are closely correlated with some diseases or physical conditions. Quantitative capnography requires not only noninvasive, real-time data collection but also a high precision of the measured concentration and good temporal resolution.
At present, the most common method of the detection of for capnography is nondispersive infrared spectroscopy (NDIR)[4,5]. The disadvantage of NDIR is that frequent calibration and different optical filters are required because the method is susceptible to variations in the light source and to background drift. Moreover, NDIR has difficulty distinguishing between absorption by the target gas and absorption by other gases, such as water vapor.
Gas sensors based on tunable diode laser absorption spectroscopy (TDLAS) have been widely used in industry and in scientific research[6–10]. Compared with NDIR, gas measurement based on TDLAS is more stable, more precise, and possesses excellent properties of selective spectrum absorption. However, most sensors based on TDLAS[8–10] are not suitable for capnography during exhalation because the gas cell usually has a large volume (more than 100 mL)[11,12]. Therefore, the exhalation gas from the human lung cannot renew the gas in the commonly used gas cells at a high enough rate to meet the requirements of high time resolution.
Sign up for Chinese Optics Letters TOC. Get the latest issue of Chinese Optics Letters delivered right to you!Sign up now
In 2014, Hartmann described a compact sensor based on TDLAS for capnography detection[13]. The sensor achieved a measurement rate of 30 Hz and a concentration resolution of 300 ppm using a small gas cell with a length of 2.5 cm. However, the presence of optical fringes was almost unavoidable in a device with such small dimensions[13,14], and this had a negative influence on the stability of gas detection, increasing the difficulty and complexity of the measurement. In addition, the short absorption path was not adequate for the detection of low concentrations of gas in the exhalation.
In the present work, a sensor for capnography based on TDLAS and a hollow waveguide (HWG) was developed. This sensor does not need frequent calibration thanks to the use of direct absorption spectroscopy, which is an absolute measurement method. The HWG has a small volume and a relatively long absorption path[15,16], which is important for precise measurement with good temporal resolution. In addition, the use of HWG causes the optical fringes to be suppressed. This setup is promising for use in precise capnography detection as well as the detection of other gases at a low concentration in the exhalation, such as , , and NO.
According to the Beer–Lambert law, when a laser beam with a frequency passes through a gaseous absorption medium, the intensity of the transmitted laser light can be written as Here is the incident laser intensity and is the gas absorption, which can be written as where is the absorption coefficient; is the gas concentration, i.e., the number of molecules per unit volume; and is the effective optical path length. From Eq. (1), the gas concentration can be measured by analyzing the transmitted laser intensity and the background signal, which is proportional to the incident laser intensity.
Most laser spectrometers suffer from the etalon effect, i.e., optical fringes caused by multiple reflections[17]. When a laser beam passes through plane-parallel surfaces, the optical fringes can be regarded as the fluctuations in the laser transmittance with respect to the laser frequency . In actual spectrometers, the reflectivity of the surface is sufficiently small and the fluctuation is sinusoidal, where is the width of the optical fringe in frequency, i.e., the free spectral range (FSR). The FSR can be written as where is the speed of light in a vacuum, is the distance between the surfaces, and is the refractive index of the medium.
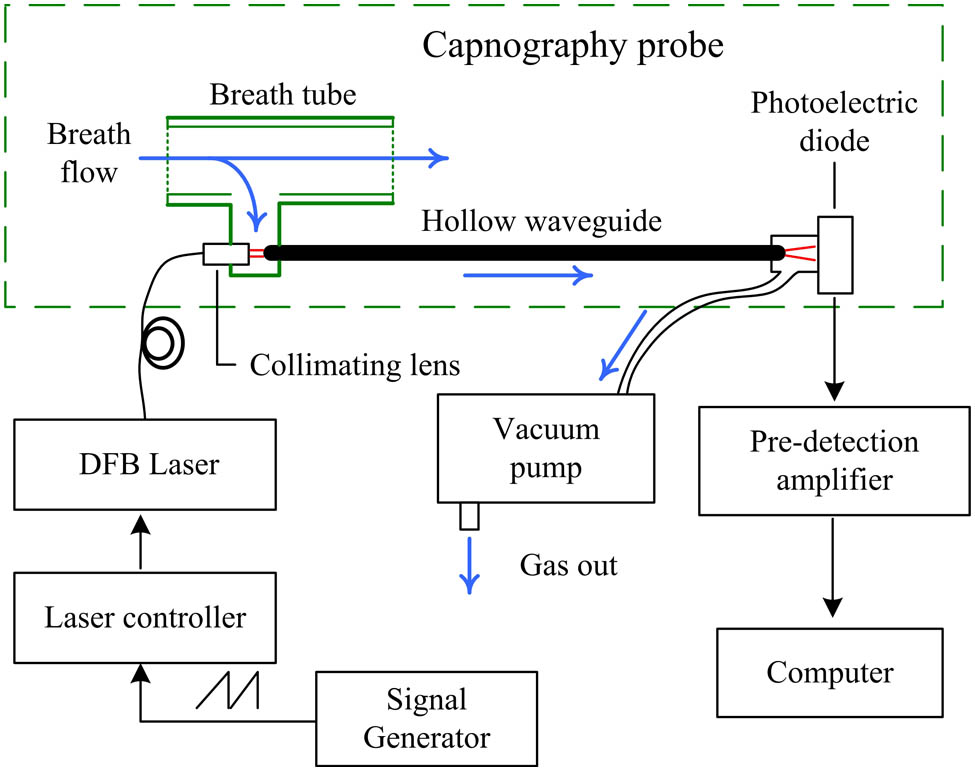
The experimental setup is depicted in Fig. 1. The capnography probe consists of a 12 cm-long HWG, a breath tube, and a photoelectric diode and mountings. The distributed feedback diode laser (Nanoplus, operating near 2004 nm) is driven by a laser controller (LDC3908). The frequency of the wavelength sweep is 200 Hz and the measurement result is averaged 8 times by a computer. As a result, the effective measurement rate is 25 Hz, i.e., the time resolution is 40 ms in theory. The inner diameter of the HWG is 1 mm; therefore, its volume is about . The breath gas is pumped into the HWG by a vacuum pump with a flow rate of more than 5 mL/s. This setup achieves a 50 Hz rate of change of gas in the HWG, which meets the demand for a 40 ms time resolution.
A absorption line at the wavelength of 2003 nm was selected, and the laser wavelength was scanned from 2002.88 nm to 2003.16 nm. According to the high-resolution transmission (HITRAN) database, the linewidth at half-maximum is 57.9 pm at 300 K and 1 atm. In the range of the wavelength scan, gas absorption is a factor of smaller than absorption in the exhaled gas; therefore, it can be ignored for the purposes of detection.
The absorption line and the background signal were measured while the laser wavelength was swept over an adequate range, and the absorption signal was derived from Eq. (1). Since direct tunable diode laser absorption spectroscopy is an absolute measurement method, the gas absorbance is measured accurately and is not influenced by the drift of the laser intensity; this means that the sensor does not need frequent calibration.
Optical fringes commonly appear in laser spectrometers, particularly in compact devices. In order to decrease the potential negative influence of optical fringes, the distances between the surfaces in the sensor were selected carefully. The distance between the PD window and collimating lens was about 125 mm (the gaps between the HWG, the PD, and the lens are included). From Eq. (4), plane-parallel surfaces separated by 125 mm should correspond to an optical fringe width of 16 pm, which is much narrower than the absorption linewidth. Such narrow potential optical fringes in the sensor can be suppressed efficiently by low-pass filters, line-shape fitting, or other algorithms.
Figure 2 shows the absorption signal averaged over the course of 40 ms while 4% was being pumped into the HWG. Here it can be seen that the absorption signal is close to 2003 nm. The measured absorption signal was processed by least-squares fitting to a standard absorption signal derived from the HITRAN database. Optical fringes with a width of 16 pm exist in the absorption signal as a result of reflections between the PD window and the collimating lens. Those fringes can be suppressed efficiently by line-shape fitting because their width is much narrower than the width of the gas absorption line itself.
Figure 2.Least-squares fitting of the measured absorption signal. (a) The measured signal (black line) and standard signal (red line). (b) The residual, i.e., the difference between the two curves in (a). Optical fringes with a width of 16 pm exist in the absorption signal as well as in the residual, and are therefore the result of reflections between the PD window and the collimating lens.
To validate the precision of the sensor, a constant concentration of 1% was delivered to the HWG continuously and we performed a detection experiment. Fig. 3 shows the measured concentration results of the least-squares fit on absorption signals with and without averaging. With averaging over 40 ms (8 sweeps), the sensor achieved a measurement rate of 25 Hz and the fluctuation of the measured concentration decreased to about 150 ppm.
Figure 3.Measurement results of 1% concentration during a 60 s interval. Measured concentrations with and without 40 ms average are shown by the red line and black line, respectively.
Allan variance is widely used to characterize the detection limit of spectrometers[17,18]. The measured concentration, characterized by the Allan variance, was investigated. Fig. 4 indicates that the sensor achieved a concentration resolution of 60 ppm, which corresponds to an absorption of , with a measurement rate of 25 Hz. This result is clearly sufficient for clinical applications. In addition, the detection limit reaches 10 ppm with the optimal integration time of 3 s. Therefore, the concentration resolution can be improved, if necessary, by reducing the time resolution, i.e., increasing the integration time.
Figure 4.Allan variance of measured concentration.
We performed a detection experiment using real breath cycles and the result is shown in Fig. 5. The time dependence of the measured concentration throughout the course of an exhalation is similar to that described in the literature[2,13]. The measured concentration decreases rapidly at the end of exhalation, which is consistent with the high time resolution of this sensor.
With the experimental results shown above, we have demonstrated two advantages of using a HWG instead of some other small-volume cell for the detection of breath gases. (i) HWG has a longer absorption path, which facilitates the detection of gases at low concentration. (ii) The optical fringes created in the HWG are more easily suppressed, since the length of the HWG can be selected flexibly to make the width of the optical fringes noticeably different from the gas absorption linewidth.
Figure 5.Measured concentration of in real breath cycles.
A sensor for capnography based on TDLAS and HWG has been designed, constructed, and tested. The sensor does not need frequent calibration or an optical filter, since the absorption line as well as the laser background is measured using direct absorption spectroscopy. Taking advantage of HWG, the measurement achieved a concentration resolution of 60 ppm at a measurement rate of 25 Hz. This setup is well-suited for the detection of by capnography as well as being potentially useful for the detection of other breath gases.
Bo Xiong, Zhenhui Du, Lin Liu, Zheyuan Zhang, Jinyi Li, Qiling Cai. Hollow-waveguide-based carbon dioxide sensor for capnography[J]. Chinese Optics Letters, 2015, 13(11): 111201