Yang Liu, Yue Tong, Suyu Li, Ying Wang, Anmin Chen, Mingxing Jin. Effect of sample temperature on laser-induced semiconductor plasma spectroscopy[J]. Chinese Optics Letters, 2016, 14(12): 123001
Copy Citation Text
We investigate the temperature dependence of the emission spectrum of a laser-induced semiconductor (Ge and Si) plasma. The change in spectral intensity with the sample temperature indicates the change of the laser ablation mass. The reflectivity of the target surface is reduced as the sample is heated, which leads to an increase in the laser energy coupled to the surface of the sample and eventually produces a higher spectral intensity. The spectral intensities are enhanced by a few times at high temperatures compared with the cases at low temperatures. The spectral intensity of Ge is enhanced by 1.5 times at 422.66 nm, and 3 times at 589.33 nm when the sample temperature increases from 50°C to 300°C. We can obtain the same emission intensity by a more powerful laser or by less pulse energy with a higher sample temperature. Based on experimental observations we conclude that the preheated sample can improve the emission intensity of laser-induced semiconductor plasma spectroscopy.
Laser-induced breakdown spectroscopy (LIBS), also known as laser-induced plasma spectroscopy (LIPS), is an analytical technique originally proposed by Brech and Cross in 1962 and recently has been used by a number of researchers[1]. In this technique, a focused pulsed laser creates intense plasma on the sample surface. The sample surface is heated by the pulsed laser and a small quantity of the material is evaporated. Since the plasma is produced by optical radiation, LIBS exhibits a great advantage over other techniques in the ability to analyze at a remote distance. This property gives LIBS the capability of real-time analysis in industrial environments[2,3]. We can use one or more high-power pulsed lasers to generate a laser induce plasma from a solid[4,5], liquid[6,7], or gaseous[8] sample. Furthermore, only light transmission from a sample is necessary for elemental analysis, for example, analysis of difficult-to-reach or dangerous samples, such as the extremely harsh environments and hazardous materials[9,10], as well as for high-resolution spatial image mapping. In the LIBS technique, increasing the signal intensity is very important. A variety of methods like time-resolved LIBS[11,12], double-pulse LIBS[13–15], applying electric and magnetic fields[16,17] have been applied for this purpose. An alternative method is to change the initial temperature of the sample. A lot of studies have been reported that discussed the ultrafast laser-induced microstructure and nanostructure formation on material surfaces by changing the environmental conditions[18,19]. A large number of reports studied the laser ablation as a function of pulse duration[20–22]. On the other hand, less studies have been reported on the influence of temperatures on the laser-induced ablation of materials[23,24]. The studies of the influence of sample temperature on the emission spectra concentrate on metal materials, slag, or melts of glass materials[3,25,26]. However, few research has been devoted to the semiconductor materials. A few studies on semiconductor materials focused on the temperature-dependent ablation threshold[27,28]. Eschlboch-Fuchsa et al. studied the influence of sample temperature on expansion dynamics and optical emission[29]. They suggest that the plasma expansion in air and the cross-sectional areas of the plasma plume have a significant change with the heating sample temperature.
In this Letter, the effect of the sample temperature on the plasma emission from a germanium wafer and a silicon wafer in air at atmospheric pressure has been investigated using a nanosecond laser. We ablate different wafers using 10 ns laser pulses at wavelengths of 1064 nm. The sample is uniformly heated from room temperature up to 300°C by a heating element. Spectral lines of the sample under different laser energies and sample temperatures are measured. The LIBS shows that there is a noticeable difference between the plasma emission at room temperature and that at a higher sample temperature. Higher energy of the pulsed laser leads to an enhancement in the emission intensity of the spectral line. Similar enhancement also is observed when the sample is heated up to a higher temperature. We speculate that increasing the laser intensity and the sample temperature can produce a large amount of ablated materials[30]. In order to understand these characteristics we investigate different semiconductor materials (germanium and silicon) and a similar conclusion is obtained.
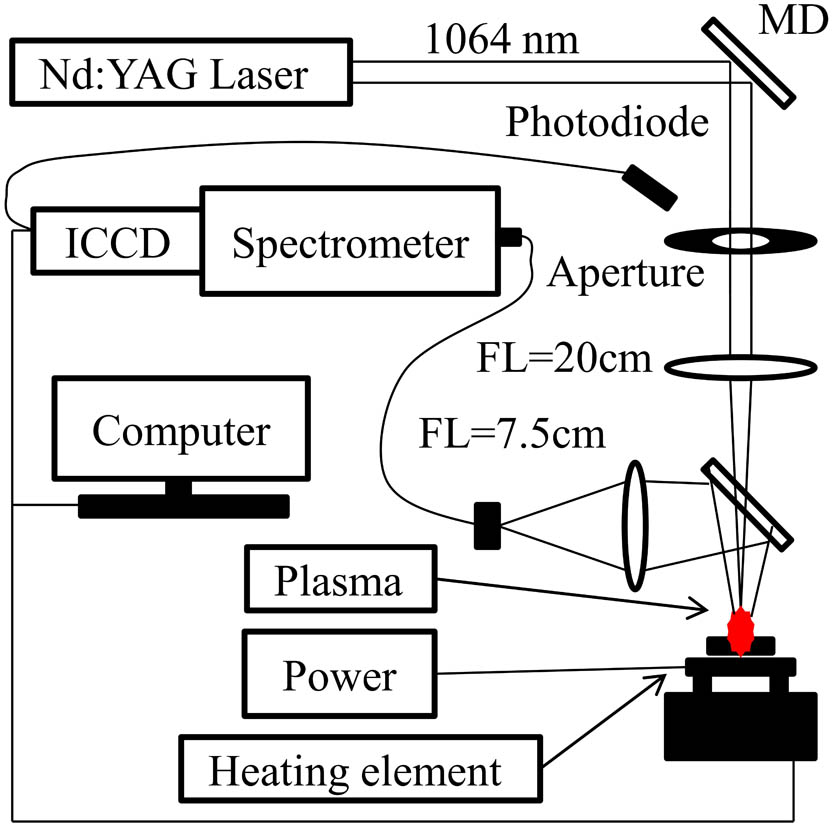
An LIBS system consists of a pulsed laser, optics, a sample stage, asignal detection and acquisition system, and trigger control. As shown in Fig. 1, an Nd:YAG laser (Continuum, Surelite) with a pulse width of 10 ns at a wavelength of 1064 nm operating at a repletion rate of 2.5 Hz is used in the experiment. The laser beam is focused by a quartz lens with focal length of 20 cm onto the surface of a heated germanium or silicon sample. The sample surface is perpendicular to the incident laser beam and is attached to a heating element underneath. In order to avoid the air breakdown, the focal point of the laser pulse is below the target surface. We estimate the laser spot diameter size of 500 μm by the crater size. This heating element is mounted on a computer-controlled three-dimensional () stage (Thorlabs, PT3/M-Z8). The sample can be heated up to 350°C by the heating element. The temperature is measured by a thermometer fastened to the back of the sample. The light signal is coupled to a spectrometer (Spectra Pro 500, PI Acton, the grating is 1200 grooves per mm) through an optical fiber and then is detected by an intensified charge-coupled device (ICCD, Princeton Instruments, PI-MAX4) camera with a resolution of pixels. A photodiode is connected to the ICCD to ensure the synchronization of data collection.
Sign up for Chinese Optics Letters TOC. Get the latest issue of Chinese Optics Letters delivered right to you!Sign up now
Figure 1.Schematic of the experimental setup. FL is a lens.
The spectra are measured as a function of temperature at a step of 50°C. At a given temperature, a germanium wafer sample is irradiated at four different pulse energies, e.g., , 7.3, 11.7, and 16.0 mJ. In order to find an optimum delay time for the best signal-to-noise ratio (S/N) in LIBS experiments, the gate delay time is set at 500 ns for each pulse energy. The gate width of the ICCD detector is set at 1000 ns. Each spectrum is an average of 15 laser pulses. For comparison, the similar experiment also is done with a silicon wafer sample at different pulse energies (, 8.5, and 20.3 mJ).
During the interaction of sample materials with the nanosecond laser pulses, the time to heat the electrons and lattice is much shorter than the pulse duration; the ionization process is affected by the heating effect, i.e., melting and vaporization. The properties of the laser-induced plasma depend on the laser pulse parameters and sample conditions (type of sample and its temperature). The change in LIBS intensity can qualitatively describe the characteristics of the plasma emission to some extent. Figure 2 shows the emission spectra of germanium at 422.66 and 589.33 nm at two different pulse energies (7.3 and 16 mJ) and three temperatures (25°C, 150°C, and 300°C). Since the variation trend of the spectral emission and the analysis results are similar, we only focus on the spectral lines of 422.66 and 589.33 nm. The results of the analyzed two germanium lines are also similar. We measure the emission spectra by heating the sample temperature from the room temperature of 25°C to 300°C, and change the energy of the laser pulse. It can be seen that the emission spectra are significantly enhanced when the energy of laser pulse is higher or at higher sample temperatures. The increase in the initial sample temperature leads to the increase in the emission intensity of the LIBS, which may lead to a more exact analysis of the sample composition.
Figure 2.LIBS at 422.66 and 589.33 nm lines of the Ge wafer for sample temperatures of 25°C, 150°C, and 300°C, and laser pulse energies of 7.3 and 16 mJ.
When the samples are subject to laser irradiation, due to the high power within a very short time a lot of energy is released and the high-density plasma is vaporized instantly on the material surface. Assuming that the plasma is in local thermal equilibrium (LTE) conditions, the intensity of an emission line can be expressed by the equation[4]where is the element of concentration in the plasma, is the maximum amount of material evaporated in the plasma plume, is the spectral energy level degeneracy (statistical weight), is the transition probability, is Planck’s constant, is Boltzmann’s constant, is the partition function, is the upper level energy, and is the plasma temperature. The equation shows that two factors affecting the spectral emission intensity are the electron temperature and the free atoms in the plasma[30]. The quantity of free atoms depends on the density of elements and the total mass of ablation in the plasma, and the density is determined by the sample material. The maximum amount of material that could be vaporized is expressed as[31]where is the specific heat, is the boiling temperature, is the initial temperature of the sample, and is the latent heat. represents the laser energy coupled to the sample, denotes the laser energy per pulse, and denotes the reflectivity of the target. According to the above equation, the partial reflectivity of the target determines the fraction of the coupled laser energy (). The reflectivity of the metal or semiconductor wafer generally decreases with increasing temperature; this characteristic can be expressed to a good approximation by the linear relation[30,32]where is the reflectivity at room temperature (), is the sample temperature, and is a constant. Obviously, is continuous function of temperature; the sample temperature influences the laser energy coupled to the sample, the maximum amount of the material, and the intensity of emission lines. According to Eq. (3), the reflectivity of the target is reduced by the increase in the sample temperature, which leads to an enhancement of laser energy coupled to the sample and the maximum amount of evaporated material [from Eq. (2)]. As a consequence, the intensity of the emission lines is boosted [from Eq. (1)] leading to a higher amplitude of the characteristic peak. The reflectivity decreases with an increase of the sample temperature, which can contribute to a larger laser energy coupled to the sample and thus to a higher spectral intensity. It can be seen from Fig. 2, at the laser energy of 7.3 mJ, the spectral intensity is enhanced by 1.5 times at 422.66 nm, and 3 times at 589.33 nm when sample temperature increases from 50°C to 300°C. Figure 3 shows the emission intensity as a function of the sample temperature. It can be seen that the spectral intensities change with different sample temperatures and laser energies for the Ge sample. At a fixed laser intensity, the spectral emission intensity shows a linear increase with an increase in the sample temperature for the line at 589.33 nm. This behavior is based on the temperature dependence of the reflectivity. For the line at 422.66 nm, with a laser energy of 16.0 mJ, the increase of the spectral peak intensities is slower after 200°C, and the maximum is reached at . This is probably because the reflectivity no longer decreases approaching the minimum. The spectral intensity increases with the increase of the sample temperature, and then almost remains constant. Together with the laser energy dependence of the plasma emission seen in Fig. 2, we infer that to improve the laser ablation rate one should increase the laser power or increase the sample temperature. We can obtain the same emission intensity by a more powerful laser or by less pulse energy with a higher sample temperature. For example, the spectral intensity at and is almost equal to that at and .
Figure 3.Temperature dependence of the emission intensity of Ge at (a) 422.66 and (b) 589.33 nm with laser energies of 3.2, 7.3, 11.7, and 16.0 mJ.
In addition, the ambient air close to the heated sample probably leads to a reduced density that results in an increase of the plume size. Therefore, the expansion dynamics and the optical emission of the laser-induced plasma are also affected by the sample temperature. The heated target will lead to a temperature gradient of the ambient air, which will lead to air convection and turbulence. The higher the temperature close to the surface of the target the more greatly the molecular thermal motion is enhanced. When the sample is irradiated by a laser beam, the air convection and turbulence enhance the heat transfer and reaction process, which increases the expansion of the plasma. In order to quantitatively analyze the plasma expansion dynamics with additional effects, we have to pay attention to temperature gradients near the sample surface, and air convection and turbulences. According to the kinetic gas equation, the operation relation between the radius where the spherical shock wave expansion stops and the sample temperature can be expressed as[29]. When the sample is heated from to , the cross-sectional plume area is expected to enlarge by the factor . Therefore, we infer that the increase of the sample temperature provides a method to increase the emission that may produce more ablation mass[33]. It should be noted that those values should be considered semiquantitatively because the depth of the craters in the heated sample is difficult to measure in the experiment.
In the experiment, we also use a Si wafer as the target sample and measure the LIBS at different sample temperatures. The variation of the spectral intensity with the increase of the sample temperature is similar to the observed results in the case of Ge. We pay attention to the spectral lines at 390.55 and 634.71 nm. As shown in Fig. 4, the intensity of the spectral line at 390.55 nm is very strong when the temperature is above 200°C, and the spectral emission is so strong that the spectrometer is saturated. Figure 5 shows the intensity of the spectral peak as a function of the sample temperature. As the target temperature increases from 25°C to 300°C, the spectral intensity is significantly enhanced. Furthermore, at a higher laser intensity, the temperature dependence of the spectral intensity is more pronounced. The spectral intensity of 8.5 mJ laser energy and a 300°C target temperature is almost equal to that of 20.3 mJ laser energy and a 25°C target temperature. At the laser energy of 20.3 mJ, the spectral intensity is enhanced by a factor of 1, 1.5, and 6.5 as the sample is heated from room temperature 25°C to 100°C, 200°C, and 300°C, respectively. The above analyses show similar results for using a Ge wafer.
Figure 4.LIBS at the 390.55 and 634.71 nm Si lines; the sample temperatures are 25°C, 150°C, and 300°C, and the laser pulse energies are 8.5 and 20.3 mJ.
Figure 5.Effect of the sample temperature on the emission intensity of the (a) 390.55 and (b) 634.71 nm lines of Si; the laser energies are 3.2, 8.5, and 20.3 mJ. Error bars correspond to the standard deviation of fifteen measurements of averaged values.
In conclusion, the effect of the sample temperature on plasma emission from a Ge and Si wafer is experimentally investigated. We measure the LIBS under different conditions, e.g., at different laser irradiation intensities and sample temperatures. It is found that the increase of the sample temperature can lead to the increase of the spectral intensity, indicating an efficient laser ablation at higher sample temperatures. The reflectivity of the target surface is reduced by heating the samples, which could lead to a better laser energy coupled to the sample resulting in a higher spectral intensity. The temperature gradients close to the sample surface give rise to the air convection and turbulence leading to a massive plasma production and an increase in the spectral intensity. Therefore, we conclude that for laser-induced plasma different combinations of sample temperatures and laser intensities can be used to achieve similar plasma production.
References
[1] F. Brech, L. Cross. Appl. Spectrosc., 16, 59(1962).
Yang Liu, Yue Tong, Suyu Li, Ying Wang, Anmin Chen, Mingxing Jin. Effect of sample temperature on laser-induced semiconductor plasma spectroscopy[J]. Chinese Optics Letters, 2016, 14(12): 123001