Abstract
The excessive exposure to high concentrations of fluoride in drinking water can lead to a serious disease called fluorosis. The upstream region of the Yongding River is an ecological protection area for Beijing. Some studies have reported that there is a high concentration of fluoride in the groundwater in this area. However, there are few data on the distribution of fluoride in surface water and health risk assessments in this area. In this study, the fluoride concentrations were determined by using the spectrophotometric method using data from 2013 to 2017 from 9 surface water quality monitoring stations in the upper reaches of the Yongding River. The health risks of fluoride were assessed using the approach developed by the United States Environmental Protection Agency (US EPA). The results indicated that the fluoride content in the drinking water ranged from 0.30 to 1.50 mg L-1, with an average of 0.86 mg L-1. In total, 22.7% of the analyzed samples exceeded the Chinese limit of 1.0 mg L-1 for fluoride, and 5.5% of samples had less than the permissible limit of 0.5 mg L-1. Higher fluoride concentrations and fluorosis hotspots were found to be predominately located downstream of the Yanghe River close to the Guanting Reservoir, where 71.4% of samples exceeded the limit of 1.0 mg/L-1. The spatial distribution of high fluoride concentrations was found to be primarily determined by industry. The hazard quotient (HQ) index for children, teenagers and adults indicated that 19.6%, 15.6%, and 5.1% of the samples in the upper reaches of the Yongding River, respectively, posed health hazards to the associated groups. Furthermore, the HQ index more than 1 for children, teenagers and adults had values of 64.3%, 56.1%, and 19.4%, respectively, in samples from the downstream region of the Yanghe River. Therefore, there are potential risks of dental and skeletal fluorosis in the upper river reaches of the Yongding River. It is imperative to take measures to reduce the fluoride pollution in surface water and control fluorosis. Action should be taken to improve the disposal of industrial waste.1 Introduction
Fluoride is widely distributed in nature and is considered a necessary compound for human health, with a guideline indicating a moderate amount of fluoride intake (Ayoob and Gupta, 2006). However, excessive exposure to high concentrations of fluoride in drinking water can lead to a serious disease called fluorosis, which is categorized as a skeletal and dental disease (Li et al., 2017; Abiye et al., 2018). It has been reported that 200 million people in 25 countries worldwide had an excessive fluoride intake and were under the threat of fluorosis in 2004 (Wambu et al., 2014; Mohammadi et al., 2017; Azhdarpoor et al., 2018; Emenike et al., 2018). Therefore, in 2011, the World Health Organization (WHO) indicated that the guideline value for fluoride in drinking water should not exceed 1.5 mg L-1 (WHO, 2011). Specifically, the WHO permissible limit of fluoride was reduced from 1.5 to 1.0 mg L-1 due to prevalent endemic fluorosis in India and China (Ayoob and Gupta, 2006; Li et al., 2009; Zhang et al., 2017; Yadav et al., 2019).
Spatial and temporal dynamics of fluoride in drinking water can contribute to dealing with problems for improving drinking water quality (Li et al., 2019). Many studies have reported the spatial and temporal distributions of fluoride contamination in groundwater worldwide (Ayoob and Gupta, 2006; Suthar et al., 2008; Ali et al., 2016; Zhang et al., 2017; Ali et al., 2019; Yadav et al., 2019). For example, Ali et al. (2016) investigated the spatial distribution of fluoride contamination in groundwater in the world and indicated that there was a serious issue of fluoride contamination in groundwater in India, China, Ethiopia, Kenya and Argentina. Many studies on fluoride contamination in groundwater in China have also been presented (Lin et al., 2004; Ni et al., 2010; Xiao et al., 2015; Zhang et al., 2017). Xiao et al. (2015) studied the spatial variability of fluoride and its geochemical control with other dissolved ions in the middle Loess Plateau. Chen et al. (2012) investigated the spatial and temporal variation in fluoride content in groundwater using a geographic information system (GIS), which is one of the suitable tools for displaying the spatial and temporal distribution of drinking water quality, in Yuanmou County, Southwest China. Furthermore, many studies have reported the presence of fluoride in several surface water bodies, such as lakes and rivers, throughout the globe and have found that fluoride concentrations in most rivers were generally below 1.5 mg/L (Ali et al., 2016).
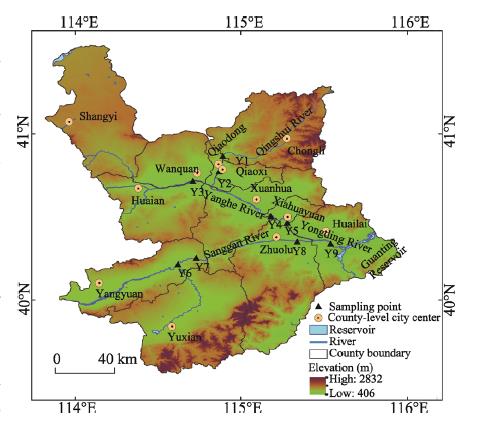
The upstream region of the Yongding River is an ecological protection area for Beijing, and the watershed area drains into Guanting Reservoir (Figure 1). The reservoir is a backup drinking water source for Beijing during water shortages and has a storage capacity of 4.16 billion m3 (Guo et al., 2014; Yang et al., 2019). Thus, efforts should be made to ensure good water environmental conditions in Guanting Reservoir (Wang et al., 2018). Some studies have reported that there is a high concentration of fluoride in the groundwater in this area (Lin et al., 2004; Li et al., 2017; Zhang et al., 2017; Li et al., 2019). Li et al. (2017) found that the groundwater fluoride concentrations ranged from 0.18 to 5.59 mg/L and that approximately 63% of the groundwater fluoride samples exceeded the WHO guidelines for drinking water (1.5 mg/L) in North China. However, there are few data on the fluoride concentrations in surface water in this area (Zhang and Che, 2008; Wang et al., 2010).

Figure 1.
Distribution of sampling points in the upper reaches of the Yongding RiverA health risk assessment is a useful tool to estimate the probability of adverse health effects in humans who may be exposed to chemicals in contaminated water, either now or in the future (Yousefi et al., 2018). The method has been applied in different studies of health risk evaluations for fluoride pollution in groundwater (Zhang et al., 2017; Emenike et al., 2018; Samuel et al., 2018; Li et al., 2019; Yousefi et al., 2019). In this study, a health risk assessment was performed to estimate the probability of adverse health effects from fluoride exposure in surface water on human health in the upper reaches of the Yongding River. The objectives of this research were to (1) provide a comprehensive description of the spatial-temporal variation in the fluoride concentration in the upper reaches of the Yongding River and (2) estimate the human health risk attributed to fluoride intake for infants, children, teenagers and adults.
2 Materials and methods
2.1 Study area
This study was conducted in the Zhangjiakou area, which is located in the upper reaches of the Yongding River (39°30°N-42°10°N, 113°50°E-116°30°E) at an altitude from 500 m to 800 m in Hebei Province, China. It covers an area of 36,796 km2, consisting of 25.3% of arable land, 29.9% of forest land, and 28.8% of grassland with a population density of 120 people/km2. It falls into the category of typical continental arid and semiarid areas, characterized by a temperate monsoon climate with an annual mean temperature of 6℃-8℃ and an annual average precipitation of 393.2 mm. Approximately 70%-80% of the annual precipitation occurs from June to September.
The upstream region of the Yongding River is an ecological protection area for the city of Beijing, and its tributaries include the Yanghe River and Sanggan River in the Zhangjiakou area. The Yanghe River is an important receiver of polluted water generated in the Zhangjiakou area. The total length of the Yanghe River in the Zhangjiakou area is 106 km. The Qingshui River is one of the major tributaries of the Yanghe River, and it has a total length of 82 km, a river width of 7-22 m and a depth of 0.5-2.3 m, and most of the beaches are used for farming. In 2022, the Winter Olympic Games will be held in a county (Chongli) located upstream of the Qingshui River. The total length of the Sanggan River in the Zhangjiakou area is 157 km. After the Yanghe River and the Sanggan River converge, the river segment is called the Yongding River, which flows into Guanting Reservoir.
2.2 Determination of fluoride concentration in water
In this study, a total of 393 samples were taken from 9 water sampling points from 2013 to 2017 (Figure 1). The distribution of sampling points in the upper reaches of the Yongding River is shown in Figure 1. There were 2 sampling points in the Qingshui River (Y1: upstream, Y2: downstream); 3 sampling points in the Yanghe River (Y3: upstream, Y4 and Y5: downstream); 3 sampling points in the Sanggan River (Y6 and Y7: upstream, Y8: downstream); and one in the Yongding River (Y9). Three duplicate samples were collected once per month (except during the freezing months) from every sampling point. All samples were collected in clean polythene bottles. Samples were in lab filtered through 0.22 μm nylon filters to remove the particles before analysis. The samples were then transported to the laboratory, stored at 4℃ and analyzed within 48 h after sampling. The fluoride concentration of the samples was determined using ion chromatography (Li et al., 2017). Repeated analyses were carried on in order to demonstrate reproducibility within 2% (Xiao et al., 2015).
We used the kriging interpolation method to determine the spatial distribution of the fluoride concentrations in the upper reaches of the Yongding River.
2.3 Health risk assessment
The artificial fluoridation of water supplies recommended by the WHO is 0.5-1.0 mg L-1 (WHO, 2011). Dental fluorosis can be generated when the fluoride concentration is above 1.5 mg L-1, and much higher fluoride concentrations lead to skeletal fluorosis (WHO, 2011). However, fluoride can have an adverse effect on tooth enamel and may lead to mild dental fluorosis at drinking water concentrations between 0.9 and 1.2 mg L-1; the effects are based on drinking water intake and exposure to fluoride from other sources (WHO, 2011). Therefore, the threshold value of fluoride in the Chinese drinking water standard is 1.0 mg L-1 (Chinese Standards for Drinking Water Quality, GB5749-2006). The fluoride concentration data collected in this work were included in the final health risk assessment according to the Chinese drinking water standard.
The hazard quotient index (HQ) was used to assess the noncarcinogenic potential of the health risk assessment of fluoride in this study (Yousefi et al., 2018). The health risk assessment of fluoride in surface water was performed according to US EPA guidelines (Yousefi et al., 2019). We divided the population into four age groups based on water consumption and body weight as follows: infants (less than 2 years), children (2 to <6 years), teenagers (6 to <16 years), and adults (>16 years). The estimated daily intake (EDI) of fluoride was calculated in these groups using Eq. (1):
where Cf is the daily average consumption of drinking water, and Cd is the fluoride concentration in drinking water. Bw is the body weight. The unit of BDI is mg kg-1 day-1. The average water consumption in infants, children, teenagers, and adults was 0.08, 0.85, 2 and 2.5 L day-1, respectively. Body weight of infants, children, teenagers, and adults was selected as 10, 15, 38, and 60 kg, respectively, for China (RGPFHCS, 2012). The HQ can be calculated by using Eq. (2):
where RfD is the reference dose of daily human exposure. The reference dose of fluoride in this study was 0.06 mg kg-1d-1, which was obtained from the database of the Integrated Risk Information System, US EPA (Yousefi et al., 2019). If the HQ is less than 1, there is no health risk to consumers. If the HQ is higher than 1, it indicates that the noncarcinogenic health risk assessment exceeds “the acceptable level” and could damage human health.
2.4 Statistical analysis
Statistical analyses were conducted using the SPSS 19 software package (SPSS, Chicago). Multiple comparisons were carried out by analysis of variance (ANOVA) to identify significant differences between the different regions (LSD, P<0.05).
3 Results
3.1 Fluoride concentration in surface water
Table 1 shows the fluoride concentrations in the study area. In general, the fluoride concentrations ranged from 0.30 to 1.50 mg L-1, with an average value of 0.86±0.27 mg L-1. The average fluoride concentration was lower than the Chinese drinking water standard (1.0 mg L-1). However, the average fluoride concentration in the downstream stretch of the Yanghe River (sampling points: Y4, Y5) was higher than 1.0 mg L-1. There were significant differences in the fluoride concentrations of different rivers (Table 1). The average concentrations of fluoride in the Yanghe River and Yongding River were higher than the concentrations in the Qingshui River and Sanggan River.
| River | Samplingsite | Samplenumber | Fluoride concentration (mg L-1) | SD | Frequency (%) |
|---|
| Maximum | Minimum | Mean | <0.5 mg L-1 | 0.5-1.0 mg L-1 | >1.0 mg L-1 |
|---|
| Qingshui River | Y1 | 37 | 0.97 | 0.42 | 0.71d* | 0.11 | 2.7 | 97.3 | 0 |
| Y2 | 38 | 1.17 | 0.43 | 0.72d | 0.13 | 7.9 | 89.5 | 2.6 |
| Yanghe River | Y3 | 33 | 1.10 | 0.59 | 0.83bc | 0.13 | 0 | 84.9 | 9.1 |
| Y4 | 49 | 1.50 | 0.43 | 1.18a | 0.29 | 2.0 | 26.5 | 71.4 |
| Y5 | 49 | 1.49 | 0.32 | 1.13a | 0.29 | 2.0 | 30.6 | 67.4 |
| Sanggan River | Y6 | 44 | 0.86 | 0.30 | 0.58e | 0.13 | 29.6 | 70.5 | 0 |
| Y7 | 45 | 1.47 | 0.46 | 0.82c | 0.18 | 2.2 | 88.9 | 8.9 |
| Y8 | 48 | 1.13 | 0.46 | 0.76cd | 0.13 | 2.1 | 95.8 | 2.1 |
| Yongding River | Y9 | 50 | 1.45 | 0.38 | 0.90b | 0.20 | 2.0 | 74.0 | 24.0 |
Table 1.
Fluoride concentration and frequency in the studied regions
Table 1 also shows the frequency of different fluoride concentrations in the study area. In general, 282 of the samples (71.8%) were in the range of 0.5-1.0 mg L-1, 5.5% of the samples had values lower than the permissible limit of 0.5 mg L-1, and 22.7% of the samples had values that exceeded 1.0 mg L-1. Although 9.1% of the samples had values greater than 1.0 mg L-1 in the upstream reach of the Yanghe River, 71.4% and 67.4% of the samples had values greater than 1.0 mg L-1 downstream of the Yanghe River. Only 2.6% of the samples downstream were greater than 1.0 mg L-1 in the Qingshui River. In the Sanggan River, only 8.9% and 2.1% of the samples upstream and downstream, respectively, were greater than 1.0 mg L-1. However, 29.6% of the samples were lower than the WHO standard (0.5 mg L-1).
3.2 Temporal variation in fluoride concentrations
The seasonal variations in the fluoride concentrations between different rivers can be seen in Figure 2. The concentrations of fluoride in the Qingshui River did not vary significantly from January to December (Figures 2a and 2b). However, there were significant seasonal variations in the concentrations of fluoride in the Yanghe River. In general, the concentrations of fluoride in July were higher than the concentrations of the other months in the upstream region of the Yanghe River, while higher concentrations of fluoride were observed from April to June (Figures 2c-2e). In contrast to the tributaries, lower concentrations of fluoride were found from July to September, although there was significant seasonal variation in the Yongding River (Figure 2i).
Figure 2.
Seasonal changes in the average concentrations of fluoride in different rivers: (a) upstream of Qingshui River; (b) downstream of Qingshui River; (c) upstream of Yanghe River; (d) downstream of Yanghe River; (e) downstream of Yanghe River; (f) upstream of Sanggan River; (g) upstream of Sanggan River; (h) downstream of Sanggan River; (i) Yongding RiverAnnual variations in the concentrations of fluoride in the Zhangjiakou area in the upper reaches of the Yongding River were investigated over a long time scale. Individual yearly comparisons between different rivers can be seen in Figure 3. The concentrations of fluoride in the Qingshui River decreased gradually from 2014 to 2017, being the highest in 2014 and were the lowest in 2017 (Figure 3a). Although the concentrations of fluoride in the upstream region of the Yanghe River did not vary significantly from 2013 to 2017, there was a gradual significant decline in the downstream stretch of the Yanghe River. The concentrations of fluoride in the downstream stretch of the Yanghe River were the lowest in 2016 (Figure 3b). Moreover, there were significant variations in the concentrations of fluoride in the upstream region of the Sanggan River from 2013 to 2017 (Figure 3c). However, the concentration of fluoride in 2017 was higher than the concentration in 2016 (Figure 3d).
Figure 3.
Annual variations in the average concentrations of fluoride in different rivers3.3 Spatial variation in fluoride concentrations
In addition to the temporal variations in fluoride concentrations, we investigated the spatial variations in fluoride concentrations across the Zhangjiakou area in the upper reaches of the Yongding River. The spatial distributions of the fluoride concentrations were mapped from 2013 to 2017 (Figure 4). Generally, the higher concentrations of fluoride were distributed in the downstream region of the Yanghe River (Xuanhua, Xiahuayuan), where the high density of industrial activity easily polluted the surface water. The lower concentrations of fluoride were mainly distributed in the upstream region of the Yanghe River (Shangyi, Huaian, and Wanquan), Qingshui River (Chongli) and Sanggan River (Yangyuan, Yuxian) (Figure 4).
Figure 4.
Spatial variations in fluoride concentration from 2013 to 2017 in the upper reaches of the Yongding River3.4 Risk assessment of fluoride
The HQ associated with fluoride concentration on different age classifications (0-2 years, 2-6 years, 6-16 years, and >16 years) was calculated according to the US EPA guidelines (Yousefi et al., 2018). The HQ values for the different age classifications are presented in Table 2 and Figure 5. The hazard quotient index for children, teenagers and adults indicated health hazards in 19.6%, 15.6%, and 5.1% of the samples from the upper reaches of the Yongding River, respectively. The mean HQ values in the study area ranged from 0.08 to 0.16 for age 0-2 years. The mean HQ values for age 2-6 years varied from 0.54 to 1.12 in the study area. The mean HQ values for age 6-16 years varied from 0.50 to 1.04 in the study area. The mean HQ for age >16 years varied from 0.40 to 0.82 in the study area (Table 2). The highest HQ values were found for age 2-6 years, while the lowest HQ values were found for 0-2 years in the study area (Figure 5). Furthermore, there were significant differences between the HQ values in different rivers. The HQ values in the downstream region of the Yanghe River were higher than the values in the other rivers (Table 2).
| River | Sampling site | Sample number | Infants | Children | Teenagers | Adults |
|---|
| HQ | Frequency (%)** | HQ | Frequency (%) | HQ | Frequency (%) | HQ | Frequency (%) |
|---|
Qingshui
River | Y1 | 37 | 0.10±0.01c* | 0 | 0.67±0.10d | 0 | 0.63±0.09d | 0 | 0.50±0.07d | 0 |
| Y2 | 38 | 0.10±0.02c | 0 | 0.68±0.12d | 2.6 | 0.63±0.11d | 2.6 | 0.50±0.09d | 0 |
Yanghe
River | Y3 | 33 | 0.11±0.02b | 0 | 0.78±0.12bc | 6.1 | 0.73±0.12bc | 0 | 0.57±0.09bc | 0 |
| Y4 | 49 | 0.16±0.04a | 0 | 1.12±0.28a | 63.3 | 1.04±0.26a | 57.1 | 0.82±0.20a | 26.5 |
| Y5 | 49 | 0.15±0.04a | 0 | 1.07±0.28a | 65.3 | 1.00±0.26a | 55.1 | 0.79±0.20a | 12.2 |
Sanggan
River | Y6 | 44 | 0.08±0.02d | 0 | 0.54±0.12e | 0 | 0.50±0.12e | 0 | 0.40±0.09e | 0 |
| Y7 | 45 | 0.11±0.02b | 0 | 0.77±0.17c | 6.7 | 0.72±0.16c | 2.2 | 0.57±0.13c | 2.2 |
| Y8 | 48 | 0.10±0.02c | 0 | 0.72±0.12cd | 2.1 | 0.67±0.11cd | 0 | 0.53±0.09cd | 0 |
| Yongding River | Y9 | 50 | 0.12±0.03b | 0 | 0.85±0.19b | 16.0 | 0.79±0.18b | 10.0 | 0.63±0.14b | 2.0 |
Table 2.
Hazard quotient values for different regions over four age groups (infants, children, teenagers and adults)
Figure 5.
Health quotient values for different age groups in the studied regions: (a) upstream of Qingshui River; (b) downstream of Qingshui River; (c) upstream of Yanghe River; (d) downstream of Yanghe River; (e) downstream of Yanghe River; (f) upstream of Sanggan River; (g) upstream of Sanggan River; (h) downstream of Sanggan River; (i) Yongding RiverNo risk was observed for the 0-2 years age class in the study area because all of the HQ values for the 0-2 years age class were lower than 1 (Table 2). Although the age classifications of 2-6 years, 6-16 years, and >16 years had overall low percentage risks, much higher risks were observed at specific locations (Y4 and Y5). Table 2 reveals that 63.3% and 65.3% of the HQ values for the age class of 2-6 years in the downstream region of the Yanghe River were greater than 1, respectively. Additionally, 55.1% and 57.1% of the HQ values for the age class of 6-16 years in the downstream region of the Yanghe River were greater than 1, respectively. This result suggested that the age range of children and teenagers of 2-16 was more likely to suffer from health complications associated with the consumption of water with a high concentration of fluoride in the downstream reach of the Yanghe River. Additionally, adults >16 years were expected to be affected, as 26.5% and 12.2% of the samples exceeded 1 in the downstream region of the Yanghe River, respectively.
4 Discussion
4.1 Sources of fluoride in the study area
Natural sources of fluoride occur from the erosion of fluoride-rich minerals, especially granites and volcanic rocks, and these represent the normal route of fluoride in waters (Yousefi et al., 2019). Anthropogenic activities also play an important role in the process by which fluoride is transported into waters (Mohammadi et al., 2017; Ghaderpoori et al., 2018). These activities included aluminum smelters, industrial plants that manufacture hydrofluoric acid, metal extraction and mining, electric and electronic industries, phosphate fertilizer plants, textile dyeing, plastics factories and thermal power plants (Ayoob and Gupta, 2006; Yousefi et al., 2019). In the study area, volcanic rocks are relatively developed and have a large distribution area. Therefore, high fluoride concentrations (5.8-12.4 mg L-1) have been observed in groundwater (Zhang and Che, 2008). This result indicated that natural sources of fluoride through erosion of the fluoride-rich minerals were an important source of fluoride in this area. However, the fluoride concentrations (0.30-1.50 mg L-1) in surface water were much lower than the concentrations in groundwater. Furthermore, the higher concentrations of fluoride, which were above 1 mg L-1, were only distributed in the downstream region of the Yanghe River (Xuanhua County and Xiahuayuan County), where the high density of industrial activity can easily pollute surface water. The gross industrial output value in this area accounted for 37.5% of the gross industrial output value of Zhangjiakou city in 2016. Therefore, it could be concluded that industrial activity was an important source of fluoride pollution in the downstream stretch of the Yanghe River.
4.2 Comparison with other studies in the Haihe River basin
The Yongding River is an important river in the Haihe River basin and is crucial for providing safe drinking water and ecological services to Beijing and Tianjin. However, it has been one of the most seriously polluted regions in China because of its shortage of water resources and serious water pollution (Liu et al., 2010; Guo et al., 2014). To date, some studies have investigated the fluoride pollution of drinking water in this area (Guo et al., 2012; Li et al., 2012; Hu et al., 2013; Su et al., 2013; Jia et al., 2018). For example, Su et al. (2013) investigated fluoride pollution in groundwater in Datong Basin and found that the fluoride concentrations in groundwater ranged from 0.1 to 8.3 mg/L (mean 2.2 mg/L), with 51% of the samples containing fluoride concentrations that exceeded 1.5 mg/L. Zhang et al. (2008) investigated fluoride pollution in Guanting Reservoir and found that the fluoride concentrations in the surface water ranged from 0.4 to 1.6 mg/L. Wang et al. (2010) investigated the fluoride concentrations of surface water in Baiyngdian Lake, which is located in the downstream region of the Yongding River. They found that the fluoride concentrations in surface water ranged from 0.33 to 1.06 mg/L, with an average of 0.85 mg/L. In this study, the fluoride concentrations ranged from 0.30 mg L-1 to 1.50 mg L-1, with an average of 0.86±0.27 mg L-1. It could be concluded that the fluoride concentrations in surface water were much lower than the concentrations in groundwater. The fluoride concentrations of surface water in the upper reaches of the Yongding River were higher than the concentrations in the downstream reaches.
4.3 Potential risk for the supply of drinking water
The potential health risk of dental and skeletal fluorosis in relation to fluoride consumption from drinking water for children and adults can exist (Yousefi et al., 2019; Zhou et al., 2019). In general, some scientists have confirmed that young people, including infants and children, are more exposed to the health risk caused by fluoride (Guissouma et al., 2017). Fluorosis usually develops in children below the age of 8 years because their skeletal tissues are still developing (Wambu et al., 2014). In our study, the risk of fluoride exposure among residents was characterized by comparing the HQ values. Children and teenagers in the age range of 2-16 years were more likely to suffer from health complications associated with the consumption of water with a high concentration of fluoride in the downstream section of the Yanghe River. This observation was consistent with the spatial distribution pattern of fluoride concentrations in the downstream region of the Yanghe River, where the highest fluoride concentration was found, as shown in the GIS map (Figure 4). Therefore, the use of surface water as a drinking water source in this area should be avoided during the Beijing Winter Olympic Games.
Fluorosis is generally found in the plains of arid and semiarid areas (Lin et al., 2004). The upstream region of the Yongding River is classified as a typical continental arid and semiarid area. It is an ecological protection area for Beijing, where rivers flow into Guanting Reservoir. The reservoir is a backup source of drinking water for Beijing during water shortages and has a storage capacity of 4.16 billion m3 (Yang et al., 2019). To ensure drinking water safety in Beijing, efforts should be made to ensure good water environmental conditions in Guanting Reservoir. However, some studies have reported that there is a high fluoride concentration in the groundwater in the upper reaches of the Yongding River (Lin et al., 2004; Li et al., 2017; Zhang et al., 2017; Li et al., 2019). In this study, a large amount of surface water with a high fluoride concentration entered Guanting Reservoir. This input could lead to serious fluoride pollution in Guanting Reservoir. Industrial activity was an important pollution source of fluoride in this area. Therefore, efforts will be made to reduce the input of fluoride generated from industry, such as reducing the ratio of the mining and mineral processing industry, replacing thermoelectricity with wind power, and improving industrial sewage treatment capacity, in the downstream stretch of the Yanghe River to protect the water quality in Guanting Reservoir.
5 Conclusions
This study was conducted in a typical arid and semiarid area situated in the upper reaches of the Yongding River in North China. The results were as follows:
(1) The fluoride concentrations ranged from 0.30 mg L-1 to 1.50 mg L-1, with an average value of 0.86±0.27 mg L-1. Although 9.1% of the samples from the upstream region of the Yanghe River had values that exceeded 1.0 mg L-1, 71.4% and 67.4% of the samples from the downstream region of the Yanghe River had values that exceeded 1.0 mg L-1.
(2) There were significant seasonal variations in the concentrations of fluoride in the Yanghe River. The concentrations of fluoride in July were higher than the concentrations in the other months in the upstream region of the Yanghe River, while higher concentrations of fluoride were observed from April to June. In addition to the temporal variations in fluoride concentrations, the higher concentrations of fluoride were mainly distributed in the downstream region of the Yanghe River. Therefore, an enormous amount of fluoride flows into Guanting Reservoir and leads to severe local and widespread fluoride pollution.
(3) The hazard quotient (HQ) index for children, teenagers and adults indicated that 19.6%, 15.6%, and 5.1% of the samples in the upper reaches of the Yongding River, respectively, posed health hazards to the associated groups. No risk was observed for the age class of 0-2 years in the study area. Children and teenagers in the age range of 2-16 years were more likely to suffer from health complications associated with the consumption of water with a high concentration of fluoride in the downstream region of the Yanghe River. Based on the results, it is imperative to take measures to reduce the fluoride concentration in surface water.
Acknowledgements
The authors thank the Bureau of Ecology and Environment of Zhangjiakou for providing monitoring data.
References
[1] T Abiye, G Bybee, J Leshomo. Fluoride concentrations in the arid Namaqualand and the Waterberg groundwater, South Africa: Understanding the controls of mobilization through hydrogeochemical and environmental isotopic approaches. Groundwater for Sustainable Development, 6, 112-120(2018).
[2] S Ali, Y Fakhri, M Golbini et al. Concentration of fluoride in groundwater of India: A systematic review, meta-analysis and risk assessment. Groundwater for Sustainable Development, 9, 100224(2019).
[3] S Ali, S K Thakur, A Sarkar et al. Worldwide contamination of water by fluoride. Environmental Chemistry Letters, 14, 291-315(2016).
[4] S Ayoob, A Gupta. Fluoride in drinking water: A review on the status and stress effects. Critical Reviews in Environmental Science and Technology, 36, 433-487(2006).
[5] A Azhdarpoor, M Radfard, M Rahmatinia et al. Data on health risk assessment of fluoride in drinking water in the Khash city of Sistan and Baluchistan province, Iran. Data Brief, 21, 1508-1513(2018).
[6] H Chen, M Yan, X Yang et al. Spatial distribution and temporal variation of high fluoride contents in groundwater and prevalence of fluorosis in humans in Yuanmou County, Southwest China. Journal of Hazard Materials, 235/236, 201-209(2012).
[7] C P Emenike, I T Tenebe, P Jarvis. Fluoride contamination in groundwater sources in Southwestern Nigeria: Assessment using multivariate statistical approach and human health risk. Ecotoxicology and Environmental Safety, 156, 391-402(2018).
[8] M Ghaderpoori, A A Najafpoor, A Ghaderpoury et al. Data on fluoride concentration and health risk assessment of drinking water in Khorasan Razavi province, Iran. Data Brief, 18, 1596-1601(2018).
[9] W Guissouma, O Hakami, A J Al-Rajab et al. Risk assessment of fluoride exposure in drinking water of Tunisia. Chemosphere, 177, 102-108(2017).
[10] H Guo, Y Zhang, L Xing et al. Spatial variation in arsenic and fluoride concentrations of shallow groundwater from the town of Shahai in the Hetao basin, Inner Mongolia. Applied Geochemistry, 27, 2187-2196(2012).
[11] W Guo, Y Fu, B Ruan et al. Agricultural non-point source pollution in the Yongding River Basin. Ecological Indicators, 36, 254-261(2014).
[12] S Hu, T Luo, C Jing. Principal component analysis of fluoride geochemistry of groundwater in Shanxi and Inner Mongolia, China. Journal of Geochemical Exploration, 135, 124-129(2013).
[13] Y Jia, B Xi, Y Jiang et al. Distribution, formation and human-induced evolution of geogenic contaminated groundwater in China: A review. Science of the Total Environment, 643, 967-993(2018).
[14] H R Li, Q B Liu, W Y Wang et al. Fluoride in drinking water, brick tea infusion and human urine in two counties in Inner Mongolia, China. Journal of Hazard Materials, 167, 892-895(2009).
[15] J Li, Y Wang, X Xie et al. Hierarchical cluster analysis of arsenic and fluoride enrichments in groundwater from the Datong basin, northern China. Journal of Geochemical Exploration, 118, 77-89(2012).
[16] J Li, H Zhou, K Qian et al. Fluoride and iodine enrichment in groundwater of North China Plain: Evidences from speciation analysis and geochemical modeling. Science of the Total Environment, 598, 239-248(2017).
[17] Y Li, F Wang, J Feng et al. Long term spatial-temporal dynamics of fluoride in sources of drinking water and associated health risks in a semiarid region of Northern China. Ecotoxicology and Environmental Safety, 171, 274-280(2019).
[18] N Lin, J Tang, J Bian. Geochemical environment and health problems in China. Environmental Geochemistry and Health, 26, 81-88(2004).
[19] X Liu, G Li, Z Liu et al. Water pollution characteristics and assessment of lower reaches in Haihe River Basin. Procedia Environmental Sciences, 2, 199-206(2010).
[20] A A Mohammadi, M Yousefi, M Yaseri et al. Skeletal fluorosis in relation to drinking water in rural areas of West Azerbaijan, Iran. Scientific Reports, 7, 17300(2017).
[21] F Ni, G Liu, Y Tan et al. Spatial variation of health risk of groundwater for drinking water supply in Mingshan County, Ya’an City, China. Water Science and Engineering, 3, 454-466(2010).
[22] . Reports on the Physical Fitness and Health Research of Chinese School Students(2012).
[23] O A Samuel, God E C Praise, T I Theophilus et al. Human health risk assessment data of trace elements concentration in tap water-Abeokuta South, Nigeria. Data Brief, 18, 1416-1426(2018).
[24] C Su, Y Wang, X Xie et al. Aqueous geochemistry of high-fluoride groundwater in Datong Basin, northern China. Journal of Geochemical Exploration, 135, 79-92(2013).
[25] S Suthar, V K Garg, S Jangir et al. Fluoride contamination in drinking water in rural habitations of northern Rajasthan, India. Environmental Monitoring and Assessment, 145, 1-6(2008).
[26] E W Wambu, S G Agong, B Anyango et al. High fluoride water in Bondo-Rarieda area of Siaya County, Kenya: A hydro-geological implication on public health in the Lake Victoria Basin. BMC Public Health, 14, 462(2014).
[27] X Wang, J Liu, M Ma et al. Response of freshwater biofilm to pollution and ecosystem in Baiyangdian Lake of China. Procedia Environmental Sciences, 2, 1759-1769(2010).
[28] Y Wang, S Zhang, W Cui et al. Polycyclic aromatic hydrocarbons and organochlorine pesticides in surface water from the Yongding River basin, China: Seasonal distribution, source apportionment, and potential risk assessment. Science of the Total Environment, 618, 419-429(2018).
[29] Guidelines for Drinking-water Quality. 4th ed, 370-373(2011).
[30] J Xiao, Z Jin, F Zhang. Geochemical controls on fluoride concentrations in natural waters from the middle Loess Plateau, China. Journal of Geochemical Exploration, 159, 252-261(2015).
[31] K K Yadav, S Kumar, Q B Pham et al. Fluoride contamination, health problems and remediation methods in Asian groundwater: A comprehensive review. Ecotoxicology and Environmental Safety, 182, 1-23(2019).
[32] J Yang, M Strokal, C Kroeze et al. Nutrient losses to surface waters in Hai He basin: A case study of Guanting reservoir and Baiyangdian lake. Agricultural Water Management, 213, 62-75(2019).
[33] M Yousefi, S Ghalehaskar, F B Asghari et al. Distribution of fluoride contamination in drinking water resources and health risk assessment using geographic information system, northwest Iran. Regulatory Toxicology and Pharmacology, 107, 104408(2019).
[34] M Yousefi, M Ghoochani, Mahvi A Hossein. Health risk assessment to fluoride in drinking water of rural residents living in the Poldasht city, northwest of Iran. Ecotoxicology and Environmental Safety, 148, 426-430(2018).
[35] L E Zhang, D Huang, J Yang et al. Probabilistic risk assessment of Chinese residents' exposure to fluoride in improved drinking water in endemic fluorosis areas. Environmental Pollution, 222, 118-125(2017).
[36] Yuewu Zhang, Shenghua Che. Analysis of fluoride pollution in Guanting Reservoir. Beijing Shuiwu, 11-14(2008).
[37] G Zhou, L Yang, C Luo et al. Low-to-moderate fluoride exposure, relative mitochondrial DNA levels, and dental fluorosis in Chinese children. Environment International, 127, 70-77(2019).