
R. Rossi, M. Gelfusa, T. Craciunescu, L. Spolladore, I. Wyss, E. Peluso, J. Vega, C. F. Maggi, J. Mailloux, M. Maslov, A. Murari, [in Chinese]. A systematic investigation of radiation collapse for disruption avoidance and prevention on JET tokamak[J]. Matter and Radiation at Extremes, 2023, 8(4): 046903
- Matter and Radiation at Extremes
- Vol. 8, Issue 4, 046903 (2023)
Abstract
I. CHALLENGES POSED BY THE DETECTION OF APPROACHING RADIATION COLLAPSES ON JET
Thermonuclear fusion has the potential to become a significant element in a sustainable energy mix for humanity in the medium and long term.1 This approach to energy generation relies on coalescing the nuclei of hydrogen isotopes in the fourth state of matter, namely, plasma. The reaction with the most favorable cross-section is the one between deuterium (D) and tritium (T). The ensuing defect of mass is converted into large amounts of energy, with the quantities of fuel required being very small compared with fossil fuels.1 Unfortunately, for the D and T nuclei to fuse, they need to come very close to one another, overcoming the repulsive Coulomb barrier, and this requires quite extreme plasma conditions in the laboratory, particularly in terms of temperatures that have to reach values higher than those in the core of the Sun. Therefore, plasmas for thermonuclear fusion cannot come in contact with material surfaces. One of the approaches with the best practical prospects is based on containing these plasmas using very strong magnetic fields. The most promising configuration of magnetic fields is the tokamak.2
Unfortunately, the tokamak is affected by sudden and violent collapses of the magnetic configuration, with consequent extinction of the plasma current. These extremely undesirable events are called disruptions and constitute a major problem, since they have been unavoidable in all existing machines.3 In present-day devices, even though they can and have caused damage to structures, in particular vacuum vessels, disruptions are mainly a nuisance because they limit the available experimental time. Unfortunately, the thermal loads on the plasma-facing components and the electromagnetic forces scale badly with the dimensions and the energy content of the plasma. The beams of runway electrons, another consequence of disruptions, are also expected to become a more serious issue in larger machines. Consequently, in the next generation of devices, particularly ITER or the demonstrative reactor (DEMO) class, disruptions can have fatal consequences. In DEMO, for example, a single high-current disruption, even if fully mitigated, could force the interruption of the operations, at least for inspection.4,5
Metallic tokamaks with tungsten (W) plasma-facing components, such as JET with the new ITER Like Wall (ILW), are particularly prone to disruption, especially when operated at high current and a low safety factor q95 of around three. Excessively high density and light impurity seeding, typically pursued to protect the divertor, can be root causes of disruptions. However, in recent years, a lot of progress has been made in reducing the occurrences of these situations.6 Consequently, nowadays, the main difficulties arising with metallic devices are those related to the control of heavy impurities. Excessive W concentration can indeed lead to loss of the high mode of confinement (the H mode) and to radiative collapse of the plasma. To reduce disruptivity, specific measures are typically taken, on the one hand to reduce the influx of tungsten from the wall crossing the edge and, on the other hand, to prevent its accumulation in the core. The typical JET strategies to avoid problems with heavy impurities in the steady state include (a) careful control of the edge-localized mode (ELM) frequency and edge density, to reduce sputtering and prevent W from crossing the edge transport barrier, and (b) sufficient central radiofrequency heating to avoid core accumulation.7 These schemes, even if not completely satisfactory (see Sec. III), are quite effective and are expected to be transferrable to ITER. More delicate are the transient phases at the beginning and end of the discharge, and in particular the transition from the H mode to the low-confinement mode (the L mode). In this phase, due to the reduction in additional heating, plasma density and temperature decrease, which can lead to low-frequency edge-localized mode instabilities (ELMs) or even to intermittent ELM-free periods. The consequent increase in the edge W density and the peaking of the core density profile often lead to excessive W accumulation and radiation collapse. At present, the typical countermeasure in experiments is to induce a fast transition from H to L mode, preventing W accumulation by reducing the confinement. However, such a scheme is not an option in high-energy-content ITER regimes, for various reasons, ranging from the difficulty of suddenly reducing the alpha particle heating to the challenges posed to the control system by such a sudden transition, which would cause excessive plasma wall contacts. Therefore, the quest for new indicators and schemes to prevent and avoid disruptions in the next generation of devices is an active area of research.
In the high-power campaigns in deuterium, full tritium, and DT, the vast majority of disruptions on JET were either caused or at least preceded by anomalous radiation patterns. By the term anomalous radiation patterns, we indicate local regions of unusually high emission. These “pathological” emissivities are also typically the first precursors, the earliest signs that the plasma state is drifting toward a dangerous situation. Therefore, it is very important to be able to detect these patterns as soon as possible, to activate prevention and avoidance strategies. Unfortunately, the tomographic reconstruction techniques used to obtain the information about the local radiation from the bolometer line integrals are very sophisticated but not compatible with real-time applications. Indeed, their computational time is typically too long by orders of magnitude. On JET, for example, maximum likelihood (ML) tomography requires about 10 s to converge on a single time slice. This is why, in the past, machine learning disruption predictors have mainly used only the total radiated power as input.8–10 There are other indicators, recently developed in preparation for the DT campaign and implemented in the JET real-time network, that rely on radiation peaking factors specifically developed to separate core and edge radiation contributions, but these are also not spatially resolved.11 Unfortunately, the radiation anomalies, potentially leading to disruptions, are quite involved and affect different regions of the plasma cross section. Spatially resolved detection would therefore be very valuable, particularly for early warning aimed at avoidance and prevention, instead of mitigation. Moreover, knowing where the anomaly is located can help to develop specific and more efficient avoidance and control strategies. Avoidance indicates remedial actions, which allow recovery of a healthy plasma state to continue an experiment. Prevention consists of the steps required to terminate the discharge quickly before the actual occurrence of the disruption. When a disruption is unavoidable, the only alternative is to mitigate its consequences with appropriate tools, such as massive gas injection or shattered pellets.12
In the present work, a new inversion method for bolometric measurements is presented that exhibits low spatial but high time resolution. Its results have been validated with maximum likelihood tomography, which is the only technique capable of associating confidence intervals with the tomographic inversions on a routine basis.13,14 The dynamics of the radiation patterns detected at the edge have been confirmed by movies collected by the visible cameras. Considerations of the local power balances have suggested a new quantity that is most suitable for interpreting the evolution of radiation anomalies, namely, the radiated power divided by the plasma internal energy. With this new indicator, the probability of the plasma drifting toward disruptive conditions can be determined. Together with recently developed robust parameterizations of the temperature profile, clear indications about the danger of the various plasma states can be provided to the control system. The warning times are compatible with avoidance strategies when the radiation anomalies are in the core. Radiation collapses leading to edge cooling, once the electron temperature anomaly has been detected, are typically much faster and sometimes compatible only with prevention or mitigation measures. In any case, the developed indicators give much earlier notice of the plasma approaching dangerous conditions than can be derived from the locked mode, the radiation peaking factors, or the temperature profile indicators, the main signals used to trigger mitigation actions on JET.15
The remainder of the paper is structured as follows. Section II describes the new high-time-resolution tomographic inversion, together with the diagnostics and algorithms used to validate its findings, namely, maximum likelihood tomography and visible cameras. An overview of the analyzed database and the main radiation anomalies leading to plasma collapse is presented in Sec. III. The mathematical model used to interpret the phenomenology and justify the use of the new indicators is covered in Sec. IV. In Sec. V, the dynamics of the most common forms of radiation collapse are described in detail. By combining the radiation patterns with the anomalies in the temperature profiles, it is possible to clearly determine the sequence of events leading to the onset of disruptions, as documented in Sec. VI. Possible remedial strategies and conclusions are covered in Sec. VII.
II. COMPLEMENTARY DIAGNOSTICS: BOLOMETRIC TOMOGRAPHY AND VISIBLE CAMERAS
This section is devoted to the description of a low-spatial high-time resolution inversion method of the bolometric diagnostic line integrals (Sec. II A). The most sophisticated tomographic method available, based on the maximum likelihood principle, is used to validate the obtained radiated powers (Sec. II B). The radiation dynamics at the edge are also confirmed by data from wide-angle visible cameras (Sec. II C). To make the paper self-contained, a short overview of previously developed profile indicators, based on measurements of the electron temperature, is provided in Sec. II D.
A. Low-spatial high-time resolution tomography
Analysis of radiation (or emissivity) patterns in tokamaks is usually performed with inversion of bolometric signals, known as tomography. Even if this technique allows one to obtain high-resolution spatially resolved information, it is time-consuming, and its application in real time is, at the moment, unrealistic.16 An alternative approach to tomography is the use of peaking factors, as developed in Ref. 17. Even though this method has been clearly demonstrated to be able to detect global radiation anomalies, its interpretation is not straightforward, and it does not have the spatial resolution to identify all the various types of emission pattern detected on JET. A systematic analysis of the inadequacies of peaking factors is presented in Ref. 18, together with the competitive advantages provided by a low-spatial-resolution tomographic approach.
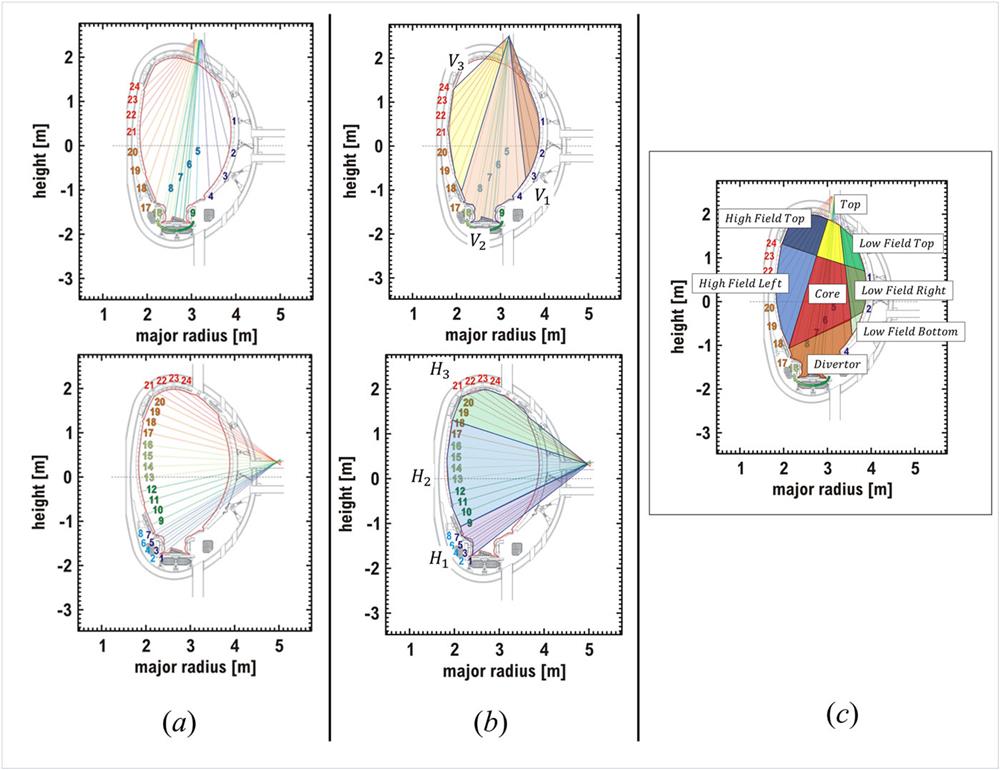
To find a reasonable trade-off, the present work proposes an alternative solution that aims at drastically reducing the computational time by lowering the spatial resolution of the inversion. The method consists of calculating the emission from macro-views, obtained by summing the corresponding lines of sight of the bolometers, and then combining them into macro pixels. Considering the vertical and horizontal cameras of JET [Fig. 1(a)], one can calculate three vertical and three horizontal macro-views [Fig. 1(b)]. Their intersections identify eight regions [Fig. 1(c)], which henceforth will be referred to as core, divertor (div), high-field left (HFL), high-field top (HFT), top, low-field top (LFT), low-field right (LFR), and low-field bottom (LFB).
![]()
Figure 1.Schematics of (a) the JET horizontal and vertical bolometer cameras, (b) low-spatial-resolution views, and (c) the intersection region.
The power radiated from each macro-view is given by the sum of the powers detected by the lines of sight that make up the macro view. For the configuration proposed in Fig. 1, it is possible to write
The power from each macro-pixel is equal to the sum of the average emissivity R of each region multiplied by the corresponding average geometrical factor F:
Once the emissivity has been calculated, the emitted power in the corresponding region can be derived by multiplying the emissivity by the corresponding volume (toroidally symmetric emission must be assumed, of course). The spatial resolution of the method is adequate to detect the radiation anomalies leading to disruptions on JET, as shown later. The accuracy of the approach has been checked by comparing the calculated powers with the most accurate tomographic method available (see Sec. II B), and it has been found that the typical error is around 15%–20% in most cases. This method allows also the determination of the emissivity and the power emitted from each macro-pixel with more than adequate time resolution; the inversion of one time slice requires an average time of 50 µs, to be compared with the 2 ms cycle time of the JET real-time network. The time resolution of the method is therefore limited by the 500 Hz hardware low-pass filter of the bolometric diagnostic. Consequently the approach is fully compatible with real-time implementations.
B. Maximum likelihood tomography
On JET, maximum likelihood (ML) tomography was originally developed for the gamma and neutron cameras.20,21 Its application to bolometry is more recent.13 The original approach was based on the assumptions that both the m lines of sight and the pixels of the 2D emissive distribution
The following iterative formula can then be implemented to derive the emissivities fn of the pixels that maximize the likelihood:22
The main specific characteristic of this method is that the uncertainty image resembles the reconstruction itself. This is not true for linear reconstruction methods, for which high-intensity features in the image may contribute to noise in distant and low-intensity regions (see Ref. 23 for details). Consequently, once the emissivity has been evaluated, it is possible to obtain the variance of the back-calculated projections and then the uncertainties that are to be associated with each pixel of the reconstruction. The details of the formalism for the evaluation of the uncertainties are beyond the scope of the present work, but can be found in Ref. 24. It has also been shown that the requirement of a Poisson distribution can be relaxed and that the method is also valid for measurements obeying Gaussian statistics, which are more appropriate for application to bolometry. To conclude this subsection, it is worth mentioning that the algorithm implemented on JET imposes a smoothing of the reconstructed tomograms along magnetic surfaces. It is also important to note that the version used to obtain the results reported in the present work can take into account the most important sources of errors in the measurements, such as outliers and uncertainties in the spatial estimates of the magnetic surfaces.25–27 Furthermore, the code already implemented at JET has recently been used, in combination with the operational cameras, to investigate specific physical problems related to runaway electron experiments.28
C. Image processing for radiation pattern detection
The visible radiation analysis is performed by means of the visible operational cameras mounted on JET. In the case of multifaceted asymmetric radiation from the edge MARFE, a blob in the visible region is usually observed on the high-field side, close to the wall.
Even though bolometers and visible cameras are sensitive to different spectral regions (the visible camera sees only the visible region, while bolometers have a much wider range), a comparison between the two diagnostics has been performed to confirm that the new bolometer inversion approach is capable of detecting MARFE with comparable, if not better, performances.
The comparison has been carried out in two ways: first, on a limited number of frames, by manually inspecting the visible camera frames and checking that they show a MARFE when the high-frequency radiation indicates an anomaly (see Secs. III–V) and, second, by comparing the results of the bolometer inversion with an indicator computed from the visible camera frames.
The algorithm developed for visible plasma radiation anomaly detection is based on OpenCV-Python, which is a library of Python bindings designed to solve computer vision problems. The algorithm takes as input a video file generated by the JET cameras. It acts on one frame at a time and performs the following two preprocessing steps:
The output of these two steps is a binary image with white pixels highlighting the brightest zones of the original frame. The main hypothesis behind the detection method is that for a safe shot, the centroid of the visible radiation emitted by the plasma stays close to the divertor without changing its position significantly throughout the shot. To verify this, the coordinates of the centroid of the pixels in the binary image are evaluated and stored in memory. For each frame, the algorithm compares the values of the coordinates of the centroid with those of the previously processed frame and checks that the differences do not exceed a specific threshold (set to 20 pixels and corresponding to about 15 cm in the present analysis). If the threshold is exceeded, a radiation anomaly is detected, and the tracking phase starts. The boundaries and centroid of the radiation anomaly are identified and superimposed on the original frame for visual inspection.
A systematic analysis of the approach just described has been performed, proving that the identified threshold allows very robust detection practically without any false alarms.29 However, it has been observed that, even if visible cameras can be used to detect MARFE, their limited spectral range and low frame rates usually cause a delay in the warning time with respect to the bolometer-based approach. In this specific case, the operational visible camera has a frame rate of 25 Hz, corresponding to a time resolution of 40 ms and an instrumental statistical delay of 20 ms with respect to the bolometers, which have a time resolution of about 2 ms. The employment of cameras with faster frame rates would be advisable in the next generation of devices.
D. Indicators of the shape of the temperature profile
To compare the evolution of the radiation emission with the effects on the plasma thermal energy, a series of indicators of the temperature profile have been tested. The systematic analysis reported in Ref. 30 showed that the two described below, one for the core and one for the edge, are the most effective.
For the identification of the temperature profile hollowness, the developed indicator relies on the Bhattacharya distance31DB, originally developed to quantify the distance between Gaussian distributions and defined as
To detect edge cooling issues, the best developed indicator relies on the cumulative distribution function (CDF). After normalizing the electron temperature profile Te,norm and computing the CDF, the plasma radius ρ98 at which the CDF reaches 98% is calculated as
Typically, cooling of the edge causes a contraction of the plasma column. Consequently, to obtain an indicator that increases with the edge cooling, coherently with the others reported in the literature, the cumulative based cooling (CBC) parameter is calculated as CBC = 1/ρ98.
III. IDENTIFICATION OF PATTERNS LEADING TO RADIATION COLLAPSE
This section introduces the database analyzed (Sec. III A) and the main types of radiation patterns affecting JET plasmas (Sec. III B). The analysis confirms that the proposed fast inversion algorithm exhibits sufficient spatial resolution, time resolution, and accuracy to properly identify and quantify the radiation anomalies that precede disruptions.
A. Analyzed database and global statistics
The analysis covers the four main JET campaigns from 2019 to the end of 2021: the high-power DD (C38, C39), the full tritium (C40), and the 50-50 DT (C41) campaigns. All the discharges have been included, except the intentional disruptions or those missing essential data. The resulting database includes a total of 1735 pulses, 1204 of which were safe and 531 disruptive. The main plasma parameters covered by the database are shown in Fig. 2, and more detailed statistics of the disruptions are reported in Table I. The flat-top plasma current ranges from 1 to 3.5 MA, while the magnetic field goes from 1.7 to 3.9 T. The maximum input power reaches a total of 37.8 MW [neutral beam injection (NBI) = 31.6 MW and ion cyclotron resonance heating (ICRH) = 5.1 MW]. The minimum safety factor q95 on the flat top observed in the database is 2.6, while the maximum is around 6. In contrast to the work reported in Ref. 15, the analyzed database also contains all the discharges with plasma current discharges between 1 and 2 MA, a normal range of operation for JET. Even if disruptions with Ip < 2 MA and internal energy W < 5 MJ are not considered dangerous for the device, their inclusion enables better statistics about the events in the ramp down of the plasma current to be obtained. In the present database, more than 50% of the disruptions occur at a current above 85% of the flat-top current, an important and not very reassuring indication for the next generation of devices. Another worrying aspect is the very high disruptivity above 3.5 MA and therefore at low q95, because future devices such as ITER and Divertor Tokamak Test (DTT) are indeed meant to operate at a safety factor of about 3 or below. However, it should be borne in mind that the operational time available to optimize these high-current discharges on JET was quite limited.
![]()
Figure 2.Main plasma parameters of the analyzed database: number of pulses and percentages of disruptions.
| C38 | C39 | C40 | C41 | Total | Hybrid pulses | |
|---|---|---|---|---|---|---|
| Total | 964 | 169 | 305 | 297 | 1735 | 442 |
| Safe | 707 | 144 | 182 | 171 | 1204 | 336 |
| Disruptive | 257 | 25 | 123 | 126 | 531 | 106 |
| Ramp-up disruptions | 0 | 0 | 1 | 0 | 1 | |
| Flat-top disruptions | 61 | 13 | 30 | 32 | 136 | |
| Ramp-down disruptions | 196 | 12 | 92 | 94 | 394 |
Table 1. Main statistics of disruptions in campaigns C38 to C41.
It is important to note that only seven of the 531 disruptions are not preceded by a detectable macroscopic radiation anomaly. All these disruptions are due to MHD modes induced by problems in the setting up of the magnetic configuration. Indeed, five of them are experiments involving the error field correction coils (EFCCs), and the other two present a locked mode from the beginning of the discharge. Consequently, these seven discharges are all detected only by the locked mode signal. However, a comment is in order here. Being chronically underpowered, JET normally operates well away from the beta limit.32 Radiation anomalies could not be a good precursor of disruptions, owing to the plasma reaching the beta limit, but this issue is not addressable with the present database.
B. Main types of radiation anomalies preceding disruptions
In the past, the radiation limit, like the density limit, was typically treated as a unique phenomenon, linked to the radiation function of impurities.33 Indeed, in the temperature range typical of tokamak operation, impurities tend to emit more if the plasma becomes colder. This can lead to a runaway phenomenon, because the increased emission can reduce the local plasma temperature even more, causing a further increase of radiation in a positive feedback loop. However, even if the basic physical mechanism is the same, quite different types of radiation anomalies can occur during a JET discharge, as documented in this section. The main ones are illustrated in Fig. 3 with the help of ML tomography and videos from the visible cameras.
![]()
Figure 3.Radiation cases: core radiation in the top row (#94161), low-field-side radiation in the middle row (#94447), and high-field-side radiation in the bottom row (#94615). Tomographic reconstructions have been obtained by averaging bolometer signals in a time window of 10 ms.
The top row of Fig. 3 shows the pattern typical of a radiation collapse resulting from excessive emission in the core, a consequence of W accumulation. The root cause can be either excessive influx of W from the wall, such as in the case of operation at the too low ELM frequency typical of low gas injection, or loss of the H-mode barrier, such as during ramp-down of the plasma current.
The crescent shape blob of radiation shown in the middle row of Fig. 3 is again a consequence of heavy impurities (intrinsic W or extrinsic such as Kr), accumulating on the low-field side owing to centrifugal forces.
Instead, the MARFE-type pathologies shown in the bottom row of Fig. 3 are typically due to light extrinsic impurities, such as Ne or Ar, injected to increase the plasma radiated fraction. These high-emission features tend to move up and down along the inner wall and radiate strongly in the visible; they can therefore be detected and tracked quite well by the visible cameras, if these have sufficient time resolution. Unfortunately, the frame rate of the cameras available on JET is 40 ms, and consequently some of these anomalous radiation patterns are seen only by tomography.
IV. INTERPRETATION OF PHENOMENOLOGY AND RELATED INDICATORS
This section aims at introducing the indicators and the model proposed to best describe the boundaries between safe and disruptive plasmas. Traditionally, radiation collapse was described in terms of the ratio between radiated power and input power.34 This indicator showed its limits particularly in the last campaigns of JET with the ILW. Indeed, for example, at the end of the flat top and during the termination phase of the plasma, this quantity can easily diverge just because the additional heating systems are progressively switched off. However, the situation can be much less dramatic if the plasma energy content is sufficiently high to prevent the onset of radiation instabilities. Consequently, it is more appropriate to describe the approach to a radiation collapse in the space of the radiated power divided by the plasma energy. This indicator is then to be particularized for each macro region where the collapse can take place. To this end, the radiated powers, calculated from the high-time-resolution inversion Pi described in Sec. II A, are divided by the energy of the plasma Ep. It is interesting to note that this quantity has the dimension of inverse time and represents a sort of local cooling time. In this perspective, the plasma energy equation can be written as
From this equation, different situations can be distinguished:
The last case is the one of most interest for the investigation of the plasma dynamics leading to radiation collapse. In the presence of strong local radiation, dominant with respect to input and transport, the local cooling time is too short with respect to the heating and transport time scales, and the plasma cools locally, with eventual onset of electron temperature anomalies. Thus, it is clear that the local variation of energy is strongly related to the ratio of the radiated power to the local internal energy:
For example, electron temperature anomalies are usually observed in the ramp-down, when the additional heatings (NBI and ICRH) are shut down. In this case, if the local radiation losses are much larger than the transport terms (the cooling time is shorter than the transport time scales), a local decrease in the plasma energy ensues, with consequent hollowness or edge cooling. Since most disruptions occur during this phase, the more traditional indicator Prad/Pinput becomes inadequate, because it tends to cause an unacceptably high number of false alarms, when the denominator decreases abruptly.
With the proposed equations, it is also possible to provide a direct interpretation of the experimental evidence that there are very few disruptions during the ramp-up of the plasma current. In this phase, the input power typically exceeds the losses, and the plasma internal energy grows. Therefore, it is unlikely that any region of the plasma cross section will experience an energy deficiency and radiation collapse. This remains true even if one considers that some of the hybrid discharges terminate during the ramp-up of the plasma current if there are signs of impurity influxes. There are not many such cases, and most shots are shut down in this phase because they would not achieve the expected performance, not because they would necessarily cause disruption during the setting up of the configuration. In any case, the actions taken by the control system during the ramp-up of Ip are quite effective and certainly have contributed significantly to reducing the disruptivity in this phase of hybrid scenario discharges.35
The distribution of the experimental data, in the space of the radiated power vs plasma internal energy, is shown in Fig. 4 for the most important macro-pixels. Similar pictures are obtained for the other regions. As expected, owing to the different sizes and plasma properties of the macro-pixels, each region presents a different stability boundary. To have a dimensionless, easy-to-interpret threshold for each region, these boundaries have been calculated as follows. The boundary is defined in terms of the radiated power Prad in each region and for each level of the plasma internal energy Ep. Denoting by
![]()
Figure 4.Observed frequency maps in the space of radiated power vs plasma energy for the regions where radiation anomalies appear more often (core, high-field side, and low-field side). The red lines represent the linear boundary between safe and anomalous regions of the operational space. Analogous results are obtained for the other macro pixels.
A value of
The red lines in Fig. 4 have been calculated with the method described here. Analogous calculations have been performed for all the other macro-regions shown in Fig. 1. Once the parameters Λi are known, the normalized radiation anomaly indicators are calculated as
A couple of comments are in order here to interpret the graphs in Fig. 4. First, in the present work, Ep in the denominator of Eq. (17) is the plasma total internal energy. Studies are underway to find a real-time-compatible estimate of the individual macro-pixels’ internal energy, an upgrade that is expected to significantly improve the performance of the approach. Second, it is important to remember that one of the aims of the proposed approach is to develop an adaptive system, capable of starting to predict with a minimum number of training examples, ideally only one disruption. This is why the equation of the boundary between the safe and disruptive regions, the red curve in the plots, is a simple straight line. More complex functions could be derived, but at the price of an unacceptable increase in the training set. Another important aspect to bear in mind is that in disruptive discharges, most of the time the plasma parameters remain in the safe operational region. This is the reason for the similarity between the right and left plots in Fig. 4. The light blue regions in the plots in the right column are typically those corresponding to the disruptive discharges. It is worth pointing out that this imbalance (many more safe than disruptive time slices) is going to become worse in the next generation of devices, posing additional problems for predictors based on machine learning.
V. EXAMPLES OF DYNAMICS FOR THE MAIN TYPES OF RADIATION COLLAPSE
In this section, examples of the plasma dynamics leading to the main forms of radiation collapse are presented. These are the most typical radiation collapses in the core, MARFE on the high-field side and blobs on the outer midplane. The description of the three most typical forms of radiation collapse is also the occasion to describe the behavior of the indicators introduced in Sec. IV.
A. Core radiation
A typical cause of disruption on JET is destabilization of tearing modes due to electron temperature hollowness. The typical evolution of the plasma leading to the disruption starts with an excess of radiation in the core, which causes a local reduction in the electron temperature and consequent changes in the resistivity and current profiles, destabilizing macroscopic MHD modes.36
As an example, the time traces of pulse 96 486 are shown in Fig. 5. This pulse disrupts at t = 15.518 s, at the beginning of the current ramp-down, with a plasma current around 2.8 MA. The locked-mode amplitude (third row, red line) becomes anomalous at t ∼ 15.466 s, just 52 ms before the beginning of the current quench. In this discharge, the disruption mitigation valve (DMV) is fired at t = 15.492 s. The color map in Fig. 6 shows that the mode locking is preceded by an anomalous core radiation (Λn,core > 1) from t ∼ 14.185 s and a hollowing of the electron temperature profile (t ∼ 14.198 s). Furthermore, the first anomalous increase in core radiation is observed from t ∼ 13.5 s.
![]()
Figure 5.Pulse 96 486: time traces of the plasma current and plasma energy (first row); input power and radiated power (second row); locked-mode amplitude and dimensionless core radiation factor (third row); dimensionless divertor, HFL, and HFT radiation factors (fourth row); dimensionless top, LFR, and LFT radiation factors (fifth row); outer Be II photon flux (used to detect ELMs) and total gas rate (sixth row). The right column shows the same plots with a zoom near the disruption.
![]()
Figure 6.Pulse 96 486: electron temperature profile (colormap) and Λ
Consequently, for this discharge, it would have been possible to implement an avoidance-prevention strategy based on core radiation–electron temperature–locked-mode amplitude anomalies. The control system would have had about 1.28 s before the locking of the mode by using the core radiation and electron temperature hollowness information, and about 40 ms (assuming 10 ms as the minimum warning time to trigger the DMV) to mitigate the disruption (as the JET control system did in this case).
B. MARFE, anomalous edge radiation on the high-field-side region
MARFE is a toroidally symmetric phenomenon that occur near the plasma boundary.37,38 It is characterized by increased radiation, high ion density, and low electron temperature. On JET, disruptions are sometimes preceded by MARFE or an X-point radiation phenomenon.14 This behavior typically precedes the locking of the mode and the disruption, implying that its detection can have a significant role in prevention and mitigation of disruptions.39 Disruptions are often caused or preceded by MARFE, particularly during the ramp-down of the plasma current.
Figure 7 shows the time traces of pulse 94 650. The pulse disrupts at t ∼ 16.75 s, when the plasma current is around 2 MA. The locked-mode amplitude becomes anomalous at t ∼ 16.513 s, a consequence of a clear cooling of the edge, which has already started at 16.23 s. The first signs of problems with radiation at the edge appear around 15.715 s, and a clear anomaly is picked by the developed indicators from 15.79 s. Both the visible camera and the tomographic reconstructions, shown in Fig. 8, confirm the radiation behavior tracked with the low-spatial-resolution tomography.
![]()
Figure 7.Pulse 94 650: time traces of plasma current and plasma energy (first row); input power and radiated power (second row); locked-mode amplitude and dimensionless core radiation factor (third row); dimensionless divertor, HFL, and HFT radiation factors (fourth row); dimensionless top, LFR, and LFT radiation factors (fifth row); outer Be II photon flux (used to detect ELMs) and total gas rate (sixth row). The right column shows the same plots with a zoom near the disruption.
![]()
Figure 8.Pulse 94 650: tomographies (at t = 15.5, 15.8, 15.9, 16, and 16.5 s) and visible camera frames (from t = 15.58 s to t = 16.74 s) before the disruption.
Also in this case, the implementation of a radiation–temperature–locked-mode avoidance–mitigation methodology would ensure significant improvement with respect to the locked-mode mitigation system. On the basis of the detected radiation anomalies, the first warning would be triggered at 15.79 s at the latest, owing to the strong emission of visible radiation in the HFL region, about 1 s before the disruption and about 0.5 s before any appreciable cooling of the edge. The locked mode gives a warning time of only 235 ms. It is worth pointing out that in this specific case, the disruption was probably due to excessive gas puffing. Indeed, in a similar discharge, #94652, MARFE on the high-field side does not lead to edge cooling and to a disruption, because of smaller gas injection. Stable discharges with a developed MARFE on the high-field side are not uncommon, since MARFE-preceded disruptions represent a delicate interplay between local heating and fueling. Targeting these nondisruptive MARFEs with additional heating would not have any detrimental effect on performance. Furthermore, with proper adjustment of the threshold on Λi and the edge cooling indicator described in Ref. 30, it is possible to fairly effectively distinguish dangerous situations from the most stable ones.
C. Anomalous edge radiation in the low-field-side region
Another typical radiation pattern on JET is the presence of a radiation blob in the low-field side region. Some of these discharges are stable and achieve good H-mode confinement,40,41 but many experience a radiative collapse. For this type of radiation, two different disruption paths have been observed. The first is related to core radiation and electron temperature hollowness, while the second is correlated with the edge cooling phenomenon.
The time traces of pulse 94 447 are shown in Fig. 9. The pulse disrupts at t = 12.432 s, the DMV fires at t = 12.428 s, and the locked-mode amplitude becomes anomalous at 11.549 s. Looking at the radiation patterns, one can see that there is a strong increase in the LFR radiation, which becomes anomalous at t ∼ 10.5 s, with continuous oscillations of radiation between the LFR and the core. The core shows increasing radiation after an LFR anomaly and crosses the stability boundary at t ∼ 11.17 s, with a consequent hollowing of the electron temperature profile at t ∼ 11.37. After ∼100 ms, at t ∼ 11.5 s, the radiation increases strongly in all regions, and a few milliseconds later the mode amplitude also rapidly increases, and several minor disruptions occur before the major disruption. The detailed dynamics, leading to the disruption in this particular pulse, start with an ELM-free period, with consequent high influx of radiation through the pedestal region. Combined with the peaking of the density, which pushes the W ions toward the plasma center, this results in radiative collapse of the configuration.
![]()
Figure 9.Pulses 94 447 (a) and 94 655 (b): time traces of the plasma current and plasma energy (first row); input power and radiated power (second row); locked-mode amplitude and dimensionless core radiation factor (third row); dimensionless divertor, HFL, and HFT radiation factors (fourth row); dimensionless top, LFR, and LFT radiation factors (fifth row); outer Be II photon flux (used to detect ELMs) and total gas rate (sixth row). The right column shows the same plots with a zoom near the disruption.
The power, calculated by the low-spatial resolution inversion, has been checked using the ML tomography algorithm. The results, presented in Fig. 10, show that the behavior detected with the new algorithm has been properly evaluated and it is in line with the ML inversion. Indeed, from the figure, increasing LFR radiation (from about 8.6 s) is observed first, which then oscillates between the core and the edge. From the t = 10.4 s frame, a huge increase in the radiation on the low-field side is evident, and the anomaly is detected (Λn,LFR > 1). Then, the anomalous radiation “migrates” to the core radiation until the disruption.
![]()
Figure 10.Pulse 94 447: tomography inversions before disruption using the ML tomography algorithm.
Also in this pulse, monitoring of the LFR region might provide a relevant improvement of the warning time. Indeed, while the core radiation preceded the hollowness by “only” 200 ms, the LFR triggered an alarm 800 ms earlier, increasing the chance for the control system to avoid the onset of major anomalies and the consequent disruption.
Figure 9(b) shows that pulse 94 655 disrupts at t = 11.09 s. From t > 8 s, the LFR radiation starts to increase, and it becomes anomalous a t = 10.58 s. This leads to electron temperature edge cooling detected at t = 10.847 s, followed by mode locking at t = 11.04 s. Also in this case, the advantage of monitoring the radiation is clear. When the locked-mode amplitude is used, only 50 ms are available to mitigate the disruption, whereas the use of the electron temperature anomaly allows the warning time to be increased to 250 ms. Using the radiation, one would have a warning time of about 510 ms. It is worth mentioning that in the majority of disruptions preceded by edge cooling, the time between the drop in temperature at the edge and the thermal quench is much shorter than in this example. However, the radiation anomaly can be detected hundreds of milliseconds before, emphasizing the importance of accurately measuring the plasma total emission.
VI. PREDICTION MARGINS AND AVOIDANCE AND PREVENTION STRATEGIES
As already mentioned, in the database analyzed, anomalies in the radiation precede disruptions except in seven pulses. The Λn,i thresholds allow detection of all of them, and the distribution of the alarms, for the region of the plasma where the radiation anomalies appear first (but not necessarily before the locked mode; see later), is shown in the histograms in Fig. 11.
![]()
Figure 11.Distribution of anomalies for each macro-pixel: the histograms are for the region of the plasma where the anomaly is detected first by the Λ
Radiation anomalies can also appear in discharges that terminate without disruptions, as shown in the histogram in Fig. 12. However, the statistics reported require a few comments. First, it has been checked with ML tomography that an excessive level of radiation is effectively present when detected by the high-time-resolution algorithm. Second, most of these radiation anomalies result in hollowing of the current profile (in the case of core radiation) or in “soft” edge cooling. Therefore, the plasmas do not disrupt just because some intentional or unintentional actions were taken to remedy the situation. For example, some of these cases occurred during the ramp-down of the plasma current, and therefore the discharge was terminated before the entire disruption dynamics could fully develop. Some other interventions are described later. Here, it is more important to note that the capabilities of the high-time-resolution tomography suggest a clear avoidance and prevention strategy. Indeed, two main sequences of events are recognizable. When the radiation anomaly appears first in the core, it is followed by hollowing of the temperature profile and then a deformation of the current profile, leading to destabilization of the magnetic configuration detected by a sudden increase in the locked-mode amplitude. When the excess of radiation is detected in one of the macro-pixels at the edge, the plasma dynamics are characterized typically by a drop in the edge temperature (edge cooling), with consequent shrinking of the plasma current and again destabilization of the magnetic configuration, and with a sudden increase in the locked-mode amplitude. The margins between these events are significant, as shown in the plots in Fig. 13. It should be mentioned that in at least 85% of the disruptive discharges, the warnings provided by the developed indicators precede any intervention by the JET control system.42
![]()
Figure 12.Distribution of anomalous radiation events detected in discharges that do not disrupt.
![]()
Figure 13.Relative times of the various types of anomalous events detected by the indicators considered.
Considering that disruption predictors for mitigation have already been developed and can achieve success rates above 99% and simultaneously false alarms rates in the range of per thousand, a possible strategy for the control system of future devices emerges. The approach, which supports and extends previous work,43 is based on the relative times of the various events shown in Fig. 3. When a radiation anomaly is detected in the core, the control system should increase the input power by depositing it as close as possible to the plasma center. From the left plots in Fig. 13, it can be deduced that in 50% of the disruptions due to the core radiation, there are at least 125 ms between the time at which a radiation anomaly is detected and the beginning of the hollowing of the temperature profile. If the increase in the power deposited in the core is not successful and the temperature profile becomes hollow, the control system should proceed either with further increasing the input power or with the termination sequence, keeping the input power as high as safely possible in the central region. In the case that these measures also prove inadequate and the predictors based on the locked-mode amplitude trigger an alarm, the mitigation strategy should be initiated immediately. It is worth mentioning that the cumulative plots in Fig. 13 reveal that about 10% of the disruptions are detected first by the locked-mode signal. In these discharges, anomalies appear in the radiation patterns and are detected, but later than the anomaly in the locked-mode amplitude. Their detailed investigation is beyond the scope of this work.
An example supporting the feasibility of the approach just described is presented in Fig. 14 and 15. In pulse 96 491, impurities enter the core and cause a slight increase in the core radiation (observed from about t = 9.5 s). This leads to decreases in plasma energy and core temperature, involving increases in the core radiation and, of course, in Λn,core. At t = 10 s, the core radiation becomes anomalous (Λn,core >1), and the electron temperature profile is hollow (detection at t = 10.1 s). The hollow profile lasts for more than 2 s, but does not trigger an MHD mode. At t = 11.5 s, the gas influx is increased, inducing a transition to the L mode, and this probably leads to an increase in the transport from the core to the edge, helping to expel the impurities. The core radiation begins to decrease from t = 11.8 s, and the electron temperature profile recovers from the hollowness at t ∼ 12.5 s.
![]()
Figure 14.Pulse 96 491: Evolution of the main plasma quantities of interest for disruption avoidance.
![]()
Figure 15.Pulse 96 491: evolution of the temperature profile (colormap), showing the period when it becomes hollow from t ∼ 10.1 s to t ∼ 12.5 s. The red line shows the core radiation anomaly signal (Λn,core).
A similar approach could be followed in case the radiation anomaly is detected in one of the peripheral macro-pixels. Indeed, 50% of cases of edge cooling and hollowness are preceded by a radiative anomaly with a warning time of about 140 ms. Again, the first reaction should be an increase in the input power, possibly targeting the region where the radiation appears to be too high. Since the time scales of the radiation collapse at the edge are much shorter, this intervention should be as timely as possible. JET actuators are probably not adequate to perform this type of intervention, but with the next generation of devices, it is planned to install tens of megawatts of electron cyclotron heating. Electron cyclotron resonance heating (ECRH) systems have been used in the past to tackle even more delicate problems, such as the suppression of magnetic island and control of neoclassical tearing modes (NTMs).44 Therefore, they could presumably be designed also to help in preventing radiative disruptions; such a task will require that sufficient spare capacity be installed to have sufficient reserve power to be able to intervene in all critical situations (even during the flat top of discharges at full performance). Again, if the outcome is not positive and the temperature at the edge drops, the plasma termination sequence should be initiated within about 100 ms. In addition, in this case, if the locked-mode signals became anomalous, mitigation actions should be taken immediately.
Even though MARFE instabilities can be due to or accompanied by a sudden cooling of the edge and consequently lead quite rapidly to a disruption, sometimes they last for a quite long time. One example is the case of pulse 94 611 shown in Fig. 16. In this discharge, a long-lived MARFE forms at t ∼ 9.9 s and is observed until the end of the discharge (t ∼ 14.8 s). These observations give hope that rapid interventions after the detection of MARFE can become effective in avoiding disruptions due to shrinking of the current profile.
![]()
Figure 16.Pulse 94 611: evolution of the main plasma quantities of interest for disruption avoidance (left) and visible camera frames (right).
VII. CONCLUSIONS AND PERSPECTIVES
The capability to evaluate the local radiated power is of huge interest for nuclear fusion reactors. In addition to the power balances, on JET, this capability is also important for disruption prediction, because most disruptions on JET are caused or preceded by anomalies in the total radiated power. For off-line analyses, the most informative and reliable tool is of course bolometric tomography, but, unfortunately, the corresponding algorithms cannot be used for real-time control. Even if acceleration measures are implemented to deal with the problem of the excessive computational time required by ML tomography, the low-spatial high-time resolution inversion proposed in the present work provides a good alternative. Indeed, it has been proved to possess the accuracy, spatial, and time resolution to be a very valuable tool for prediction. Compared with other deep-learning-based solutions,45–47 it also has the advantage of being an inversion algorithm, even if a simplified one, and therefore it can generalize well and be effective also when dealing with emissivities that have never been encountered before.
Combined with robust temperature profile indicators, high-time-resolution tomography can detect incoming radiation collapses earlier than any other method. The proposed indicators, specific to any subregion of the plasma cross section, are indeed quite effective in revealing the onset of anomalous local emission patterns. With the implementation of adaptive training techniques, these indicators work well for all the hydrogen fuel mixtures, an essential consideration for ITER and DEMO. In the core, the warning times achieved are typically compatible with avoidance. In this case, the remedial strategy is quite straightforward, since there is more than enough time to increase the power deposited in the center, to counteract or at least delay radiation collapse until final measures can be taken. This has not been explicitly performed in feedback yet, but there are various examples of plasma dynamics proving that the strategy is possible, as shown in Sec. VI. The situation at the edge is more complex, because local MARFE-type structures can lead to edge cooling, with consequent disruptions on shorter time scales. ECRH systems should be particularly useful in this respect, given their flexibility. However, such additional heating schemes are not available on JET, and therefore it is not possible to learn how to use them, keeping in mind that strong localized power deposition can also be destabilizing if not performed carefully.
Future investigations will examine whether combinations of the developed indicators, possibly integrated with additional information, can provide not only information about the level of danger of the plasma state, but also an estimate of the time remaining to the beginning of the current quench.39,48 It should be also emphasized that all the developed indicators are fully compatible with real-time implementation. Moreover, being based on ratios and shape factors, they are expected to be very portable between different devices.10 They can also be progressively adjusted, on the basis of new information, during the evolution of a campaign. Therefore, adaptive versions of the indicators, implementing the technology described in Refs. 49–54, are being studied and look promising. This approach would, of course, reduce requirements in terms of training data, and hopefully it would allow deployment of the indicators already after a few disruptions in the next generation of devices. A possible refinement could consist of particularizing the high-time-resolution tomography and the remedial strategies for the various phases of the discharge, particularly the flat top and ramp-down of the plasma current. Hybrid versions of the predictors are also under investigation, with the aim of implementing approaches analogous to hybrid controllers. The 10% of disruptions detected first by the anomaly in the locked-mode amplitude require additional investigation. To extend the warning times in these cases, techniques to identify the slowing down of the macroscopic magnetic modes, and not just their locking to the wall, are a possible way forward. From this perspective, tools such as those developed for AUG55 are being transferred to JET.
From the perspective of ITER, in addition to improving understanding of impurity transport,56 experiments should also be carried out to test and adjust the proposed strategy in more reactor-relevant conditions, with fully detached divertors and radiated fractions around 90% of the input power. Particular attention will have to be devoted to ensure adequate sensitivity of the proposed indicators at high radiated fractions. In any case, the approach proposed in the present work seems potentially much more promising that the indicators available in JET’s real-time system, such as peaking factors and total radiated power divided by the input power.57 Investigation of the radiation limit in small-ELM regimes and in negative-triangularity configurations is also in its infancy.
ACKNOWLEDGMENTS
Acknowledgment. The authors are grateful to F. Rimini, L. Garzotti, D. van Ester, F. Frigione, C. Challis, A. Kappatou, E. Lerche, and J. Hobirk for their commitment in planning and conducting the experimental campaigns whose data were used in this work.
This work has been carried out within the framework of the EUROfusion Consortium, funded by the European Union via the Euratom Research and Training Programme (Grant Agreement No. 101052200–EUROfusion). The views and opinions expressed are, however, those of the author(s) only and do not necessarily reflect those of the European Union or the European Commission. Neither the European Union nor the European Commission can be held responsible for them.
References
[1] F.Chen. An Indispensable Truth: How Fusion Power Can Save the Planet(2011).
[2] J.Wesson. Tokamaks(2004).
[3] T.Henderet?al.. Nucl. Fusion, 47, S128-S202(2007).
[4] R.Wenningeret?al.. Power handling and plasma protection aspects that affect the design of the DEMO divertor and first wall.
[5] E. J.Straitet?al.. Nucl. Fusion, 59, 112012(2019).
[12] M.Lehnenet?al.. Nucl. Fusion, 51, 123010(2011).
[15] C.Sozziet?al.. Termination of discharges in high performance scenarios in JET.
[19] C. L.Lawson, L.Lawson C., R. J.Hanson. Solving Least Squares Problems(1995).
[23] K.Lange, and K.Lange, K.Carson. EM reconstruction algorithms for emission and transmission tomography. J. Comput. Assisted Tomogr., 8, 306-316(1984).
[31] A.Bhattacharyya. On a measure of divergence between two multinomial populations. Indian J. Stat., 7, 401-406(1946).
[32] F. C.Schuelleret?al.. Disruptions in tokamaks. Plasma Phys. Controlled Fusion, 37, A135(1995).
[35] C. D.Challiset?al.. Nucl. Fusion, 60, 086008(2020).
[37] B.Lipschultzet?al.. Marfe: An edge plasma phenomenon. Nucl. Fusion, 24, 977(1984).
[41] J.Garciaet?al.. Integrated scenario development at JET for DT operation and ITER risk mitigation.
[46] D. R.Ferreiraet?al.. Fusion Eng. Des., 164, 112179(2021).


Set citation alerts for the article
Please enter your email address

© Copyright 2018-2021 | Chinese Laser Press. All Rights Reserved 沪ICP备15018463号-20