Abstract
Based on the measured discharge, sediment load, and cross-sectional data from 1986 to 2015 for the lower Yellow River, changes in the morphological parameters (width, depth, and cross-sectional geomorphic coef?cient) of the main channel are analyzed in this paper. The results show that before the operation of the Xiaolangdi Reservoir (XLDR) from 1986 to 1999, the main channel shrunk continually, with decreasing width and depth. The rate of reduction in its width decreased along the river whereas that of depth increased in the downstream direction. Because the rate of decrease in the width of the main channel was greater than that in channel depth, the cross-sectional geomorphic coef?cient decreased in the sub-reach above Gaocun. By contrast, for the sub-reach below Gaocun, the rate of decrease in channel width was smaller than that in channel depth, and the cross-sectional geomorphic coef?cient increased. Once the XLDR had begun operation, the main channel eroded continually, and both its width and depth increased from 2000 to 2015. The rate of increase in channel width decreased in the longitudinal direction, and the depth of the main channel in all sub-reaches increased by more than 2 m. Because the rate of increase in the depth of the main channel was clearly larger than that of its width, the cross-sectional geomorphic coef?cient decreased in all sub-reaches. The cross-sectional geometry of the main-channel of the lower Yellow River exhibited different adjustment patterns before and after the XLDR began operation. Before its operation, the main channel mainly narrowed in the transverse direction and silted in the vertical direction in the sub-reach above Aishan; in the sub-reach below Aishan, it primarily silted in the vertical direction. After the XLDR began operation, the main channel adjusted by widening in the transverse direction and deepening in the vertical direction in the sub-reach above Aishan; in the sub-reach below it, the main channel adjusted mainly by deepening in the vertical direction. Compared with the rates of decrease in the width and depth of the main channel during the siltation period, the rate of increase in channel width during the scouring period was clearly smaller while the rate of increase in channel depth was larger. After continual siltation and scouring from 1986 to 2015, the cross-sectional geometry of the main-channel changed from wide and shallow to relatively narrow and deep. The pattern of adjustment in the main channel was closely related to the water and sediment conditions. For the braided reach, the cross-sectional geomorphic coef?cient was negatively correlated with discharge and positively correlated with suspended sediment concentration (SSC) during the siltation period. By contrast, the cross-sectional geomorphic coef?cient was positively correlated with discharge and negatively correlated with SSC during the scouring period. For the transitional and meandering reaches, the cross-sectional geomorphic coef?cient was negatively correlated with discharge and positively correlated with SSC.1 Introduction
The mechanisms of adjustment in alluvial river systems are complex because the evolution of the riverbed is influenced by many factors, which are related not only to the water and sediment input from the upstream, but also to the boundary and material of the riverbed. In recent decades, the water and sediment conditions in the lower Yellow River (LYR) have undergone remarkable changes, mainly due to the impacts of climate change, reservoir construction, soil conservation practices, and irrigation and water diversion (Wang et al., 2007; Peng et al., 2010; Yang et al., 2010; Cui et al., 2014). The annual runoff has decreased drastically with a reduced proportion of runoff in the flood season to annual runoff. The decreased peak discharge and increased incoming sediment load from the middle Yellow River in the 1990s caused the severe aggradation and shrinkage of the main channel of the LYR, resulting in a significantly decreased capacity for water and sediment transport (Lu et al., 2000; Wu et al., 2008; Peng et al., 2010; Wang and Li, 2011). The impoundment of the XLDR in October 1999, especially impoundment according to the Water-Sediment Regulation Scheme with a controlled release of flood waters by the Yellow River Conservancy Committee since June 2002, has significantly changed the natural flow regime, trapping 3 billion m3 of sediment by 2017, and has caused a sharp decrease in the sediment load entering the LYR (Wang et al., 2010; Yang et al., 2010). The river channel downstream from the XLDR has experienced continuous erosion, and the corresponding riverbed morphology has changed significantly with the increase in the grain sizes of the suspended sediments, leading to an important impact on the eco-environment and evolution of the estuary (Wu and Li, 2008; Wang et al., 2010; Kong et al., 2015; Xia et al., 2016; Zhang et al., 2017; Zheng et al., 2018).
In recent decades, researchers have carried out numerous studies on channel evolution under changing hydrological regimes in the LYR (Wu et al., 2010; Ma et al., 2012; Zheng, 2013; Miao et al., 2016; Sun et al., 2016; Tian et al., 2016; Li et al., 2017; Wang et al., 2017; Xia et al., 2018), mainly focusing on the morphological adjustment of the braided reach caused by the changing conditions of the water and sediment, and the channel adjustment of the entire LYR caused by the impoundment of the XLDR. For example, researchers (Tian et al., 2016; Li et al., 2017; Xia et al., 2014, 2018) have studied channel adjustments in the braided reach of the LYR from different aspects, such as cross-sectional geomorphological adjustment, variations in reach-scale bankfull discharge, and the intensity of thalweg migration. Sun et al. (2016) claimed that the narrowing of the LYR by the joint regulation of the upstream reservoirs could result in non-siltation and even channel scouring. However, Miao et al. (2016) suggested that the water sediment regulation scheme in the LYR was no longer as effective as it was initially, meaning that the degree of erosion had a tendency to decline. Dirk et al. (2011) claimed that the variation in the magnitude and frequency of discharge probably caused siltation rates in the LYR, once the reservoir had been filled, to be larger than in the pre-dam situation. Under the influence of climate change and human activities, the lower reaches of the Yellow River have experienced two distinct periods since 1986: a continuous siltation period and a continuous scouring period before and after the impoundment of the XLDR. But the temporal and spatial variations in the channel’s morphological adjustments in these two periods are not sufficient for a systematic understanding. Therefore, based on the measured discharge, sediment load, and cross-sectional data for the LYR between 1986 and 2015, the adjustment in the main-channel geometry of the lower Yellow River is analyzed, its pattern is generalized, and the response of the main-channel geometry to the changing water and sediment conditions is discussed. The results may provide theoretical guidance for understanding the evolution of the main channel and for maintaining the health of the LYR.
2 Study area
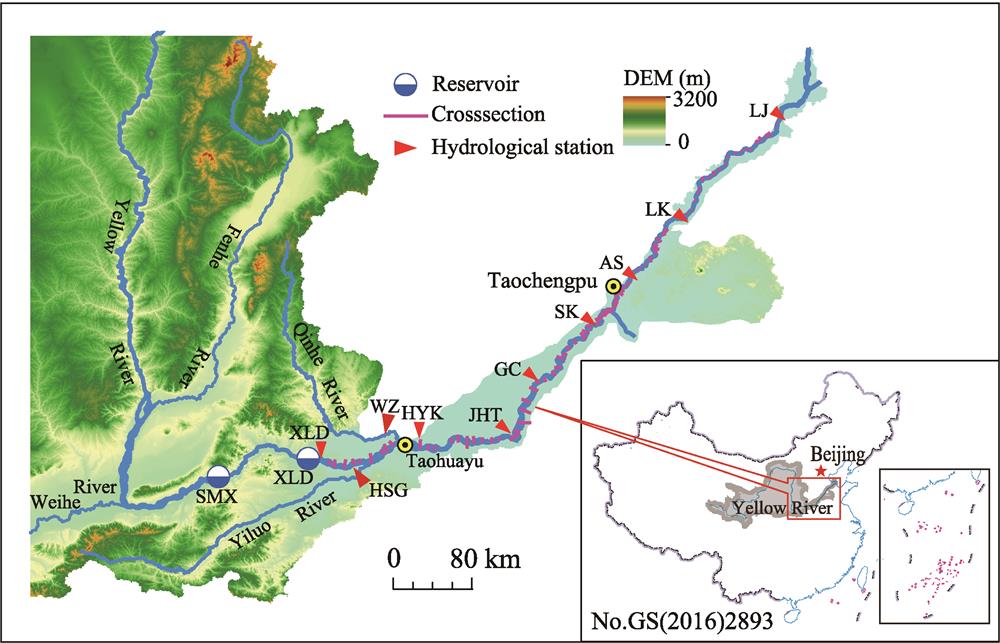
Located in the eastern part of the Yellow River Basin in China, the LYR begins at Taohuayu and ends at Lijin (LJ), with a drainage area of 23,000 km2, accounting for only 3% of the total basin area. The relief along the 768-km-long course of the LYR is only 93.6 m with a mean longitudinal gradient of about 0.12‰ (Figure 1). According to its geographical and riverine features, the LYR can be divided into three reaches: (1) the braided reach above Gaocun (GC), which is located on top of the alluvial fan, and is characterized by wide and shallow cross-sectional profiles, frequent migration, and extremely unstable riverbed, with a channel length of 207 km and channel gradient of 0.17‰-0.27‰; (2) the transitional reach from GC to Taochengpu (TCP), which is located at the front of the alluvial fan, and has a single shape with a length of 165 km and a channel gradient of 0.12‰, with a channel stability greater than that of the braided reach with slight migration in the transverse
direction during high flood events; and (3) the meandering reach from TCP to Lijin, with a length of 300 km and channel gradient of 0.11‰. Because the length of the channel controlled by the river training works accounts for 70% of its total length, the migration of the main channel is restricted (Zheng, 2013). There are three hydrological stations, Huayuankou (HYK), Jiahetan (JHT), and GC, and 28 cross-sectional profiles in the braided reach (Table 1). Only the Sunkou (SK) hydrological station and 22 cross-sectional profiles are distributed in the transitional reach. In the meandering reach, there are three hydrological stations in Aishan (AS), Luokou (LK), and LJ and 42 cross-sectional profiles. Because the TCP is closer to the AS hydrological station, the SK-TCP reach and TCP-AS reach can be merged into the SK-AS reach to analyze the relationship between the incoming water and sediment conditions, and the cross-sectional geometry of the main-channel.

Figure 1.Figure 1
| Reach | Above HYK | HYK-JHT | JHT-GC | GC-SK | SK-TCP | TCP-AS | SK-AS | AS-LK | LK-LJ |
|---|
| River length (km) | 103.17 | 100.80 | 72.63 | 118.20 | 35.63 | 28.24 | 63.87 | 101.84 | 167.80 |
| Number of cross-sections | 11 | 10 | 7 | 13 | 9 | 7 | 16 | 13 | 22 |
Table 1.
The distribution of the cross-section in different reaches in the LYR
3 Data and methods
Data for daily discharge and SSC between 1965 and 2015 were collected at the eight mainstream hydrological stations (Xiaolangdi (XLD), HYK, JHT, GC, SK, AS, LK, and LJ) and two tributary hydrological stations (Heishiguan (HSG) and Wuzhi (WZ)). The pre- and post-flood cross-sectional data for the 92 sections between 1986 and 2015 (except pre-flood data in 2014) were also collected, in addition to data on the erosion of the main channel and sedimentation in different reaches of the LYR. These data were retrieved mainly from the Hydrological Yearbooks (YRCC, 1965-2015) and partly from the River Sediment Bulletin of China published by the Ministry of Water Resources. As the main part of sediment transport, the transport capacity of the main channel accounted for about 80% of the bankfull flooding capacity when the water level at a section rose to the bankfull level. Based on the measured cross-sectional data, we needed to determine the main-channel part from the full cross-sectional profile to analyze the variation in the main-channel geometry. In general, the lower elevation of the floodplain lips was defined as the bankfull level (Z). The part and the width between those two lips are often defined as the bankfull zone and the bankfull width, respectively. The deep depth part of the bankfull zone was defined as the main-channel zone and the corresponding width as the width of the main channel (W). The area of the deep part under the bankfull level was defined as the cross-sectional area of the main channel (A). The depth of the main channel (H) was calculated as the ratio of A to W. Because the cross-sections in the LYR with complex geometry had changed significantly, it was difficult to identify the bankfull level and main-channel zone in such sections, especially in the braided reach. Therefore, Figure 2 shows the cross-sectional profiles at Yiluohekou (located about 71.17 km downstream of the XLD dam) measured before the 1998 flood season, at HYK (129.67 km) measured before the flood season of 1986, at Xinzhai (165.72 km) measured after the flood season of 1997, and at Weicheng (182.57 km) measured after the flood season of 2009 in the braided reach. It is clear that the main-channel zones of the other three cross-sectional profiles were significantly smaller than that of the bankfull part, except for HYK. The pre- and post-flood main-channel geometries at the 92 sections between 1986 and 2015 were identified by using the method mentioned above.
Figure 2.Figure 2
Because there were large differences among the cross-sectional profiles along the LYR, the variation in cross-sectional geometry at a specific section could not represent the general variation in a specific reach. To compare cross-sectional adjustments in different sub-reaches of the LYR, the morphological parameters of the reach scale can be determined using the procedure proposed by Xia et al. (2014), by integrating the geometric mean based on the log transformation with a weighted average based on the spacing between consecutive sections. The corresponding main-channel geometry $\overline{{{G}_{mc}}}$of the reach scale can be written as follows:
where $\overline{{{G}_{mc}}}$is the main-channel geometry of the reach scale (width, depth, and geomorphic coefficient); N is the number of cross-sections in the studied reach with a channel length of L; i is the sequence of the cross-sections, i = 1, 2, …, N-1; and xi is the longitudinal distance at the ith section downstream of the dam.
4 Results
4.1 Flow and sediment regimes and main-channel sedimentation in the LYR
The sums of flow and sediment at the three hydrological stations of HSG, WZ, and XLD were taken as the incoming water and sediment inflows, respectively, of the LYR. The temporal variation in water and sediment conditions entering the LYR for 1965-2015 is shown in Figure 3. It is clear that the water and sediment conditions entering the LYR underwent significant changes since the Longyangxia Reservoir began operation in the upper reaches of the Yellow River in 1986. The amount of water and sediment loads between 1986 and 1999 were smaller than those before 1986, and the reduction mainly occurred in the flood season. The reduction proportion of the runoff was greater than that of sediment load, causing the SSC to increase. The average SSC during the flood events was generally greater than 100 kg/m3, and the incoming sediment coefficient clearly increased, and was as high as 0.15 kg×s/m6 in the flood season of 1998. The annual volume of water entering the LYR after the impoundment of the XLDR was the same as that for 1986-1999. However, due to the regulation of the XLDR, the volume of water in the flood season decreased but that in the non-flood season increased, resulting in it being significantly greater in the non-flood season than in the flood season. Because the sediment was intercepted by the XLDR, and had a total volume of 3 billion m3, the sediment load entering the LYR decreased sharply. The average sediment load and SSC in the flood season during 2000-2015 were 60 million tons and 6.45 kg/m3, respectively.
Figure 3.Figure 3
Owing to the significant variations in the water and sediment regimes since 1986, the main channel of the LYR experienced two distinct periods before and after the commencement of operation of the XLDR: a continual siltation for the period 1986-1999, and a continual scouring for the period 2000-2015. The temporal variations in cumulative erosion and sedimentation in the main channel per unit length of the river in different reaches of the LYR are shown in Figure 4. Except for the reach above HYK, the intensities of erosion and sedimentation in the main channel decreased downstream of the river, and that for the reach from HYK to JHT was the largest, and for the reach below SK decreased slightly. Because the downstream propagation of erosion by clear water would have taken a certain amount of time, the main channel in the reaches above HYK and HYK-JHT began to be prominently scoured in 2000, while that for the JHT-GC and GC-SK reaches was in 2003. The values of the cumulative sedimentation volume of the main channel per unit length of the river for above the HYK, HYK-JHT, JHT-GC, and GC-SK reaches for 1986-1999 were 3100 m3, 6700 m3, 4800 m3, and 2000 m3, respectively, accounting for 78% of the total siltation of the LYR; and the corresponding values of the cumulative erosion volume of the main channel for those four reaches for 2000-2015 were 4100 m3, 6300 m3, 3200 m3, and 1700 m3, accounting for 81% of the total erosion of the LYR. In general, the main channel for different reaches below HYK for 1986-2015 slightly silted except for the reach above HYK, with slight erosion.
Figure 4.Figure 4
4.2 Temporal and spatial variations in main-channel geometry in LYR
Based on the pre- and post-flood cross-sectional data of the 92 selected sedimentary sections along the LYR from 1986 to 2015, the main-channel cross-sectional geometries (W, H, and geomorphic coefficient$\xi ={{{B}^{0.5}}}/{H}\;$) for every selected section were calculated based on the method of identifying the main channel mentioned above. Then, the main-channel dimension of the reach scale were obtained using Equation (1) proposed by Xia et al. (2014).
4.2.1 Variations in main-channel geometry before impoundment of XLD Reservoir
(1) Width of main channel. Figure 5 shows the temporal variation in the width of the main channel from 1986 to 1999 for seven reaches. It is clear that the width of the reach scale of the main channel decreased downstream, except in the upper reach above HYK, and that different reaches showed a decreasing trend. Compared with that before the flood season in 1986, the values of the width of the main channel after the flood season in 1999 for seven reaches—XLD-HYK, HYK-JHT, JHT-GC, GC-SK, SK-AS, AS-LK, and LK-LJ—decre- ased by 771 m, 1687 m, 1195 m, 349 m, 209 m, 119 m, and 105 m, respectively. For the three sub-reaches above GC, the width of the main channel remained unchanged before 1988, and then decreased sharply in the flood season of 1988, followed by a significant reduction from 1989 to 1992; the rates of decrease slowed after 1993. For the four sub-reaches below GC, the width of the main channel showed a stepwise reduction, with a prominent reduction mainly occurring in the flood seasons of 1992 and 1998 in addition to the flood season of 1988 for the GC-SK reach. Clearly, the break point of variation in the width of the main channel along the LYR for the period 1986-1989 was located near the SK station, and moved up to the GC station.
Figure 5.Figure 5
(2) Depth of main channel. Figure 6 shows the temporal variation in the depth of the main channel in the seven reaches for 1986-1999. It is clear that the depth of the reach scale of main channel for the HYK-LK reach decreased along the river, followed by a slight increase for the LK-LJ reach, and that in the seven reaches exhibit an overall trend of decrease. Compared with that before the flood season in 1986, the values of the depth of the main channel after the flood season in 1999 for the seven reaches—XLD-HYK, HYK-JHT, JHT-GC, GC-SK, SK-AS, AS-LK, and LK-LJ—decreased by 0.30 m, 0.16 m, 0.43 m, 0.94 m, 0.96 m, 1.06 m, and 1.07 m. For the three sub-reaches above GC, the depth of the main channel generally increased in the non-flood season and decreased in the flood season with a prominent seasonal fluctuation. However, when a hyper-concentrated flood occurred in the flood season, the main channel sharply narrowed and its depth increased—for example, in the flood season in 1992. Clear increases in the depth of the main channel occurred in the flood season of 1988, the non-flood season of 1993, and in 1996 for the reaches of HYK-JHT and JHT-GC, and in the flood seasons of 1988, 1992, 1996, and 1998 for the sub-reaches below GC due to the occurrence of hyper-concentrated floods. It can be concluded that the variations in depth of the main channel for different reaches above GC were more consistent, while those for different reaches below GC were more consistent.
Figure 6.Figure 6
4.2.2 Variations in main-channel geometry after impoundment of XLD Reservoir
(1) Width of main channel. Temporal variations in the width of the main channel in seven reaches from 2000 to 2015 are shown in Figure 7. It is clear that the width of the reach scale of the main channel generally showed an increasing trend for the three sub-reaches above GC, with the rate of increase slowing down after 2012, whereas it first decreased before 2003 and then increased for the four sub-reaches below GC. Compared with that before the flood season in 2000, the values of the width of the main channel after the flood season in 2015 for the seven reaches of XLD-HYK, HYK-JHT, JHT-GC, GC-SK, SK-AS, AS-LK, and LK-LJ, increased by 392 m, 674 m, 265 m, 88 m, 41 m, 29 m, and 25 m, respectively. The increments in the width of the main channel for the sub-reaches above GC were clearly larger than those for sub-reaches below GC.
Figure 7.Figure 7
(2) Depth of main channel. Figure 8 shows temporal variations in the depth of the main channel for the seven reaches from 2000 to 2015. It is clear that the depth of the main channel downstream of the LYR first decreased for sub-reaches above GC and then increased for the sub-reaches from GC to LK, followed by a slight decrease for the LK-LJ reach. The depth of the main channel for different reaches exhibited an overall trend of increase. Compared with that before the flood season in 2000, values of the depth of the main channel after the flood season in 2015 for the seven reaches of XLD-HYK, HYK-JHT, JHT-GC, GC-SK, SK-AS, AS-LK, and LK-LJ increased by 1.92 m, 2.31 m, 2.26 m, 2.52 m, 2.04 m, 2.26 m, and 2.24 m, respectively. Increments in the depth of the main channel were around 2 m. The depth of the main channel for the sub-reaches above GC increased rapidly from 2000 to 2006, and the rates of increase then slowed after 2006. The depth of the main channel for sub-reaches from GC to LK began to increase in 2003 while the reach from LK to LJ started in 2001.
Figure 8.Figure 8
4.2.3 Temporal variation in the cross-sectional geomorphic coefficient of the main channel
Figure 9 shows the temporal variations in the cross-sectional geomorphic coefficient of the main channel for seven reaches from 1986 to 2015. It is clear that the geomorphic coefficient decreased downstream of the LYR except in the upper reach above HYK. The geomorphic coefficient for sub-reaches above GC exhibited a decreasing trend, and their rates of reduction from 1986 to 2001 were larger than those from 2002 to 2015. However, the geomorphic coefficient for sub-reaches below GC increased from 1986 to 2001 and then decreased from 2002 to 2015. The reason for the significant differences in the variation in the geomorphic coefficient between above-GC sub-reaches and below-GC sub-reaches is differences in the rates of adjustment in the width and depth of the main channel responding to changes in water and sediment conditions.
Figure 9.Figure 9
To further analyze the similarities and differences in the cross-sectional geomorphic coefficient of the main channel among different reaches of the LYR in the two distinct periods before and after the impoundment of the XLDR, based on the post-flood values of the main-channel geometries (width, depth, and geomorphic coefficient) of 1986, 1999, and 2015 (see Appendix Table 1), the statistical parameters (relative values and changing rates) are shown in Table 2. Because $\xi $ was equal to the ratio of B0.5 to H, the relative value of the geomorphic coefficient of the main channel ${{y}_{\xi }}={{\xi }_{end}}/{{\xi }_{initial}}$ was equal to the ratio of the relative value of the width of the main channel ${{y}_{{{B}^{0.5}}}}=B_{end}^{0.5}/{{B}_{initial}}^{0.5}$to the relative value of its depth ${{y}_{H}}={{H}_{end}}/{{H}_{initial}}$, i.e., ${{y}_{\xi }}={{y}_{{{B}^{0.5}}}}/{{y}_{H}}$. Thus, the direction of adjustment of the geomorphic coefficient was identical to that of the width of the main channel and opposite to that of its depth, meaning that the geomorphic coefficient increased with increasing width of the main channel and decreasing depth. On the contrary, it decreased with the decreasing width of the main channel and increasing depth. When the width and depth of adjustments in the main channel were in the same direction, the direction of adjustment of the geomorphic coefficient was consistent with the larger adjustment rates of the width and depth of the main channel.
Table Infomation Is Not Enable
| Periods | Variables | Above HYK | HYK-JHT | JHT-GC | GC-SK | SK-AS | AS-LK | LK-LJ |
|---|
| 1986-1999 | ${{y}_{{{B}^{0.5}}}}$ | 0.75 | 0.56 | 0.55 | 0.76 | 0.82 | 0.87 | 0.88 |
| ${{y}_{H}}$ | 1.03 | 0.98 | 0.92 | 0.72 | 0.73 | 0.78 | 0.74 |
| ${{y}_{\xi }}$ | 0.73 | 0.57 | 0.60 | 1.06 | 1.13 | 1.12 | 1.19 |
| ${{y}_{{{B}^{0.5}}}}\text{-}1$ | -0.25* | -0.44* | -0.45* | -0.24 | -0.18 | -0.13 | -0.12 |
| ${{y}_{H}}\text{-}1$ | 0.03 | -0.02 | -0.08 | -0.28* | -0.27* | -0.22* | -0.26* |
| 2000-2015 | ${{y}_{{{B}^{0.5}}}}$ | 1.21 | 1.40 | 1.24 | 1.07 | 1.06 | 1.02 | 1.03 |
| ${{y}_{H}}$ | 2.57 | 2.34 | 2.15 | 2.20 | 1.77 | 1.59 | 1.71 |
| ${{y}_{\xi }}$ | 0.47 | 0.60 | 0.58 | 0.49 | 0.60 | 0.64 | 0.60 |
| ${{y}_{{{B}^{0.5}}}}\text{-}1$ | 0.21 | 0.40 | 0.24 | 0.07 | 0.06 | 0.02 | 0.03 |
| ${{y}_{H}}\text{-}1$ | 1.57* | 1.34* | 1.15* | 1.20* | 0.77* | 0.59* | 0.71* |
Table 2.
Statistical parameters of the cross-sectional geometry of the main channel before and after the XLDR began operation
Table 2 shows that for 1986-1999, before the operation of the XLDR, the widths of the main channel for the seven sub-reaches decreased to different extents, and its depths for six sub-reaches below HYK also decreased, except for a slight increase in the reach above HYK. The width of the main channel B0.5 for the sub-reaches above GC decreased by about 40%, which was significantly greater than the decreasing proportion of the depth of the main channel. Thus, the decreasing width of the main channel determined the reduction in the geomorphic coefficient. For the reach below GC, the depth of the main channel decreased by about 25%, slightly larger than the decreasing proportion of the width of the main channel. Thus, the decreasing depth of the main channel determined the slight increase in the geomorphic coefficient. For the period 2000-2015, after the impoundment of the XLDR, the depth of the main channels for the seven sub-reaches increased by about 60%, significantly greater than the increasing proportion of the width of the main channel. Thus, the geomorphic coefficient determined by the increasing depth of the main channel had a decreasing trend. It can be concluded that before the operation of the XLDR, the main channel mainly narrowed in the transverse direction for the sub-reach above GC while it primarily silted in the vertical direction for the sub-reach below GC. After the impoundment of the XLDR, the deepening intensity in the vertical direction in all sub-reaches was greater than the widening intensity in the transverse direction.
4.3 Patterns of adjustment of main channel in LYR
To show more clearly the adjustment in the main channel of the LYR, three typical cross-sectional profiles at HYK, GC, and SK in seven typical measured times (1986, 1989, 1994, 1999, 2005, 2010, and 2015) are shown in Figure 10. The width of the main channel of HYK in 1986 and 1989 was about 2200 m, and had narrowed to 1050 m by 1994. Following this, the main channel migrated frequently with little change in width and siltation, and erosion in the vertical direction, and a prominent deep groove was formed in 2015. The main channel at the GC station narrowed prominently from 1986 to 1989 and then mainly silted in the vertical direction from 1990 to 2004, followed by a slight increase in the width of the main channel and prominent increase in its depth from 2005 to 2015. The adjustment in the main channel at the SK station occurred mainly in the vertical direction with no prominent change in width of the main channel.
Figure 10.Figure 10
From the variation in the main-channel geometry, it is clear that the main channel in different sub-reaches silted to different extents during the continuous siltation period before the impoundment of the XLDR. At the same time, the floodplain also silted due to the over-bank flood, especially in the braided reach, which resulting in the bankfull water level rising (Zhang and Shen, 2017; Zhang et al., 2017). Compared with that before the flood season in 1986, the width of the main channel after the flood season in 1999 in seven reaches, such as above HYK, HYK-JHT, JHT-GC, GC-SK, SK-AS, AS-LK, and LK-LJ, decreased by 47%, 68%, 68%, 41%, 33%, 24%, and 23%, respectively. At the same time, the depths of the main channel for those seven sub-reaches decreased by 14%, 9%, 19%, 37%, 27%, 23%, and 27%, respectively. The geomorphic coefficient of the main channel for three upper sub-reaches —above HYK, HYK-JHT, and JHT-GC—decreased by 15%, 29%, and 29%, respectively while that for four lower sub-reaches—GC-SK, SK-AS, AS-LK, and LK-LJ—increased by nearly 15%. In general, the main channel in all sub-reaches of the LYR narrowed in the transverse direction and silted in the vertical direction with decreasing width and depth of the main channel. Considering the differences in the adjustment of the intensity of the main channel among the sub-reaches, the pattern of adjustment of the main channel during the continual siltation period can be generalized into three types, as shown in Figure 11a: Drastic shrinkage in the transverse direction and the vertical siltation in the braided reach above GC, prominent transverse shrinkage and vertical siltation in the transitional reach from GC to AS, and mainly vertical siltation in the meandering reach below AS.
Figure 11.Figure 11
Similarly, during the continuous scouring period from 2000 to 2015, compared with that in 1999, the post-flood widths of the main channels in 2015 in the seven sub-reaches successively increased by 46%, 96%, 53%, 14%, 13%, 4%, and 6%, respectively. At the same time, the depths of the main channel for those seven sub-reaches successively increased by 157%, 134%, 115%, 120%, 77%, 59%, and 71%, respectively. The adjustment of the main channel in the sub-reaches above AS occurred through transverse widening and vertical deepening, while that in the sub-reaches below AS occurred mainly by vertical deepening. The pattern of adjustment of the main channel in the continuous scouring period can be generalized into the three types shown in Figure 11b: Clearly, there was widening in the transverse direction and vertical scouring in the braided reach above GC, slight widening in the transverse direction and vertical siltation in the transitional reach from GC to AS, and mainly vertical scouring in the meandering reach below AS.
4.4 Factors influencing the adjustment of main channel in LYR
The incoming water and sediment conditions were the main factors influencing the evolution of the channel and adjustment of cross-sectional geometry. When SSC was greater than the sediment transport capacity, the sediment in the flow exceeding the capacity settled, resulting in transverse or vertical siltation with a reduction in the width of the main channel or its depth. On the contrary, when SSC in flow was less than the sediment carrying capacity, the sediment at the bottom or the bank of the riverbed eroded, and the main channel adjusted mainly by transversely widening or vertically deepening.
Owing to the rapid adjustment of the dimensions of the main channel over a year in the LYR, the average of the pre- and post-flood parameters of geometries of the main channel were taken as the annual values to analyze the response of the main-channel geometry to the water and sediment conditions. Because of the limit on the bedrock to erosion, the adjustment of the main channel in the reach above HYK was different from that in the sub-reaches from HYK to GC. Due to differences of the adjustment of the main channel among the different sub-reaches, the LYR was divided into four sub-reaches, such as the braided reach from HYK to GC, the two transitional reaches of GC-SK and SK-AS, and the meandering reach from AS to LJ. The main-channel geometries in those four sub-reaches were calculated using Equation (1).
The relationships between the cross-sectional geomorphic coefficient of the main channel with annual discharge and SSC are shown in Figure 12. Although the relationship between the geomorphic coefficient and the given year’s water and sediment conditions was relatively scattered, it reflected the relationship because the adjustment of the main channel delayed changes in the incoming flow conditions. The adjustment of the bankfull channel in the LYR was affected not only by flow conditions in the given year, but also by those in the previous five years (Wu et al., 2007, 2008).
Figure 12.Figure 12
The cross-sectional geomorphic coefficient of the main channel in the braided reach was positively correlated with the discharge and negatively correlated with SSC during the continual siltation period, that is, the cross-section was wider and shallower with larger discharge and smaller SSC; however, it was negatively correlated with the discharge and positively correlated with SSC during the continual scouring period, that is, the cross-section was narrower and deeper with larger discharge and smaller SSC. The reason for this difference was different initial cross-sectional profiles. The wide and shallow cross-section formed by the flood responded to the moderate discharge and hyper-concentrated flood mainly by the narrowing in the transverse direction due to the sediment silted on both sides of the main channel with a small flow velocity. The intensity of adjustment of the width of the main channel with respect to the hyper-concentrated flood was larger than that of the depth of the main channel, because of which the adjustment in the geomorphic coefficient was consistent with that in the width of the main channel. The initial cross-section of the continual scouring period for 2000-2015 was relatively narrow and deep, formed by the hyper-concentrated flood. The response of the main channel to the changing water regime with very low SSC and moderate, middle discharge was to vertically deepen and transversely widen. Owing to a lack of large floods, the intensity of adjustment of the width of the main channel was lower than that of the depth of the main channel, which caused a decrease in geomorphic coefficient as it was dominated by the increasing depth of the main channel.
For the transitional and meandering reaches, the cross-sectional geomorphic coefficient of the main channel was negatively correlated with the discharge and positively correlated with SSC in two distinct periods, that is, the cross-section was narrower and deeper with larger discharge and smaller SSC. This is because the main channel in those reaches was relatively stable. The intensity of adjustment of the depth of the main channel to the changing inflow conditions was mostly larger than that of the width of the main channel, because of which the adjustment of the geomorphic coefficient was consistent with that of the depth of the main channel. The differences in these relationships between the two periods 1986-1999 and 2000-2015 were caused by the large difference of SSC between them. As the depth of the main channel increased with discharge, it decreased due to the relatively high SSC for the period 1986-1999 but increased due to the very low SSC for 2000-2015. As a result, the cross-sectional geometry of the main-channel changed from wide and shallow to relatively narrow and deep, and the corresponding geomorphic coefficient under the same discharge was smaller than the former. Overall, in the transitional reach, the main channel in the reach from GC to SK was consistent with that in the upper braided reach, while that in the reach from SK to AS was consistent with that in the lower meandering reach.
The relationships between parameters of the main channel, and cumulative erosion and sedimentation per unit length of river in the seven sub-reaches are shown in Figure 13. It is clear that the rate of decrease in the width of the main channel during the siltation period in the braided reach was the same that of its increase in the scouring period, while the rates of decrease in the other reaches were larger. The relationship between the width of the main channel and its cumulative sedimentation was in the form of a clockwise loop. Because the rate of decrease in the depth of the main channel in the siltation period was smaller than the rate of increase, the relationship between the depth of the main channel and its cumulative sedimentation was in the form of an anticlockwise loop. The cross-sectional geomorphic coefficient of the main channel in braided reach decreased in the siltation and scouring periods, where the rate of decrease in the siltation period was larger than that in the scouring period. However, the cross-sectional geomorphic coefficients of the main channel in the other sub-reaches increased in the siltation period and decreased in the scouring period, and the rates of increase in the former were slightly smaller than the rates of decrease in the latter.
Figure 13.Figure 13
It can be concluded that although the adjustment in the main-channel geometry was theoretically reversible (Yao et al., 2015), its cross-sectional geometry changed from wide and shallow to relatively narrow and deep after the cumulative erosion and sedimentation were restored to zero in the continual siltation and scouring from 1986 to 2015. This indicates that although the width and depth of the main channel decreased in the siltation period and increased in the scouring period, the differences between their rates of increase in the scouring period and those of decrease in the siltation period caused the main-channel geometry to be unable to return to its initial state. If the main-channel geometry were to be restored to its original state, only the balance of erosion and sedimentation is not enough, and the specific incoming water and sediment conditions are also needed. If the main-channel geometry formed by a decrease in the width of the main channel in the siltation period were to be restored to the wide and narrow state, long-term flow with large discharge and low SSC would be needed to erode the banks on both sides. The shrunken main channel was adjusted mainly by deepening in the vertical direction under long-term inflow with medium-to-small discharge, such as in the adjustment of the braided reach once the XLDR was operational. It is clear that the relationship between the pattern of adjustment of the main channel and intensity, and factors influencing it is extremely complicated, and is closely related to the incoming water and sediment processes (Xu and Zhang, 2000; Zhang et al., 2002). Their quantitative relationship needs to be further explored in the future.
5 Conclusions
The adjustments to the main-channel geometry in different reaches of the LYR, and their responses to the changing water and sediment conditions were analyzed over a period of continual siltation and scouring before and after the XLDR began operation. The results of this study lead to the following three conclusions:
(1) Before the operation of the XLDR from 1986 to 1999, the main channels in all the sub-reaches shrunk continually with decreasing width and depth. In the sub-reaches above Gaocun, the rate of decrease of the width of the main channel was larger than that of its depth, which caused the cross-sectional geomorphic coefficient to decrease. By contrast, for sub-reaches below Gaocun, the rate of decrease of the width of the main channel was smaller than that of the depth of the main channel, resulting in a slight increase in the cross-sectional geomorphic coefficient. The pattern of adjustment of the main channel during the continual siltation period can be generalized into three types: drastic shrinkage in the transverse direction and vertical siltation in the braided reach, prominent transverse shrinkage and vertical siltation in the transitional reach, and mainly vertical siltation in the meandering reach. Following the initiation of operation of the XLDR from 2000 to 2015, the main channel eroded continually, and the width and depth of the main channel increased. The increase in the rate of depth of the main channel in all the sub-reaches was greater than that in width of the main channel, which caused the cross-sectional geomorphic coefficient to decrease. The pattern of adjustment of the main channel during the scouring period can be generalized into three types: prominent widening and vertical scouring in the braided reach, slight widening and vertical scouring in the transitional reach, and mainly vertical scouring in the meandering reach.
(2) The responses of the main-channel geometry to the changing water and sediment conditions were different before and after the XLDR began operation. For the braided reach, the cross-sectional geomorphic coefficient had a negative relationship with discharge and a positive relationship with SSC before the operation of the XLDR. However, it had a positive relationship with discharge and had a negative relationship with SSC after the operation of the XLDR. For the transitional and meandering reaches, the cross-sectional geomorphic coefficient had a negative relationship with discharge and had a positive relationship with SSC. The rate of increase in width of the main channel in the scouring period was smaller than its rate of decrease in the siltation period. On the contrary, the rate of increase in the depth of the main channel was greater than its rate of decrease. The cross-sectional geometry of the main channel changed from wide and shallow to relatively narrow and deep after continual siltation and scouring periods, and had not been restored to its initial state.
(3) The relationships between the adjustment of the main channel in the LYR and factors influencing it, including the incoming water and sediment conditions, and erosion and sedimentation, are complex, and their quantitative relationships are needed to be further studied in future research.
References
[1] Z X Chu. The dramatic changes and anthropogenic causes of erosion and deposition in the lower Yellow (Huanghe) River since 1952. Geomorphology, 216, 171-179(2014).
[2] B L Cui, X L Chang, W Y Shi. Abrupt changes of runoff and sediment load in the lower reaches of the Yellow River, China. Water Resources, 41, 252-260(2014).
[3] S V M Dirk, M Yang, Z B Wang. Predicting the morphodynamic response of silt-laden rivers to water and sediment release from reservoirs: Lower Yellow River, China. Journal of Hydraulic Engineering, 137, 90-99(2011).
[4] D X Kong, C Y Miao, J W Wu et al. Bi-objective analysis of water-sediment regulation for channel scouring and delta maintenance: A study of the Lower Yellow River. Global and Planetary Change, 133, 27-34(2015).
[5] D X Kong, C Y Miao, J W Wu et al. The hydro-environmental response on the lower Yellow River to the water-sediment regulation scheme. Ecological Engineering, 79, 69-79(2015).
[6] J Li, J Q Xia, M L Zhou et al. Variation in reach-scale thalweg-migration intensity in a braided reach of the Lower Yellow River in 1986-2015. Earth Surface Processes and Landforms, 42, 1952-1962(2017).
[7] Z C Lu, S F Chen, H Chen. The evolutionary tendency forecast of channel morphology and river state of the wandering braided rivers in the Lower Yellow River. Acta Geographica Sinica, 55, 729-736(2000).
[8] Y X Ma, H Q Huang, G C Nanson et al. Channel adjustments in response to the operation of large dams: The upper reach of the Lower Yellow River. Geomorphology, 147/148, 35-48(2012).
[9] C Y Miao, D X Kong, J W Wu et al. Functional degradation of the water-sediment regulation scheme in the Lower Yellow River: Spatial and temporal analyses. The Science of the Total Environment, 551/552, 16-22(2016).
[10] J Peng, S L Chen, P Dong. Temporal variation of sediment load in the Yellow River basin, China, and its impacts on the lower reaches and the river delta. Catena, 83, 135-147(2010).
[11] J Peng, S L Chen, F Liu et al. Erosion and siltation processes in the Lower Yellow River during different river courses into the sea. Acta Geographica Sinica, 65, 613-622(2010).
[12] Z Y Sun, W Z Wang, Y Li et al. Can the narrowing of the Lower Yellow River by regulation result in non-siltation and even channel scouring?. Journal of Geographical Sciences, 26, 1337-1348(2016).
[13] S M Tian, W H Wang, B F Xie et al. Fluvial processes of the downstream reaches of the reservoirs in the Lower Yellow River. Journal of Geographical Sciences, 26, 1321-1336(2016).
[14] H J Wang, N S Bi, Y Saito et al. Recent changes in sediment delivery by the Huanghe (Yellow River) to the sea: Causes and environmental implications in its estuary. Journal of Hydrology, 391, 302-313(2010).
[15] H J Wang, X Wu, N S Bi et al. Impacts of the dam-orientated water-sediment regulation scheme on the lower reaches and delta of the Yellow River (Huanghe): A review. Global and Planetary Change, 157, 93-113(2017).
[16] H J Wang, Z S Yang, Y Saito et al. Stepwise decreases of the Huanghe (Yellow River) sediment load (1950-2005): Impacts of climate change and human activities. Global and Planetary Change, 57, 331-354(2007).
[17] S J Wang, Y K Li. Channel variations of the different channel pattern reaches in the Lower Yellow River from 1950 to 1999. Quaternary International, 244, 238-247(2011).
[18] B S Wu, J Q Xia, X D Fu et al. Effect of altered flow regime on bankfull area of the Lower Yellow River, China. Earth Surface Processes and Landforms, 33, 1585-1601(2010).
[19] B S Wu, L Y Li. Characteristics of cross-section in the lower channel of the Yellow River. Yellow River, 30, 15-16, 79(2008).
[20] B S Wu, G Q Wang, J Q Xia et al. Response of bankfull discharge to discharge and sediment load in the Lower Yellow River. Geomorphology, 100, 366-376(2008).
[21] B S Wu, J Q Xia, Y F Zhang. Response of bankfull discharge to variation of flow discharge and sediment load in lower reaches of Yellow River. Journal of Hydraulic Engineering, 38, 886-892(2007).
[22] J Q Xia, X J Li, X L Zhang et al. Recent variation in reach-scale bankfull discharge in the Lower Yellow River. Earth Surface Processes and Landforms, 39, 723-734(2014).
[23] J Q Xia, X L Zhang, Z H Wang et al. Modelling of hyper-concentrated flood and channel evolution in a braided reach using a dynamically coupled one-dimensional approach. Journal of Hydrology, 561, 622-635(2018).
[24] X H Xia, J W Dong, M H Wang et al. Effect of water-sediment regulation of the Xiaolangdi Reservoir on the concentrations, characteristics, and fluxes of suspended sediment and organic carbon in the Yellow River. The Science of the Total Environment, 571, 487-497(2016).
[25] J X Xu, O Y Zhang. Complicated fill-scour behaviors of the Huanghe River and the channel forming processes. Acta Geographica Sinica, 55, 274-280(2000).
[26] T Yang, Q Zhang, Y D Chen et al. A spatial assessment of hydrologic alteration caused by dam construction in the middle and lower Yellow River, China. Hydrological Processes, 22, 3829-3843(2010).
[27] W Y Yao, H X Zhang, Z J Hou et al. Discussion on the reversibility of the river channel shrinking in the Lower Yellow River. Proceedings of the 2nd International Yellow River Forum on Keeping Healthy Life of the River, 4, 197-204(2015).
[28] . Yellow River Sediment Bulletin(20002015).
[29] M Zhang, H Q Huang, P A Carling et al. Sedimentation of overbank floods in the confined complex channel-floodplain system of the Lower Yellow River, China. Hydrological Processes, 31, 3472-3488(2017).
[30] O Y Zhang, J X Xu, H W Zhang. The response of the channel form adjustment at the wandering-braided reaches of the Lower Yellow River to flood events. Journal of Sediment Research, 1-7(2002).
[31] Y F Zhang, G Q Shen. Regulation indices of hyperconcentrated floods in the Lower Yellow River. Journal of Sediment Research, 42, 25-30(2017).
[32] S Zheng. Study on the simulation of non-equilibrium fluvial processes. Beijing: Tsinghua University(2013).
[33] S Zheng, S S Han, G M Tan et al. Morphological adjustment of the Qingshuigou channel on the Yellow River Delta and factors controlling its avulsion. Catena, 166, 44-55(2018).