Abstract
The temporal evolution of Nd:YAG laser-produced Sn plasma in atmospheric pressures from 5 to is investigated. The results show that the extreme ultraviolet radiation exists only at the beginning of the expansion process for 20 ns. The maximum temperature of 18.7 eV and density of are measured at 73 ns. The effects of air pressure and laser energy on the process of plasma expansion are investigated. The results indicate that the air pressure has an inhibitory effect on kinetic energy, while the electron density and temperature increase with air pressure.Laser-produced plasma (LPP) is used for numerous applications, such as laser-induced breakdown spectroscopy (LIBS)[1,2], x ray imaging[3,4], and extreme ultraviolet (EUV) light source[5], which is one of the most promising options for next-generation lithography. There are numerous diagnostic techniques that can be employed to study the characteristics of LPP, such as optical emission spectroscopy (OES)[6], laser-induced fluorescence (LIF)[7], laser-absorption spectroscopy (LAS)[8], interferometry, mass spectrometry, ICCD fast photography[9,10]. Imaging photography technology and OES are two versatile techniques for plasma diagnostics. Imaging technology[11] can get intuitive information on the expansion of plasma, such as particle velocity and OES, which is a method to diagnose the plasma temperature, density, and chemical composition from the plasma emission spectrum.
To gain a better understanding of the LPP, many studies have been discussed on plasma plume expansion, spectrum, EUV emission, etc. Previously, Harilal et al.[12] studied the evolution and the characters of tin plasma with the Nd:YAG laser using OES. The electron temperature and density rapidly decreased at the early stage of plasma evolution. Shaikh et al.[13] investigated the evolution of the electron temperature and density of Sn plasma produced by a laser using a one-dimensional OES method. They found that the electron temperature and density were measured to be within 1.13 to 0.53 eV and to , respectively, at a laser intensity of . Freeman et al.[14] studied the dynamics of plasma evolution and characteristics of the emission spectra from ns and fs LPP in both atmospheric and vacuum conditions using optical imaging and spectroscopic techniques. They observed that the expansion of ns LPP displayed a wider angular distribution, fs LPP expanded in a narrower angular distribution in the same air conditions. They found that all ns LPP emission spectra showed transition lines from lower-charged ions, while fs LPP emission spectra were dominated only by neutral species emissions. Polek et al.[15] studied the spatial and temporal evolution of Al plasma produced by a 1.06 μm Nd:YAG laser using OES. They observed that a large electron density gradient was seen mostly at times earlier than 200 ns. Wu et al.[16] studied the behavior of the Sn plasma plume expanding into different ambient gases. They[17] also investigated the space evolution of Sn plasma produced by a 10.6 μm laser using the two-dimensional OES method. The results show that the space-averaged electron temperature was measured in the range of 3.4–1.0 eV, and the space-averaged electron density was measured in the range of to , as the time delay varied from 1.6 to 3.6 μs with respect to the pulse discharge.
In this Letter, the time relationship between the incident laser and the optical emission (the EUV, the plume expansion, and the spectrum) has been investigated. Meanwhile, the time sequence images of the plasma plume and the emission spectrum were given. The variations of the plasma parameters such as particle kinetic energy, electron density, and temperature in the expansion process can be analyzed. Subsequently, the evolution of Sn plasma with the air pressure ranging from 5 to and different incident laser energies have been investigated.
Sign up for Chinese Optics Letters TOC. Get the latest issue of Chinese Optics Letters delivered right to you!Sign up now
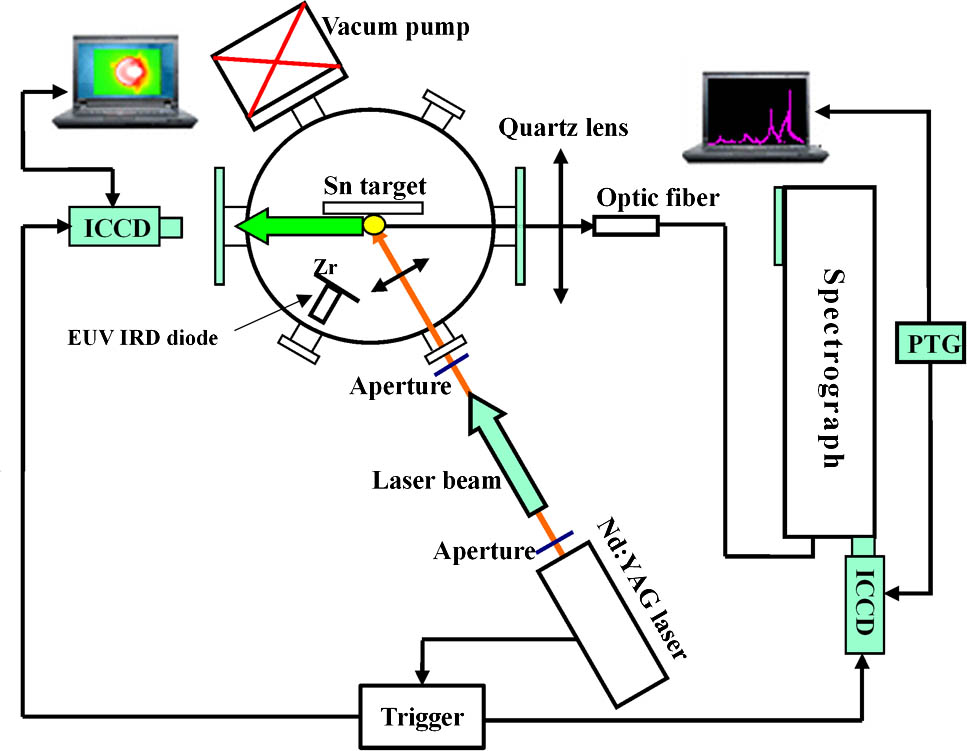
The schematic of the experimental setup is given in Fig. 1. The laser used in the experiments was a Nd:YAG laser working at the fundamental wavelength of 1064 nm and it was operated at 10 Hz. A 5 mm-thick and 100 mm diameter Sn target (99.95%) is mechanically rotated in a vacuum chamber, which was evacuated to 3.6 Pa. The laser beam was focused onto the target through a 100 mm plano–convex lens. The incident angle of the laser was 30° off from the normal direction of the target. A peak power density of was produced by a laser pulse energy of 216 mJ and delivered into a spot of 100 μm diameter on the sample surface to create the plasma plume.

Figure 1.Schematic of the experimental setup used for ICCD imaging and OES of a Nd:YAG laser-produced Sn plasma.
The plasma plume expansion was imaged by an ICCD (PI-MAX-1300) system which was equipped with an objective lens (Nikon Nikkor , F/2.8). The gate width of the ICCD was set at the minimum of 7 ns in the experiments. Gated ICCD imaging provides a direct measurement of the emission intensity of the plasma. The integrated emission intensity reveals the particle density of the plasma. A programmable timing generator (PTG) was used to synchronize the ICCD camera with the laser trigger.
The emission spectrum from the Sn plasma was accepted by a Princeton SP2750i spectrograph, which was operated with a grating. The chosen wavelength, centered at 550 nm, ranged from 500 to 600 nm. A PI-MAX-1300 ICCD camera was installed at the exit of the spectrograph. By varying the delay of the ICCD’s gate, we can track the temporal evolution of the plasma. To keep synchronized with the plume expansion, the gate width of the ICCD also was set at 7 ns and the same delay time was used for both ICCD imagings. The trigger signal from the laser synchronized the laser beam and the ICCD system. When the laser controller generated a trigger, the images of the plasma plume and the emission spectrum were sent to the computer and displayed at the same time.
An EUV International Radiation Detector (IRD) diode (AXUVHS5 #) was placed at a distance of 160 mm from the target with an angle of 60° respect to the target normal. A 500 nm thick calibrated zirconium metal filter was used in the spectrometer to select wavelengths from 6.5 to 16.8 nm.
To analyze the temporal evolution of Sn plasma, we first studied the time relationship between the system signal. In this section, the incident laser was maintained at 130 mJ and the pressure was 50 Pa. We take the time delay of the wire and other systems for both electronic and optical signals into consideration. Figure 2 shows the laser and EUV signals in an oscilloscope. After 200 ns of the laser’s PC (Pockels Cells) trigger signal, the laser has reached the Sn target and it can be used as a time start; the measurement of the laser’s full width at half-maximum (FWHM) is 8 ns. The EUV signal is the delayed laser signal, about 12 ns.
Figure 2.EUV and laser waveform in an oscilloscope.
From the optical emission spectrum in Fig. 3, it was noticed that there existed only a continuous spectrum at the prime time of the plasma duration. As time evolves, the plasma plumeis expanding rapidly outward and the intensity of the spectrum is getting stronger. At the delay time of 38 ns, the plasma plume has the largest scale. Meanwhile, the separated line spectrum was detected. After 38 ns, the intensity of the plume size was weakened, and it expanded outward slightly. The intensity of the continuous spectrum was weakened and the line spectrum dominated the whole spectrum. The line spectrum experienced a significant increase and then decreased through the process. Combining Fig. 2 with Fig. 3, we can conclude that the first optical emission was captured at the 10 ns delay time; this delay is due to the processes happening in ns laser-matter interaction, including laser absorption on the surface and material excitation, temperature rise, surface melting, and ablation. At the delay time of 12 ns, the EUV signal has been generated and lasted for about 20 ns. The EUV signal has delayed the first frame of the plasma expansion by about 2 ns.
Figure 3.Time evolution of Sn plasma expansion and the emission spectrum with an air pressure of 50 Pa and laser energy of 130 mJ.
ICCD images clearly show the plasma expansion morphology. Figure 4 shows the evolution of the boundary particle kinetic energy. The particle kinetic energy was computed by multiplying the half atomic mass times the square of the speed, obtained from the position of the plasma edge change within the known time delay difference. The mass is that of atomic Sn. The nonlinear curve shows the variation tendency of kinetic energy versus the changed time. At early times (), the plasma expands rapidly and the speed can reach up to . With the time delay, the speed of the plasma declined due to the effect of the resistance of the gas.
Figure 4.Particle kinetic energy versus delay time along the normal to the target surface at 50 Pa and laser energy of 130 mJ.
From Fig. 3, we carried on the standardization of Sn lines, which are Sn I 510.46 nm (), Sn II 533.2 nm (), 556.19 nm (), and 558.89 nm (). The spectroscopic data of these transitions are derived from the National Institute of Standards and Technology (NIST) database[18]. Figure 5 shows the intensity variation of Sn I and Sn II lines. We can get the intensity of the lines in the Sn spectrum from Fig. 3. The line spectra bottom is a continuous spectrum, so the intensity of bottom of the line spectrum needs to be removed. Sn I 510.46 nm appeared first at the delay time of 38 ns, and the EUV signal is too dim to be detected by the diode at this time. Meanwhile, the boundary particle kinetic energy reached the maximum (see Fig. 4). The trend of the line spectrum’s intensity is similar to the particle kinetic energy, which rapidly rises first, reaches the maximum, and then decreases gradually.
Figure 5.Temporal evolution of the Sn I 510.46 nm and Sn II 533.23 nm line at the delay time from 38 ns to 143 ns.
To better understand the fundamental parameters of plasma plumes, we estimated the electron temperature and density of the plasma by the above Sn lines. The plasma electron temperature was obtained by the Bolzmann plot method from singly ionized Sn emission lines, while the electron density was calculated using the Stark broadening method[19]. Electron temperature and density measurements at an early time () using OES are subject to inaccuracies caused by the presence of the continuum spectrum and therefore are not given. Figure 6 shows the evolution of the electron temperature and density from 59 to 143 ns. The change of electron temperature with time delay was similar that of the electron density, which decreased first and then slowed down as it reduced. It was observed that both electron density and electron temperature reached the maximum values at 73 ns; the highest electron density observed is approximately , while the highest temperature is approximately 18.7 eV, which might be due to the absorbed energy being converted into internal energy of the plasma and the intensity of lines being strong over this period.
Figure 6.Temporal evolution of the electron temperature and density.
We pay much attention to the maximum value of the plasma parameter and the time that this value was reach by investigating the influence of air pressure and incident laser energy on the evolution and dynamics of Sn plasma. Figure 7 shows the coordinates of the maximum boundary of kinetic energy versus different pressure and incident laser energy, respectively. It is noticed that the maximum kinetic energy decreases with increasing air pressure, and the time of the maximum kinetic energy was delayed as the air pressure increased. The incident laser energy also has an impact on the kinetic energy. The laser energy can be changed from 182 to 50 mJ by adjusting the quartz attenuation. Due to the different laser energies, the kinetic energy reached its maximum at the delay time of 17 ns with the laser energy of 182 mJ, and with the laser energy of 50 mJ the time was 73 ns. These differences in kinetic energy mainly resulted from the different energy deposition in the plasma.
Figure 7.Maximum kinetic energy versus the delay time under different atmosphere pressure and laser energy, respectively.
Pressures of the ambient environment and incident laser energy also have a significant influence on the electron temperature and electron density of LPP. Figure 8 shows the maximum electron temperature and electron density at pressures ranging from 5 to , with the incident laser energy of 130 mJ. In general, with the pressure increased, the electron temperature increases and the times that the plasma parameters reached their maximum were delayed. Similar behavior has been reported by Farid et al.[20] using a Nd:YAG laser in which the electron temperature is varied from 11484 to 4988 K for a atmosphere as the pressure increased from to . That can be explained as follows: at higher pressures, there is more energy gain in the plasma, so dense and hot plasmas with a higher temperature and higher electron density were observed.
Figure 8.Variation of maximum electron temperature and electron density with delay time under different pressures (5 Pa, 50 Pa, , , ).The incident energy is 130 mJ.
The incident laser energy also has a great effect on the electron temperature and electron density of laser-produced plasma. Figure 9 shows the resulting variation in the maximum electron temperature and electron density with different incident laser energies at a pressure of 50 Pa. It was observed that with increasing laser energy the time of reaching electron temperature and electron density maximum was earlier. The plasma parameters (electron temperature and electron density), which were 43 eV and with the laser energy of 182 mJ and the time was 111 ns with the laser energy of 104 mJ, reached a maximum at the delay time of 76 ns. That is because the incident laser energy can provide more energy to plasma when its energy is higher.
Figure 9.Variation of maximum electron temperature and electron density for different incident laser energies (50, 104, 130, 182 mJ). The air pressure is 50 Pa.
In conclusion, the dynamics of Sn plasma and the characteristics of its emission spectrum are investigated. We mainly focus on the time relationship between the incident laser, the EUV signal, and optical emission. First, the temporal evolution of Sn plasma is studied at 50 Pa and the laser energy is 130 mJ at a laser intensity of . At 10 ns after the laser reaches the target, the first image of a plasma plume and continuous spectrum can be detected. The EUV signal has 2 ns more delay than the first image. The kinetic energy and the emission spectrum show the same variation trend, which are increasing rapidly as time increased, then decreasing gradually after the peak, and finally stabilizing. At 38 ns, the particle kinetic energy increases to a maximum of 3.23 keV and the line spectra appear in the spectrum. Meanwhile, the EUV signal is too dim to collect and it lasts about 20 ns. As time evolves, the plume front expands outward and the line-to-continuum ratio increases, and finally (at ) the spectrum consists of mainly ionic and atomic lines. The maximum temperature of 18.7 eV and density of are measured at 73 ns. We also investigate the influence of the atmospheric pressure and laser energy on Sn plasma. It is shown that confinement by the ambient pressures and the incident laser energy plays a significant role in maintaining plasma temperature and density. Kinetic energy decreases with the rise of air pressure, but it increases withthe decrease of laser energy. Electron temperature and density increase with the increase of pressure and laser energy.
References
[1] V. Y. Banine, K. N. Koshelev, G. H. P. M. Swinkels. J. Phys. D Appl. Phys., 44, 253001(2011).
[2] J. P. Singh, S. N. Thakur. Laser-Induced Breakdown Spectroscopy(2007).
[3] D. B. Chrisey, G. K. Hubler. Pulsed Laser Deposition of Thin Films(1994).
[4] K. F. Al-Shboul, S. S. Harilal, A. Hassanein. Appl. Phys. Lett., 99, 131506(2011).
[5] J. Gonzalez, X. L. Mao, J. Roy, S. S. Mao, R. E. Russo. J. Anal. At. Spectrom., 17, 1108(2002).
[6] S. Amoruso, R. Bruzzese, N. Spinelli, R. Velotta. J. Phys. B At. Mol. Opt. Phys., 32, R131(1999).
[7] V. M. Donnelly, M. V. Malyshev, M. Schabel, A. Kornblit, W. Tai, I. P. Herman, N. C. M. Fuller. Plasma Sources Sci. Technol., 11, A26(2002).
[8] V. M. Donnelly, M. V. Malyshev. Appl. Phys. Lett., 77, 2467(2000).
[9] M. Murakami, S. Fujioka, H. Nishimura, T. Ando, N. Ueda, Y. Shimada, M. Yamaura. Phys. Plasmas, 13, 033107(2006).
[10] J. R. Freeman, S. S. Harilal, A. Hassanein. J. Appl. Phys., 110, 083303(2011).
[11] S. S. Harilal, B. O’Shay, Y. Tao, M. S. Tillack. J. Appl. Phys., 99, 083303(2006).
[12] S. S. Harilal, B. O’Shay, M. S. Tillack. J. Appl. Phys., 98, 013306(2005).
[13] N. M. Shaikh, Y. Tao, R. A. Burdt, S. Yuspeh, N. Amin, M. S. Tillack. J. Appl. Phys., 108, 083109(2010).
[14] J. R. Freeman, S. S. Harilal, P. K. Diwakar, B. Verhoff, A. Hassanein. Spectrochim. Acta Part B, 87, 43(2013).
[15] M. Polek, S. S. Harilal, A. Hassanein. Appl. Opt., 51, 498(2012).
[16] T. Wu, X. Wang, H. Lu, P. Lu. J. Phys. D Appl. Phys., 45, 475203(2012).
[17] T. Wu, X. Wang, S. Wang, J. Tang, P. Lu, H. Lu. J. Appl. Phys., 111, 063304(2012).
[18]
[19] R. W. Coons, S. S. Harilal, M. Polek, A. Hassanein. Anal Bioanal Chem., 400, 3239(2011).
[20] N. Farid, H. Wang, C. Li, X. Wu. J. Nucl. Mater., 438, 183(2013).