Optotype test method in the field of ophthalmic diagnosis was simulated. The contrast sensitivity of visual images through Fresnel microprisms was investigated. An imaging system for stroke test objects through Fresnel microprisms was set up. Experimental data on contract were obtained using new electronic method for registering the resolution of test stroke images. The experimental data obtained by the imaging system is consistent with the visual acuity data obtained by the traditional optotype test method. It was stated that applying microprisms noticeably reduce the contrast of test stroke optotypes which is diminishing proportionally to the prism strength and to the initial contrast value of the optotypes. The main reason for the reducing of the contrast and for the worsening of the resolution of optical images when using prisms is the white light chromatism and the diffraction of light beams at the microrelief of microprisms with different prismatic strength. The practical ways for the diminishing effect of reducing the contrast of the test optotypes are proposed by adopting the neutral glass filters with a sprayed layer of chromium.
In ophthalmology, the well-known method of eye-sight diagnostics is the usage of special test charts[1-2]. Patients are investigating the resolution of such test charts; mainly Snellen charts with high contrast optotypes (contrast kA=96.0%~98.0%), and doctors are measuring patient′s visual acuity VC for prescribing the eye-glasses. In some cases, the eye diagnostics is advisable to do with low-contrast test chart, similar to Lea-simbols charts, by measuring the contrast sensitivity of the eye for optotypes with kA= 10%~25% [2-3]. Indeed, most subjects around us have a low contrast, so the study of visual acuity only with high-contrast optotypes is not natural to the human eye. Methods of so-called "visiocontrastometry" [3] with low contrast kA allow to detect minimal disturbances of the visual functions of the eye, even for the normal visual acuity VC=1. Thus, some of the primary features of retinal diseases, in the macular area, optic nerve, as well as the initial stages of cataract and amblyopia, are much more accurately diagnosed with reduced contrast of the optotypes.
One type of low-contrast charts has eight lines of letters. The letters at the top of the chart are dark and then gradually become lighter until they are almost impossible to visualize. Scoring is based on the ability to see the letters. Patients fail when they have guessed incorrectly two of the three letters out of a combination of three letters in vertical stripes of decreasing shades of black to grey. Usually, the optotypes are printed at 25.0%, 10.0%, 5.0%, 2.5% and 1.25% contrast. The most often used chart is the 2.5% chart because at 2.5% contrast visual acuity values are close to one half of the visual acuity at the full contrast.
Testing is identical to the measurement of visual acuity at high contrast level, i.e., we measure the smallest size (lightest) of the optotypes that the patient can recognize. The threshold is defined as the line on which at least 3 out of the 5 optotypes are correctly recognized. The 2.5% test is the most practical test in clinical use. The main aim of this diagnostics is to find necessary refractive optics. If the person has severely impaired vision, the test must be quite close, which may require use of reading lenses.
In the case of patient′s strabismus, the prisms or microprisms should be used additionally to the refractive lenses.The Fresnel microprisms are the microstructured optics with the Fresnel prism structure that allows precise control of light refraction [1-2]. In the past two decades, flexible Fresnel microprisms or press-on prisms have been widely used in ophthalmology all over the world [4-7]. Such devices have attracted recently more and more research interest from both ophthalmologists and optometry researchers[6-10].
The application of Fresnel microprisms in ophthalmology always reduces the resolution of the formed optical images [9-12]. Due to this fact the measured visual acuity VC of the patient′s eye also diminishes. Here the very important factor is the contrast kA of the test ophthalmic charts because the visual acuity depends on the contract kA of chart optotypes. For measuring the contrast of test images the new electronic method was proposed [13] which allows the precise resolution measuring of the test images with and without prisms. Earlier the comparative optical characteristics were obtained [13] by this method over a wide range of prismatic strengths for monoprisms manufactured by "Gulden Ophthalmics" Company (USA), "3MTMPress-OnTM" elastic films with microrelief manufactured by "3M" Company (USA) and the modified rigid microprisms with protected microrelief developed and manufactured by the Institute for Information Recording of National Academy of Sciences of Ukraine (IIR NAS, Ukraine) [2]. Currently, the latters are widely used in Ukraine for the diagnostics and treatment of strabismus in children.
Studies[9-12]were conducted with high-contrast test objects for kA=96.0%~98.0%. The contrast kA therefore is one of the most important characteristics for detecting visual impairment.The main objective of the present research was to obtain the change of the contrast of test images due to the white light chromatism while using the Fresnel microprisms. It was necessary to distinguish the effect of prisms in the total decrease of the contrast, which is very important for diagnostics of eye diseases [4-5, 9-10].
1 Experiment setup
The decrease of the resolution of test images through microprisms was obtained earlier[9-12]by the traditional method of interviewing patients using the standard test ophthalmic charts with a high contrast optotypes. The empirical criterion for resolution was introduced by Raleigh and it gives the appropriate minimum angular distance between two separated points as
$
\sin \theta = 1.22\lambda /D
$
where θ is the angular resolution (minimum distance), λ is the wavelength, and D is the diameter of the entrance aperture of the optical system, which usually coincides with the diameter of the lens. According to Eq. (1), two neighboring spectral lines are resolved if the maximum of certain line coincides with the minimum of the other one.
In this paper, the contrast of the images kA is used for the determination of the resolution for the test ophthalmic charts.
where IF is the intensity of the background of the test chart, IA is the intensity of a certain optotype.
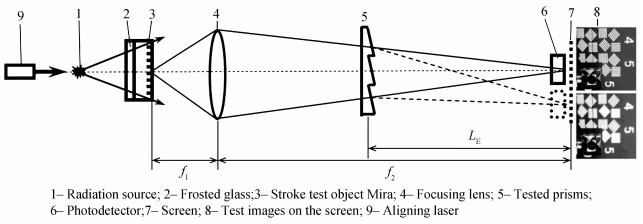
The scheme of the setup is shown in Fig. 1. A standard type-A filament lamp (1) with a brightness temperature of TA=2 856 K was used as a radiation source. A frosted glass (2) and a bar (3) of stroke test objects Mira #(2~5) [2], hereinafter denoted as (M2~M5), was used as the object for forming test strokes images (8) on the screen (7) with the required magnification (f2/ f1), where f1 and f2 are the distances from the focusing condenser (4) to Mira (3) and to the screen (7), respectively. The images (8) of test stroke object Mira on the screen simulate optotypes of test ophthalmologic charts. For forming images a precise projection lens (4) with a focal length of f =90 mm and the diameter of D =50 mm was used. A silicon photodiode FD288A [2] with a slit diaphragm of width SR=0.45 mm was used as an image detector (6). The diode was moved across the stroke images on the screen (8) for the linear scanning of the images with a positioning accuracy of ±10 μm. A "green" semiconductor laser (9) with a wavelength λ=0.532 μm was used for aligning the optical system and determining the required positions of the tested prisms.
For simulation of the microprism influence on the contrast kA, the special experimental setup was created using the test stroke object Mira. The test strokes were projected to the screen with necessary magnification and these images simulated the optotypes of ophthalmic charts. The setup was based on the certain similarity criterion. This criterion stated the identity of the visual acuity data obtained in the traditional way using the test ophthalmic charts with the results of the measurements by the electronic method [13] using the images at the screen of test stroke object Mira. It means that for the same prisms the same relative chromatic expansion of the optotypes should be for the screen kS=ΔγS/ γS and for the retina of the human eye kC=ΔγC/ γC, where γC is the resolution of the eye, on average γC=1.0′, and ΔγC is the zone of the chromatism on the retina. According to estimates, when placing microprisms in a standard test ophthalmic frame at the distance D0=20 mm from the cornea of the patient′s eye with the visual acuity VC=1.0, the chromatism zone with the same width ΔγO=1.0″ is realized at the retina for microprisms with PD=20.0 Δ. Under these conditions for this prism the parameter kO=ΔγO/ γO=1.0. So, tested prism should be placed at the distance LE to the screen at which the chromatism zone ΔγS is equal to the resolution of test images γS. Calculations showed that for realizing the condition kS=kO=1.0. It is necessary to place the tested prisms at the distance of LE=35 cm from the screen. Other parameters of created experimental setup are usual for the forming any optical images on the screen.
The luminous flux passes through the tested microprisms (5) that were placed at a certain distance LE from the screen. This value LE should be stated from the similarity criterion [2] matching the traditional ophthalmic chart investigations with the test Mira electronic measurements [13]. For conditions of our experiments, where magnification of test images f2/f1 =20.5, for microprism PD=20.0 Δ the chromatism zone ΔγC=32′ [2], therefore, for realizing the condition kS=kO=1.0. It is necessary to place the tested prisms at the distance of LE=35 cm from the screen. For prism PD=14.0 Δ, the value ΔγС=22′, so the distance LE=51 cm. So, we have conducted all further measurement for both distances, the full evaluable range of prismatic strengths PD=0.5~30.0 Δ was investigated.
On the screen (7), the intensity of Mira images (8) with prisms and without prisms were recorded by a photodetector (6) for determining the microprism influence on the resolution of optotypes γS. In fact, the determination of the resolution γS is carried out through the registration of changes in the contrast kA of the stroke optotypes. Therefore, the influence of prisms can be obtained directly from the contrast of the images of test Mira optotypes. The contrast values kA were measured depending on the prismatic strength (PD) for a certain test stroke element MKHJ having a linear period of strokes DA, which corresponds to angular resolution γS of its image on the screen.
2 Experimental data on contrast sensitivity
Experimental data obtained for modified Fresnel microprisms with strengths ranging from 0.5 to 30.0 PD by electronic method [13]with a photodetector are shown in Fig. 2. The initial contrast values kA0 correspond to different test elements HJ of Mira M4[2] have different angular resolution at the screen γS. The optotypes M4HJ were investigated with the resolution angle γ2=5.20′ and contrast kA0=90.1% (curve 2); γ3=4.37 ′, kA0=88.0% (curve 3); γ4=3.47 ′, kA0=87.5% (curve 4); γ5=2.45 ′, kA0=79.0% (curve 5) and with the angle γ6=1.55 ′, kA0=48.8% (curve 6).
Figure 2.The effect of microprism on the optotypes contrast
These contrast values were obtained for the distance between the prisms and the screen LE=51 cm. For convenience, curves 2~6 are normalized to the initial contrast value kА0=100%. The best correlation with data [9] (Fig. 2, curve 1) was observed for curves 2~4, i.e. for the test strokes with the largest angular dimensions γS=3′~5′ when the influence of the chromatic aberrations is minimal.
To determine the effect of diffraction on the contrast kA, the similar studies were conducted for monoprisms "Gulden Ophthalmics" (USA), for which there is no diffraction. These data are also shown in Fig. 2 (curve 7) for the test element M4H03 (DA7=143 μm, γ7=5.20 ′, kA0=98%). The observed influence of monoprisms is noticeably smaller than the data [8], as well as our results for modified microprisms IIR (Ukraine) (curves 2~6). This fact is obviously due to the absence of diffraction influence for monoprisms. The observed decrease in contrast kA7 (curve 7) provides white light chromatism, which equally affects the initial kA0 values for microprisms and for monoprisms.
It is advisable to carry out direct measurements of the microprisms influence on the contrast of test charts under minimal chromatism. Really, using test strokes with observation angles γS smaller compared to the chromaticity zone ΔγS, it is difficult to avoid the influence of white light dispersion, even monoprisms. Therefore, studies have been conducted for wider optotypes, the angular period of γS on the screen is substantially larger than the chromaticity zone ΔγS.
In these studies, the images of the widest optotypes M5H01were formed on the screen. Prisms were placed at a distance LE=35 cm from the photodetector for decreasing the linear zone of chromaticity ΔDS comparing to the width of registering slit SR that was unchanged and equal to 0.45 mm. Some of these data obtained for the standard initial contrast kA0=96.0% are shown in Fig. 3. All data are normalized to the intensity of the stroke images of test M5H01 element without microprisms.
Figure 3.The M5H01 intensity for different prismatic strength Δ
From the intensities of M5H01 images above, it is possible to determine directly the white light transmittance τ for certain microprisms, which should be at least 80% [2]. This is true for small strength prisms with PD=0.5~5.0 Δ, when the shape of the stroke image is near rectangular. For larger prismatic strength Δ, the shape of the optotypes images changes and the transmittance τ should be determined by the standard method [2] using a laser beam. The obtained optotypes contrast kA for different microprisms are shown in Fig. 4.
Figure 4.Dependence of contrast for test element M5H01 on prismatic strength for different LE
From the data for wide test strokes, it follows the initial contrast kA0=95.5% slightly decreases to kA=93.4% when microprism PD =0.5 Δ is set. While increasing the microprism strength, the chromaticity zone ΔDS on the screen is comparing with the linear period DS of the test images and the chromatic aberrations decrease the contrast of the optotypes. For microprism PD =30.0 Δ for distance LЕ=35 cm the period DS=1.5 ΔDS and the contrast kA is 87.0%. For the distance LE=51 cm the contrast kA=65.7%. This fact indicates a noticeable influence of chromatic aberrations on the contrast and it should be taken into account while low-contrast diagnostics because contrast is diminishing proportionally for Lea-symbol′s charts at any contrast level of optotypes.
While decreasing the intensity of the light flux, the initial contrast kA0 practically does not change. To reduce the illumination of stroke optotypes, neutral glass filters with a sprayed layer of chromium were used. The thickness of the chromium layer δ=10~35 nm, which ensured a change in the transmittance τ of the light flux for 25%~75%. Figure 5 shows the obtained intensities of the images on the screen of M5H01 optotypes for microprisms with chrome filter with transmittance τ=35% (curve 1) and without filter (curve 2). The obtained data showed that the initial contrast of the test images kA0=96.0% with chromium filter obviously was unchanged in all tested conditions.
Figure 5.Normalized intensity distribution of M5H01 optotypes, 1: without filter; 2: with chrome filter (τ=35%)
Changing the lighting scheme for test M5H01 optotypes, the contrast of test strokes obtained by the method[13] also changes, but the stated phenomenon is the same—the contrast of optotypes on the screen is not changed until the chromaticity zone on the screen in linear ΔDS or angular ΔγS units is less compared with the linear DS or the angular γS period of the test strokes.
Similarly, a patient does not notice the change in the contrast through microprisms, until the size of the optotypes on his retinaγC exceeds the zone of chromatic aberrations ΔγC. Under the prismatic strength Δ increase, when ΔγC increases and approaches the value of γC, the contrast kAaccording to patient's feelings [3] begins to decrease.
Therefore, for prisms of greater strength then PD > 14.0~20.0 Δ, when ΔγC > γC, the observed decrease in the contrast kA is caused not only by the disease of the patient's eye, but also by the prisms themselves. This effect should be taken into account by the special calibration tests with prisms before the contrast measurement in order to obtain reference data for a healthy eye.
The main reason for reducing the contrast and for worsening the resolution of optical images when using prisms is the white light chromaticity which occurs when the light rays of different wavelengths are refracting on the prism surfaces. To reduce the chromaticity, all microprisms in diagnostic bars unlike microprisms from the diagnostic set of KK-42 [2], are made using two identical microprisms, the prismatic strength of each is approximately two times less than the total one. For the same reason, all modified Fresnel microprisms IIR (Ukraine) are made of Polymethylmethacrylate (PMMA). For this plastic, the chromaticity zone ΔγS is minimal among all optical materials, since the Abbe coefficient kAB determining the value of ΔγS, is maximal just for PMMA (kAB=58).
To eliminate the effect of diffraction, which decreases with the rise of the relief pitch W, all modified Fresnel microprisms [2]are made with the pitch W =600 μm, for which the diffraction effects are not large, but the discreteness of the visual images for the human eye is almost invisible.
3 Conclusion
In this paper, the contrast sensitivity of visual images through Fresnel microprisms was investigated. It was stated that applying microprisms noticeably reduce the contrast of test stroke optotypes which is diminishing proportionally to the prism strength and to the initial contrast value of the optotypes. The main reason for the reducing of the contrast and the worsening of the resolution of optical images when using prisms is the white light chromatism which occurs when the light rays of different wavelengths are refracting on the prism surfaces. The other reason for the reducing of the contrast of the test optotypes is the diffraction of light beams at the micropelief of microprisms with different prismatic strength.
The practical ways for diminishing the effect of reducing the contrast of the test optotypes are proposed. For prisms of greater strength then PD=20.0 Δ, the observed decrease in the contrast kA is caused not only by the disease of the patient's eye, but also by the prisms themselves. So, the special calibration tests with prisms should be taken before the contrast measurement in order to obtain reference data for a healthy eye.
The obtained data on the reduction of the contrast should be taken into account during ophthalmic diagnostics of eye-sight with high-contrast optotypes and when conducting the studies of visual defects using methods of visocontrastometry with low-contrast optotypes.
[2] E E ANTONOV, A A KRYUCHYN, Ming-lei FU. Microprisms:optical parameters and monitoring, 146(2015).
[3] V MELLINA. Effect of modified Fresnel prisms on visual acuity and contrast sensitivity in children. Archive of Ukrainian Ophthalmology, 4, 36-39(2016).
[5] I JIVRAJ, V PATEL. Treatment of ocular motor palsies. Current Treatment Options in Neurology, 17, 1-15(2015).
[6] SHISHAVAN A A, NDIN L, TJOSSEM P, et al. PMMAbased ophthalmic contact lens f vision crection of strabismus[C]. Metamaterials, Metadevices, Metasystems 2016, 9918: 99180C.