Zaihang Yang, Hao Sun, Tingting Gang, Nan Liu, Jiacheng Li, Fei Meng, Xueguang Qiao, Manli Hu, "Refractive index and temperature sensing characteristics of an optical fiber sensor based on a tapered single mode fiber/polarization maintaining fiber," Chin. Opt. Lett. 14, 050604 (2016)
Copy Citation Text
An evanescent field optical fiber sensor based on a short section of polarization maintaining fiber spliced with a tapered single mode fiber is proposed and experimentally investigated. We mainly focus on the refractive index (RI) and temperature sensing characteristics of this compact device. The transmission spectrum of the resonance wavelength, induced by the interference between the excited low order cladding modes and core modes, shows the quadratic function relationships with RI and linear relationships with temperature. Thus, the proposal of this simple-to-fabricate, compact, and low cost sensor shows its possible potential in the sensitive detection field.
The detection of ambient refractive index (RI) and temperature has been widely used for various applications such as environmental science, biomedicine, physics, and food security[1–4]. Compared with the traditional electrical and chemical RI sensors, the optical fiber refractometer has more extensive application prospects and excellent sensing performances due to the advantages of compact size, high sensitivity, low cost, corrosion resistance, and good electromagnetic interference immunity. These days, there are two main kinds of optical fiber sensors: the optical fiber grating sensor[5–7] and the interferometric optical fiber sensor[8,9]. The optical fiber grating sensor can be divided into long period fiber grating (LPFG)[5,6] and fiber Bragg grating (FBG)[7] according to the length of the grating, which has been experimentally demonstrated in the fields of RI and temperature measurements with their merits and demerits. The traditional LPFG sensor has been generally employed as the transmission device and temperature sensor in optical fiber communication and sensing systems[10,11]. Recently, some post-process techniques have been reported for RI measurement, such as phase-shift LPFG assisted by silver film coating[12], which succeeds in making an LPFG-based configuration into a reflection probe. However, the sensor depends on complex grating incorporation and film coating techniques. FBGs are a typical reflection-type component that is widely used in temperature/bending sensors. However, it is inherently insensitive to RI changes due to the thick cladding. Some post-processing techniques, such as chemical etching and diameter mismatching[13–15], have been employed to induce the recoupling of the core-to-cladding modes so that the FBG is sensitive to the change of external environment RI. Even though these sensor devices present excellent sensing performance in the measurement of RI and temperature, there also exist some faults in the structure fabrication, such as weak mechanical strength and complex FBG inscriptions, which will increase the manufacturing cost. Another group of fiber devices, fiber interferometers, have also been widely developed for RI and temperature sensing applications. In Mach–Zehnder interferometers[16,17] and Michelson interferometers (MIs)[18], the fringe patterns are generated by the interference between the core and cladding modes, which have a good response to ambient RI and temperature change. Compared with the optical fiber grating sensors, the interferometric optical fiber sensors have the advantages of a simple manufacturing process so that we can omit the cost of the complex inscription process. However, there are also some problems such as interference echo in MIs and the unstable interference spectrum due to the dual light interference structure itself. In recent years, polarization maintaining fiber (PMF), a new type of optical fiber, has garnered more attention due to its ability to ensure constant linear polarization direction, which can achieve a more stable interference spectrum and improve the coherent signal-to-noise ratio significantly[19]. In addition, some reports have demonstrated that an enhanced evanescent field fiber sensor can be used for the measurement of RI[1]. As an alternative to these existing optical sensors, a simple tapered single mode fiber (SMF)-PMF structure was proposed, and an ideal interference spectrum was achieved by this simple configuration without any complex post-processing. Moreover, the experimental results demonstrated that the proposed sensor has an excellent response to the change of ambient RI and temperature.
In this Letter, we present an optical fiber sensor for the measurement of external RI and temperature that is fabricated by splicing a 40 mm section of PMF to a tapered SMF. We use the methods of wavelength and intensity modulations for RI and temperature measurements, respectively. As a result, the power and the wavelength respectively show a quadratic function relationships with the external RI ranging from 1.33 to 1.40 RIU. Besides, the temperature sensitivities of ~0.0867 nm/°C and ~0.162 dBm/°C corresponding to the wavelength and the power are respectively acquired.
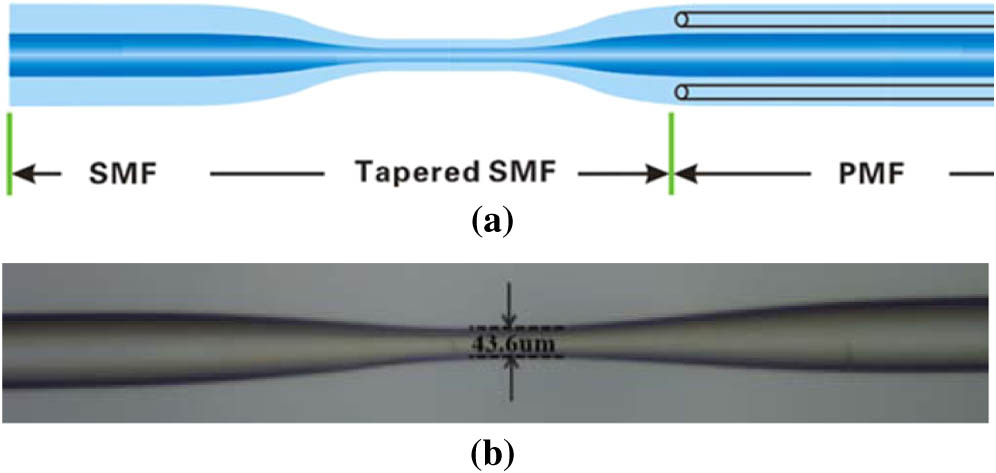
The schematic configuration of the proposed sensor is shown in Fig. 1(a). The sensing head is composed of a tapered SMF and a short section of PMF. The tapered fiber consists of three contiguous parts: one taper waist segment with tiny and uniform diameter and two conical transition regions with gradually changing diameter. The ends of the conical transition regions are spliced to the PMF and SMF. The fiber core/cladding diameter of the SMF used in this experiment is 9/125 μm, taped by a commercial fusion splicer (Fujikura FSM-100 P+). Figure 1(b) shows the optical microscope image of the sensor by a DM2700M (Leica Microsystems). According to Fig. 1(b), the length of the tapering area is about 686 μm and the diameter of the waist is 43.6 μm. The 40 mm PMF is spliced to the tapered SMF at 1 mm from the waist. The PMF used in this experiment is a PM1550, and the mode field diameter is 9.8 μm.
Sign up for Chinese Optics Letters TOC. Get the latest issue of Chinese Optics Letters delivered right to you!Sign up now
Figure 1.(a) Schematic configuration of the sensor; (b) microscopic image of the tapering structure.
In the traditional SMF, all the light is guided within the thin core due to the total internal reflection. In the tapered SMF, as the longitudinal RI distribution is changing, it will form an evanescent field in the intermediate tapered region, and part of the light energy is not confined by the thin waist. Compared with the traditional detection field, the evanescent field is more sensitive to a change in RI due to its high power intensity in the sensing area. The PMF is applied to avoid crosstalk among the different polarization modes to enhance the stability of our detection. Thus, we propose a sensor to test the ambient RI and temperature.
When the fundamental mode in the core propagates along the SMF into the tapering area, some cladding modes with different effective indexes can be excited in the PMF. Next, both of the core modes and cladding modes will propagate along the PMF, and part of them will be reflected at the end face of the PMF. The reflected cladding modes will interfere with the reflected core mode when the light is recoupled back to the taper section of the SMF. For the modal interferometer, the phase difference between a core mode and a cladding mode can be calculated as[20]where , , and are, respectively, the core mode effective RI, the cladding mode effective RI, and the effective RI difference between the core and cladding modes; L is the length of the PMF[21,22]; is the free space wavelength. According to the interference theory, when the phase difference where m is a positive integer the interference light intensity will reach its minima and the resonance wavelength can be expressed as[20]In general, the reflected spectral intensity I can be calculated as[20]where and are the intensities of the core and cladding modes, respectively.
For this proposed sensor, the ambient RI or temperature change will cause the change of the effective RI difference and then induce the change of phase difference , which will cause the resonance wavelength shift and intensity fluctuation of the reflected spectrum finally. Thus, the measurement of ambient RI or temperature can be achieved through measuring the reflected spectrum.
The schematic diagram of the RI experimental setup is shown in Fig. 2. The input light from the amplified spontaneous emission source propagates through the circulator, polarizer, and polarization controller, then is launched into the sensor. The original light from the light source is transformed to the polarized light by the polarizer. With the combined action of the polarizer and the polarization controller, stable linear polarized lights is achieved and transmitted in the PMF. Thus, we can obtain the ideal interference spectrum. The role of the PMF is to keep the polarization state of the detection light field to enhance the stability of the detection basing on interferential fiber optic sensors. Through the output port of the circulator, the reflected interference spectrum is monitored by an optical spectrum analyzer (OSA) with a resolution of 0.02 nm/0.01 dB. When we adjust the polarization controller to transform the incident polarization into linear polarization by rotating the wave plates, the stable inference spectrum could be observed.
Figure 2.Schematic diagram of the RI experimental setup.
The reflected spectrum of the resonance wavelength in the air at room temperature (23°C) and the corresponding spatial frequency spectrum of the sensor are shown in Figs. 3(a) and 3(b). In Fig. 3(a), an obvious interference dip can be seen in the 1552.648 nm wavelength, which is the resonance wavelength. We choose this dip as the measured indicator to attain the sensing information via measuring its wavelength and intensity variations. For analyzing the characteristics of the reflected interference spectrum in Fig. 3(a), the wavelength spectrum was fast-Fourier-transformed to the spatial frequency spectrum [as seen in Fig. 3(b)]. It is obvious that the fundamental mode has the most power, and the dominant stimulated low order cladding mode is stronger than other stimulated high order cladding modes. Therefore, the reflected interference spectrum in Fig. 3(a) is mainly formed by the interference between the low order cladding modes and core modes.
Figure 3.(a) Reflected interference spectrum of the sensor; (b) the corresponding spatial frequency spectrum.
In the RI experiments, the used RI liquid is a water–glycerin solution with different concentrations calibrated by an Abel refractometer. The sensor head is fixed in two opposite parallel lift platforms and immersed completely in the RI liquids by moving the lift platform up and down. In order to remove the influence of the residual liquid attached to fiber, the sensing head needs to be cleaned by anhydrous alcohol before each measurement.
Figure 4 shows the corresponding spectral response to different RI liquids. According to the interference spectrum, the wavelength shifts towards a shorter direction and the intensity decreases when the RI increased from 1.3328 to 1.4045. The dominant cladding mode and some other weak cladding modes can lead to a quadratic response of IR to the wavelength. Consequently, the wavelength shifts of the characteristic spectrum versus different RI liquids is shown in Fig. 5(a), where it is apparent that the resonance wavelength shift with the RI variation is close to a quadratic relationship ranging from 1552.648 to 1550.643 nm. In addition, the fitting curve can be expressed as where represents the resonance wavelength (nm) of the proposed fiber sensor, and n represents the RI of the RI liquids (RIU). The intensity shifts versus RI in Fig. 5(b) can be expressed as where represents the intensity of the interference spectrum. It can be seen that the change of intensity with different RI liquids is also close to a quadratic relationship ranging from to .
Figure 4.Reflected interference spectrum for different RI liquids.
We also measure the temperature response for the proposed sensor in order to explore its temperature characteristic. As shown in Fig. 6, the temperature experiments are implemented in a temperature controlled oven at a range of 30°C to 80°C. The temperature is left to be stabilized for 3 min before each measurement. The length of the PMF and the effective RI of the core and cladding will change with the ambient temperature due to the thermo-optical and thermal expansion effects. Thus, the corresponding changes of can yield a resonance wavelength shift leading to a modified reflected spectral intensity. Therefore, we can obtain the corresponding temperature sensing information through demodulating the resonance wavelength. The relationship between the wavelength and temperature can be derived as[23,24]where and are the effective RIs of the core and cladding modes, respectively.
Figure 6.Schematic diagram of the temperature experimental setup.
In general, the thermal expansion coefficient is two orders of magnitude lower than the thermo-optic coefficient. Thus, the thermal expansion coefficient can be ignored, and the higher temperature sensitivity of the PMF-based interferometer mainly results from the thermo-optical coefficient difference. Consequently, we can obtain a linear response of wavelength by changing the ambient temperature.
Figure 7(a) shows the resonance wavelength has a shift of , ranging from 1553.338 to 1549.047 nm. The fitting curve can be expressed as where represents the ambient temperature of the environment, and the slope of the fitting straight line is . Figure 7(b) shows that the intensity has a shift of , ranging from to . The fitting curve can be expressed as
The slope of the fitting straight line is 0.1602. So the temperature sensitivities of the wavelength and the power are 0.0867 nm/°C and 0.1602 dBm/°C, respectively.
The temperature experiment results illustrate that the high temperature sensitivities of the sensor are 0.0867 nm/°C and 0.1602 dBm/°C corresponding to the wavelength and the power respectively.
Figure 7.(a) Resonance wavelength shifts versus temperature for the sensor; (b) intensity change versus temperature for the sensor.
In conclusion, we propose an optical fiber sensor with a structure by splicing a short section of PMF to a tapered SMF and investigate the RI and temperature sensing characteristics. The spectral analysis demonstrates that the reflected spectrum is mainly formed by the interference between the mainly excited low order cladding modes and core modes. The RI experiment results show that the notch wavelength is close to a quadratic relationship, correlating with the wavelength and intensity shift ranging from 1552.648 to 1550.643 nm and to , respectively. The temperature experiment results illustrate that the sensor has high temperature sensitivity of 0.0867 nm/°C and 0.162 dBm/°C. Moreover, the total length of the proposed sensor is only 50 mm. To sum up, the proposed optical fiber sensor is simple-to-fabricate and also has a low cost and a compact size, which is suitable for RI and temperature measurements with prospects over a wide variety of applications.
Zaihang Yang, Hao Sun, Tingting Gang, Nan Liu, Jiacheng Li, Fei Meng, Xueguang Qiao, Manli Hu, "Refractive index and temperature sensing characteristics of an optical fiber sensor based on a tapered single mode fiber/polarization maintaining fiber," Chin. Opt. Lett. 14, 050604 (2016)