
Boyao Li, Yaoyao Liang, Zhongye Xie, Xiaojie Zuo, Jinghua Sun, "Multi-direction bending sensing based on spot pattern demodulation of dual-hole fiber," Chin. Opt. Lett. 21, 122201 (2023)
- Chinese Optics Letters
- Vol. 21, Issue 12, 122201 (2023)
Abstract
1. Introduction
Bending sensors have been used in many fields, such as mechanical engineering, structural monitoring, and astronautics[1–3]. Meanwhile, optical fiber has become a natural carrier for sensors due to its advantages of flexible transmission, integration, and resistance to electromagnetic interference[4,5]. Therefore, in the past few years, many types of fiber bending sensors have been reported based on fiber gratings[6,7], photonic crystal fibers (PCFs)[8,9], Mach–Zehnder interferometers[10,11], multi-core fiber sensors[12,13], S-shaped bending fiber sensors[14], and others. The main principle of these works is to use information such as the position changes of the characteristic peaks in the transmission spectrum after pattern interference to ultimately obtain the corresponding bending information. In order to improve sensing performance, in 2019, Zheng et al. achieved better bending detection results by using the large-mode-field area of the hollow core fiber and fusing it with a single-mode fiber, both theoretically and experimentally[15].
However, in the actual monitoring of the bending, one or two simple bending directions cannot fully reflect the actual situation, so it is necessary to monitor bending in multiple directions. For realizing the multi-direction bending detection, two or more bending sensors are usually used with complex fabrications. In practical applications, it is favorable to reduce the number of sensors when measuring the bending radius or other parameters. Thus, Guan et al. improved the fiber structure to reflect the bending in both directions from the spectrum[16]. Furthermore, a number of one-dimensional bending direction sensing units can be compactly integrated into a multicore fiber (MCF) to realize two-dimensional bending sensing[17,18]. Nevertheless, spectral information can only describe the wavelength of light, and it is easy to generate spectral overlap corresponding to multiple spatial vector directions, which is difficult to demodulate. In addition, compared to spectrum information, the light spot itself carries more information and is easier to obtain[19].
Therefore, we report a method based on spot pattern demodulation in a dual-hole fiber (DHF) to realize multi-direction bending sensing. Due to defects in the fiber structure, the scattered light field transmitted internally emits a highly sensitive spatial interference pattern. Compared to speckle patterns in Ref. [19], interference fringes are more regular and precise. Moreover, due to the asymmetry of the structure, the spatial distribution of the light spot pattern is also directional, which is very conducive to multi-directional fiber bending judgment. Through the analysis of a convolutional neural network for combining classification and regression, more than 98% accuracy can be achieved in determining the bending direction and angle simultaneously among 128 group test spot patterns. It provides potential application value for subsequent multi-dimensional bending detection, beam light modulation, etc.
Sign up for Chinese Optics Letters TOC. Get the latest issue of Chinese Optics Letters delivered right to you!Sign up now
2. Experiments
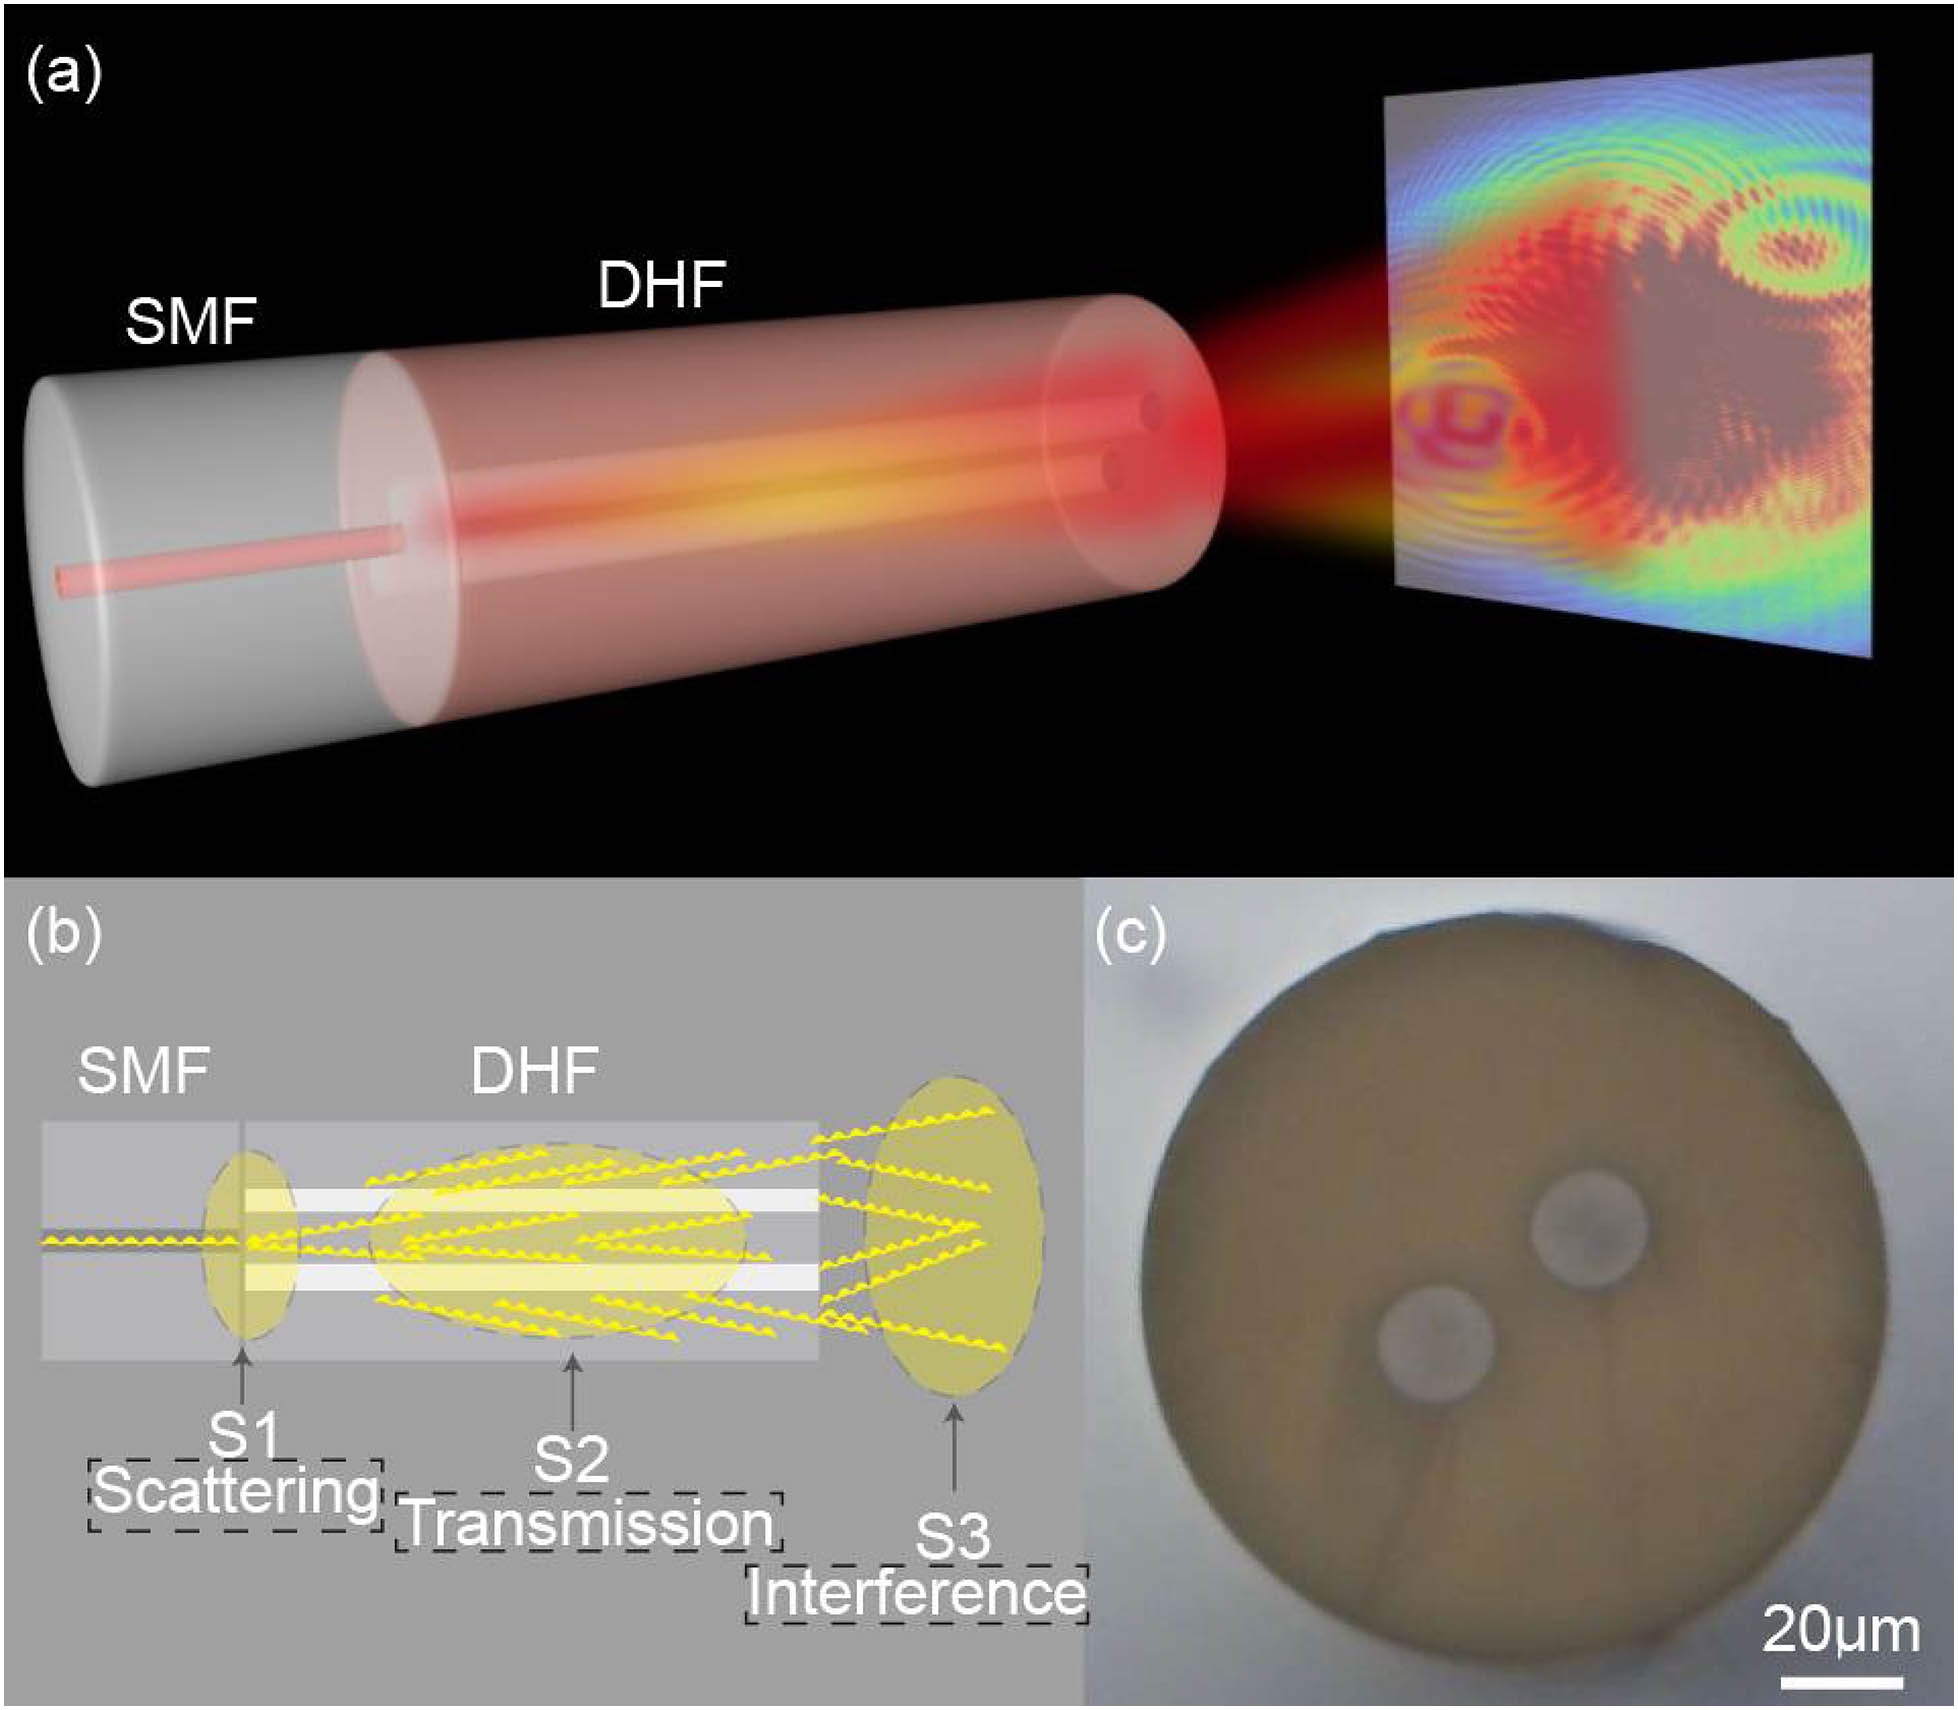
Figure 1(a) shows the sensor’s 3D view schematic diagram. Light passing through the sensor can form a spot pattern in the space of the rear end face of the double-hole fiber (DHF). By collecting the spot pattern, the bending situation can be further determined. The principal diagram of the sensing device and relative sensing mechanism is shown in Fig. 1(b). When light is transmitted into a single-mode fiber, it undergoes scattering due to structural changes after passing through a DHF (in S1 region). Then, the light propagates along the high-refractive-index cladding (in S2 region). Finally, the scattered light from the cladding forms an interference speckle pattern in space (in S3 region). During the fiber bending process (in S2 region), different bending radii affect the refractive index of the fiber as follows:
![]()
Figure 1.Schematic diagram of the design and principle of the DHF sensor. (a) The 3D schematic diagram of the proposed sensor. (b) The schematic illustration of the sensing principle. (c) Cross section of the fabricated DHF.
In Eq. (1), the
3. Results and Discussion
3.1. DHF light field simulation and bending experimental results of the spot pattern
For accurately describing the spot distribution performance of DHF, the finite element simulation method (FEM) was used to calculate the transmission characteristics of the sensor. The relative analysis is based on the beam envelope module in the general numerical analysis tool. The geometry of model is the
![]()
Figure 2.Numerical and experimental results of the sensor. (a) The side beam propagation diagram of the numerical simulation of the device. (b) The light intensity distribution at different spaces between DHF and CCD. (c) The experimental transmission results when the distance between the end of the DHF and the receiving CCD is 3 cm.
In addition, the influence of DHF on temperature during the bending process also needs to be considered. The dual-hole optical fiber used in the manuscript is made of a silicon dioxide material. The thermal optical coefficient of the silicon dioxide is in the order of
![]()
Figure 3.The influence of temperature changes on the light spots.
Based on above characteristics of the sensor, the spatial distribution patterns with different bending angles and directions were sampled and analyzed. The principle of the bending device is as shown in Fig. 4(a). We fixed the ruler on the end of the holder, and on another end of the ruler, we fixed a three-dimensional adjusting setup. The DHF is attached to the surface of the ruler. Then, the bending radius of the DHF can be controlled by the distance between both ends of the ruler and can be calculated as
![]()
Figure 4.Bending experimental principle and results. (a) The light of the customized laser (980 nm) goes through the SMF to the DHF, and the final signal was recorded by the CCD (Ncam). The bending radius can be controlled by regulating the distance of ds. As for the different bending directions, it can be achieved by rotating the DHF. (b) The light spot patterns corresponding to bending at different directions with the same radius. d1, d2, d3, and d4 represent the four directions of “up,” “left,” “down,” “right”, respectively.
3.2. Deep learning assisted demodulation of multi-directional bending results
From the above results, it can be seen that the spot pattern of the DHF can describe the bending angles and directions, simultaneously. However, when relying solely on the light spot, it is difficult to quantitatively analyze the bending angle and direction. Although the movement of the interference fringes is easier to quantify compared to the speckle, multi-directional bending also has an impact on the direction and variation pattern of the fringe movement. In order to further solve this problem while considering the two-dimensional characteristics of the spot, the advanced 2D-CNN deep learning network[22] is used to train the network with the data of different bending angles and directions. The training model is shown in Fig. 5. First, 1280 sets of data (each set of data ranging from
![]()
Figure 5.Deep learning network based on 2D-CNN for the multi-direction sensor prediction and the demodulation model. 1280 groups of spot data are input into the model according to the different feature areas of each group of data.
Figure 6 shows the root mean square error (RMSE) and loss value of the displayed training process. After the 35th round of model training, the RMSE value is basically about 0.90221, and the loss is lower, 0.4. The rest average accuracy of the validation data and test data is above 88%. Considering the judgment of different direction encoding and angle encoding in the model output, we adopted the judgment method shown in Fig. 6(b) for comprehensive accuracy estimation. Note that “Di” represents the output four-bit directional encoded vector value. Compare the labels of 128 test group data with the output values of the model, and verify the accuracy of the model in all directions when the difference is 0.4 and 0.6, respectively. There are differences in the accuracy estimates for the four directions. This is because the image segmentation sampling of the input image samples is not located at the center of the image, so the bending sensitivity of different regions and directions is different. Additionally, by adjusting the judgment threshold of the output results, the accuracy of the model can be improved to varying degrees. It should be pointed out that if the direction or bending angle is judged separately, the accuracy of the model can be higher than 99%. The accuracy here is to simultaneously consider both direction and bending angle. Since the accuracy varies among different regions, we divided the same sample into five regions S1, S2, S3, S4, and S5. The minimum accuracy [Ac(min)] for each region was calculated separately, and the results are shown in Fig. 6(c). It can be seen that the accuracy of the middle region S1 is higher under the same judgment rules. This is because the light field in the middle region can reflect the changes in each direction more evenly. So, compared to the edges, it can comprehensively reflect the information of the light field.
![]()
Figure 6.Deep learning network based on 2D-CNN for the multi-direction bending sensor demodulation results. (a) The root mean square error (RMSE) and loss of model training data and validation data. (b) Using the trained 2D-CNN model to verify the accuracy of the bending direction and bending angle for 128 sets of test data simultaneously. One-hot coding has been carried out in different directions. The 0.01–0.09 mm corresponding to ds is also encoded as 1–9, which facilitates model convergence at the same scale of magnitude. (c) Accuracy verification after sampling different regions of the same input image.
4. Conclusion
In summary, we have proposed a DHF multi-direction bending sensor. Due to the asymmetry of the fiber structure and the interference of the cladding beam, the perception of the direction and bending angle of the optical field distribution on the fiber end face is more obvious. By combining regression and classification models using convolutional neural network algorithms, simultaneous recognition of the bending angle and the direction can be achieved. Under the condition of determining the appropriate threshold setting, the accuracy of the test sample can reach up to 98%. Thus, the limitation of directional information obtained from the spectrum could be overcome, and information reuse is achieved from higher dimensions of the optical field information. All these characteristics indicate that the DHF spot pattern demodulation has potential application value in multi-dimensional vector sensing.
References


Set citation alerts for the article
Please enter your email address

© Copyright 2018-2021 | Chinese Laser Press. All Rights Reserved 沪ICP备15018463号-20