1Department of Instrument Science and Technology, College of Mechatronic Engineering and Automation, National University of Defense Technology, Changsha 410073, China
2Interdisciplinary Center for Quantum Information, National University of Defense Technology, Changsha 410073, China
Yukun Luo, Shuhua Yan, Aiai Jia, Chunhua Wei, Zehuan Li, Enlong Wang, Jun Yang. Revisiting the laser frequency locking method using acousto-optic frequency modulation transfer spectroscopy[J]. Chinese Optics Letters, 2016, 14(12): 121401
Copy Citation Text
We present a laser frequency locking system based on acousto-optic modulation transfer spectroscopy (AOMTS). Theoretical and experimental investigations are carried out to optimize the locking performance mainly from the view of the modulation frequency and index for the specific scheme of AOMTS. An FWHM linewidth of 63 kHz is achieved and the frequency stability in terms of Allan standard deviation reaches at 30 s. The frequency shifting capacity is validated throughout the acousto-optic modulator bandwidth while the laser is kept locked. This work offers a different but efficient choice for applications calling for both stabilized and tunable laser frequencies.
Laser frequency lock is a basic precondition for precise atomic optics and physics applications such as laser cooling, atomic clocks, and atom interferometry. Various methods have been proposed and adopted in experiments, including the conventional saturation absorption spectroscopy[1,2], frequency modulation spectroscopy[3], the dichroic atomic vapor laser lock[4], polarization spectroscopy[5,6], Zeeman modulation[7], and modulation transfer spectroscopy (MTS)[8–12]. The MTS method is based on the nonlinear phenomenon known as four-wave mixing and is insensitive to the background absorption of the medium, thus is expected to have a lower noise level and a steeper voltage-to-frequency slope compared with other methods.
The laser frequency modulation in MTS is generally performed by electro-optic modulators (EOMs) or acousto-optic modulators (AOMs). While a majority of experiments choose the former, the use of AOMs for MTS lock has some unique advantages. First, using an AOM is supportable for simultaneous frequency shifting and modulation, thus simplifying the laser system in conditions where a frequency offset or even a temporal frequency sweep is demanded. Second, a matched RLC circuit is usually needed for EOM to improve the Q-factor at the resonant frequency and reduce the requirement of the RF power, but meanwhile limits the bandwidth of the modulation frequency. Differently, the modulation frequency can be easily varied by an AOM with no need for power amplifiers or resonant circuits. Also, while the modulation index in the EOM method should be well controlled below 1 rad to avoid the introduction of high-order sidebands, it can be tuned more flexibly in a wide range with AOMs to search for optimal operating parameters. In addition, it is reported to be more conducive to providing improved optical isolation and laser intensity noise suppression with AOMs[13].
A few experiments have been done in acousto-optic modulation transfer spectroscopy (AOMTS)[11,13,14], but with a relatively confined choice of modulation frequency and index. However, since the locking quality depends on multiple parameters, including the modulation frequency, modulation index, demodulation phase, and the overall noise level in the detection and feedback loop, a deeper insight of the relationship between those parameters and the extremum of the locking performance is needed.
Sign up for Chinese Optics Letters TOC. Get the latest issue of Chinese Optics Letters delivered right to you!Sign up now
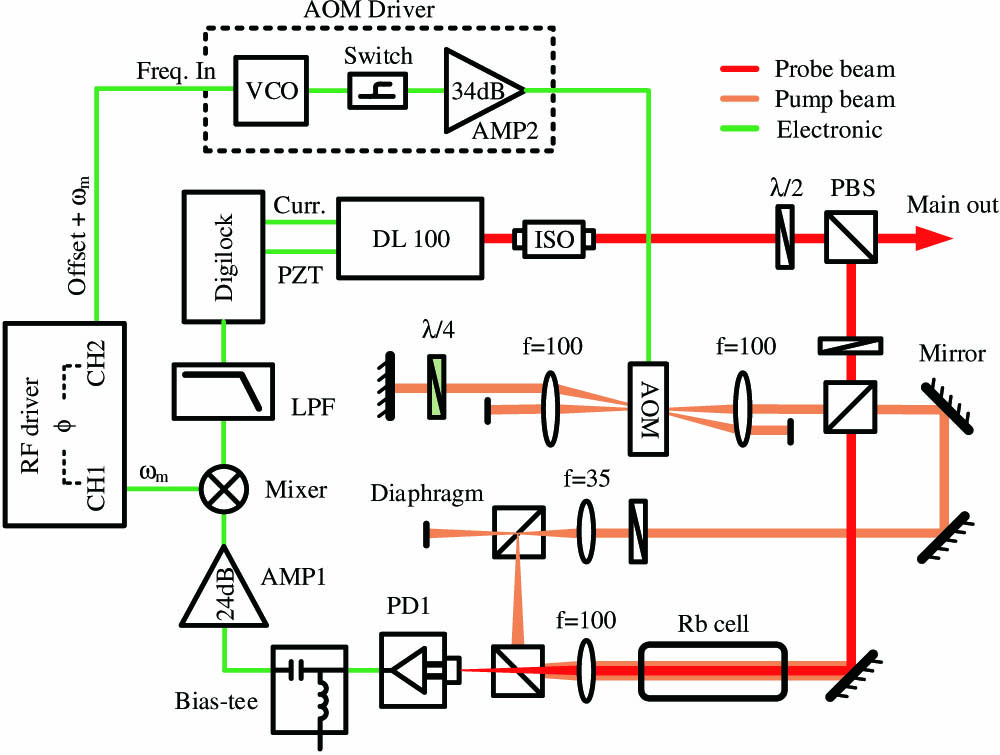
In this work, we demonstrate a laser locking system based on the AOMTS method and investigate the locking results of an external cavity diode laser (ECDL) with a selectable modulation frequency up to 15 MHz. The experimental setup is shown in Fig. 1. The laser device is a commercial ECDL (Toptica DL100) with the laser beam being reshaped to a diameter of 1 mm. A fraction of the output laser is split out for stabilization, which is further split into the pump beam and probe beam. We direct the pump beam through an AOM (AA, MT110) with a double-pass optical configuration to keep a fixed output optical angle during frequency shifting and modulating. The AC modulation signal is produced by a DDS-based RF driver (Rigol, DG4162), and is added to a constant voltage offset that determines the central frequency at which the AOM operates. The signal is then sent to the frequency control port (Freq. In) of the voltage controlled oscillator (VCO, AA, DRFA10Y-B-0-60.150) in the integrated AOM driver module. The modulated pump beam is expanded to a diameter of 4 mm. The pump and probe beam then counter propagate and overlap in the Rb vapor cell. The transmitting probe beam is detected by a transimpendence amplifier (TIA) photodetector (PD1, Thorlabs PDA10A) which is then DC eliminated by a bias-tee (Mini-circuits, ZX85-12G+) and further amplified by a 24 dB low noise amplifier (Mini-circuits, ZFL-500LN+). Phase demodulation is performed in the mixer (Mini-circuits, ZFM-3+) between the detection signal and a local modulation signal from the RF driver with a variable phase shift. After a sequential homemade low-pass filter with a cutoff frequency of around 700 kHz, the MTS error signal is obtained and then injected into the proportional–integral–derivative controller (Toptica Digilock110) to give a feedback adjustment to both the laser current and piezo. The powers of the pump and probe beam entering into the Rb vapor cell are chosen to be 3.8 and 4.8 mW, respectively, and the vapor cell is heated by a bifilar solenoid to at which the MTS signal is measured with a maximal peak-to-valley amplitude.
Figure 1.Experimental setup of the AOMTS system. ISO, optical isolator; PBS, polarizing beam splitters; LPF, low-pass filter; AMP, amplifier.
The saturated absorption spectrum and MTS signal are monitored at the output of PD1 and low-pass filter (LPF), respectively, which are shown in Fig. 2. Since the AOM applies an additional frequency shift (with an initial value of 110 MHz) to the pump beam from the probe beam, the saturated absorption spectrum gets shifted accordingly. With the double pass configuration, the offset should be exactly the center frequency applied to the AOM. The MTS signal follows the frequency offset and offers a shifted locking point from the original atomic hyperfine transitions. In addition, the locking point error arises from the residual amplitude modulation (RAM)[15,16], which is considered due to multiple factors including precision adjustment of the probe-pump beam spatial alignment, the optical path around the modulator, and the asymmetrical effects from the absorption medium. Here, a simple “trick” is adopted to suppress the RAM by evaluating the symmetry of the MTS signal and adjusting the mirrors that control the pump-probe beam overlap to reshape the MTS signal to a highly symmetrical profile, since the main mechanisms of RAM are found to be independent of each other and should be canceled out when the MTS signal gets symmetrical.
Figure 2.Typical saturated absorption spectrum and MTS signal.
Before the experimental investigation, we would like to briefly discuss the principle of MTS, especially for the AOMTS method. Generally, the MTS signal can be expressed in the form[17,18]where is the atomic transition linewidth, is the modulation frequency, is the modulation index that defines the relative amplitude ratio between the carrier signal and sidebands, is the th-order Bessel function, is the demodulation phase between the modulation signal and the local reference, and is a scale factor of the total response related to the laser intensity, detection PD1, TIA, and kinds of insertion loss. and are the absorption and dispersion functions, respectively.
Considering the case of AOMTS in the double pass configuration, the modulation signal is applied to the VCO with the control signal in the form of , where is the central frequency of the AOM, is the set frequency shift, is the AOM bandwidth within which a fairly acceptable diffraction efficiency can be expected, is a scale factor that maps the setting frequency to a specific voltage for VCO, and is the amplitude of the modulation signal. The laser instantaneous frequency shift can be expressed as , with the instantaneous phase variance being its integral as . Thus the modulation index is , which means that with a constant modulation signal amplitude, the modulation index differs with modulation frequencies. A common concern lies in the restrictions from the bandwidth of the AOM. The laser instantaneous frequency should be controlled within the AOM bandwidth . For the most tolerant case of , the constraint assumes , thus limiting . Since usual AOMs gain a bandwidth within several tens of MHz, while a higher modulation frequency often corresponds to a broader locking range, it limits the affordable modulation index. On the other hand, a higher modulation index can be reached at low modulation frequencies. However, we should still admit that for a common choice region of the modulation frequency, the AOMTS method still offers a wider selective range of the modulation index. In this condition, the form of the MTS signal in Eq. (1) can no longer be simplified with only the first two orders of the Bessel function, as many previous literatures do[10,18], which will give a different perspective on the MTS signal.
The laser frequency uncertainty is used as the most common feature for evaluating the lock performance. Taking into account the aliasing noises, a theoretical lower limit of laser frequency uncertainty can be described by where is the laser frequency at which to be locked, is the MTS locking slope, is the residual noises, is the frequency locking range defined by the distance between the peak and valley of the locking slope, and is the signal-to-noise ratio (SNR) of the MTS signal. Thus, the primary goal of optimization is to search for a maximal slope, as well as a high SNR. Since the SNR is almost fixed with specific experimental setups, here we theoretically focus on the MTS locking slope but will still involve some analysis of the experimental results from the view of systematic noises.
In order to find an optimal group of parameters, numerical calculations have been done beforehand. Figure 3(a) gives an overall trend of the achievable locking slope varying with the modulation frequency. In this case, at each frequency, the maximum slope is obtained with both the optimized modulation index and the demodulation phase. The trend shows that, with an unconstrained , a steeper slope is foreseen at lower modulation frequencies with an enhancement factor over 4 between 1 and 15 MHz. On the other hand, for a fixed , the slope peaks at a specific that decreases with the increase of . Figure 3(b) shows the comparison between the optimal modulation index and the upper limit restricted by the finite bandwidth of AOM, which is for the AOM model used in our experiment. A transcendental conclusion can be made that the finite AOM bandwidth would not perform as an obstruction, at least for the concerned modulation frequency below 15 MHz. Also, the dependence of the locking slope on the modulation index is investigated and is shown in Fig. 3(c). Consistent with Fig. 3(a), we can find a positive correlation between the achievable slope and the modulation index with optimal for each , and an inverse correlation between the optimal and . Moreover, we illustrate here a strong dependence of the choice of optimal phase on and [shown in Fig. 3(d)], which means rather than merely considering the absorption or dispersion component of the MTS signal, it is stricter in phase controlling for locking performance optimization.
Figure 3.Numerical and experimental results of parameter sweeping: (a)the achievable maximal locking slope versus the modulation frequency; (b) the optimal modulation index (blue) and the upper limit restricted by the AOM bandwidth (red); (c) the achievable maximal locking slope versus the modulation index; (d) the optimal demodulation phase versus the modulation frequency and index; (e) the measured FWHM linewidth versus the modulation index at 4 MHz in comparison with the theoretical prediction; and (f) the measured FWHM linewidth versus the modulation frequency at in comparison with the theoretical prediction.
According to the theoretical inference, experimental parameter sweeping has been done. The locking slope is measured by recording the frequency change of the locked laser while slightly shifting the locking point of the MTS signal in the voltage. The locked laser linewidth is then estimated with the measured slope and the residual noises in the MTS error signal using the method suggested in Ref. [19], which is proved to be a good approach for the low-pass filtered frequency noises recorded directly from the MTS error signal. Figures 3(e) and 3(f) demonstrate the experimentally measured FWHM linewidth varying with the modulation index and frequency, respectively. The demodulation phase is set with the calculated optimal value. Fixed values of and are chosen in Figs. 3(e) and 3(f), respectively. The results show a rough consistency in the basic tendency between the experimental data (black line) and the theoretical prediction, but still give some deviation especially at high modulation index and frequency. We think it is possibly due to the systematic effects including the nonuniformity of the AOM diffraction efficiency within the bandwidth and the frequency-dependent noises.
Since the original intention is to find an optimized working point considering all the controllable parameters, an overall scan of the modulation frequency is then carried out with the other parameters pre-optimized for each . The result is shown in Fig. 4. However, contrary to the theoretical prediction in Fig. 3(a), while a narrow linewidth is expected for low frequencies, a slight deterioration in the locked linewidth is found for modulation frequencies from 3 MHz and below. We mainly attribute it to the frequency-dependent noises in the experiment system, which can be clearly seen from the standard deviation (STD) of the residual errors in the MTS signal also shown in Fig. 4. Also, we do not suggest to use too low modulation frequencies, since a pre-filter is always needed to filter out the component of the modulation frequency, thus a low modulation requires an LPF with a low cutoff frequency but, on the other hand, it will decrease the sensitivity of the error signal to high-frequency fluctuations of the laser, thus leading to an insufficient feedback to the laser frequency fluctuations. Therefore, specific to the condition of our system, an optimal modulation frequency is chosen as 4 MHz with and . The optimized FWHM linewidth reaches at that configuration.
Figure 4.FWHM linewidth and the residual error STD of the MTS signal at different modulation frequencies.
The beat note signal is recorded with an RF spectrum analyzer (shown in Fig. 5) between two independent lasers locked by nearly identical AOMTS systems, with the output frequency of either one shifted via an additional AOM. The central part of the beat note spectrum is well fitted by the Lorentz line shape, with an FWHM linewidth of about 120 kHz, which indicates a single laser linewidth around 60 kHz. The FWHM linewidths derived from the beat note signal and the calculation with the MTS error signal show a high consistency, which confirms the accuracy of the measurement. Note that the outer part of the beat note is not well fitted with the Lorentz line shape. It is thought to be due to the effects of the systematic high frequency noise that is introduced in the beat note measurement but is shielded by the LPF in the MTS feedback loop.
Figure 5.Beat note spectrum between two MTS locked lasers.
Moreover, the laser frequency stability is also investigated in terms of the Allan variance. The Allan standard deviation (ADEV) estimated from the error signal with a total length of 500 s is demonstrated in Fig. 6. It shows a relative frequency stability of at 30 s with the AOMTS system. The long term stability is partly limited by the mediocre crystal oscillator reference used for the AOM driver and would be further improved by synchronizing with ultrastable frequency references such as an oven-controlled crystal oscillator and a rubidium clock. Other optimization efforts may be made on precision control of the laser power, vapor temperature, and magnetic field[20].
Finally, we test the frequency shifting capacity of the AOMTS system, since there are various applications in need of temporary control of the locked frequency to some extent. The shifting is performed within the AOM bandwidth by changing the offset voltage that controls the center frequency of the AOM diffraction. The frequency shifts and fluctuations are then recorded from the beat note signal by a frequency counter (Tektronix FCA3000). The results are shown in Fig. 7. A basic superposition can be found between the measured data and the expected curve in Fig. 7(a) throughout the AOM bandwidth. The residual errors in Fig. 7(b) illustrate a gradually increasing of the deviation from the set frequency while approaching the edge of the bandwidth. It is considered to be due to the RAM effect from the asymmetric diffraction efficiency varying with the frequency shifting. The deviation is restricted within . The error bars in Fig. 7(b) indicate the STD of the short-term frequency fluctuations, which reflect the laser linewidth variation during frequency shifting. The locking performance gets slightly worse at off-center frequencies, which is attributed to the constrained modulation amplitude and nonlinear effect of the VCO near the edge of its allowable input voltage. But even so, the frequency fluctuations are still well controlled within 150 kHz throughout the frequency shifting range. Thus, due to the good frequency precision, despite the relatively large deviation, we can manually control the offset voltage with proper modifications to compensate the specification errors, thus achieving a better frequency setting accuracy. In addition, a wider range of frequency shift can be predicted with higher bandwidth AOMs, but with possibly stricter requirements in optical alignment.
Figure 7.(a) Measured frequency shift and (b) the residual error in comparison with the expected curve.
In conclusion, we demonstrate a laser frequency locking system based on AOMTS and optimize the lock performance by revisiting the dependence on modulation frequency and modulation index, especially for the case of AOMTS, where the modulation index can be chosen in a wide range. An FWHM linewidth of 63 kHz is then achieved at a modulation frequency of 4 MHz and a modulation index of 2.7, with an ADEV of at 30 s. The frequency shifting capacity is then proved throughout the AOM bandwidth with a good precision and an acceptable accuracy to be used in various applications.
Yukun Luo, Shuhua Yan, Aiai Jia, Chunhua Wei, Zehuan Li, Enlong Wang, Jun Yang. Revisiting the laser frequency locking method using acousto-optic frequency modulation transfer spectroscopy[J]. Chinese Optics Letters, 2016, 14(12): 121401