1School of Optical and Electronic Information, National Engineering Laboratory for Next Generation Internet Access System, Huazhong University of Science and Technology, Wuhan 430074, China
2Department of Electronics and Information Engineering, Huazhong University of Science and Technology, Wuhan 430074, China
3Yangtze Optics Electronics Co., Wuhan 430074, China
This Letter shows the Vernier effect based on two segments of PANDA polarization maintaining fiber (PMF), whose lengths are 28 and 23 cm, respectively. The two PMFs are spliced together, and the angle between the fast axes is set to 45°. This cascaded PMF is inserted in a Sagnac loop to form an interferometer that can generate the Vernier effect. The spectrum consists of finesse fringe and envelope and realizes simultaneous measurement of strain and temperature. The envelope can provide strain and temperature sensitivities of 58.0 pm/με and 1.05 nm/°C. The finesse fringe provides sensitivities of 5.9 pm/με and 1.36 nm/°C.
Fiber optic strain sensors are important candidates for structural health monitoring and distributed sensing applications[1,2]. Compared with traditional strain sensing methods, fiber optic sensing has a lot of distinctive advantages, such as compact size, simplicity of fabrication, immunity to electromagnetic interference, and high resolution[1]. To date, many different kinds of fiber devices have been proposed for strain sensing, such as the fiber grating and fiber interferometer. For fiber grating strain sensors, a fiber Bragg grating (FBG)[3] and a long period grating (LPG)[4] are both potential sensing elements and have been widely studied. These sensors are easy to fabricate but suffer from low strain sensitivities. The typical strain sensitivity is only for an FBG and for an LPG. For the other type, interferometric fiber sensors show higher sensitivity but usually have a relatively complicated manufacturing process[5]. Besides, the Vernier effect is a method that can sharply improve the sensitivity[6], but the sensor based on the Vernier effect usually needs two independent interferometers and has a complicated structure.
A common problem for the sensors mentioned above is that the strain sensing will be disturbed by temperature. To overcome this problem, multi-parameter simultaneous measurement sensors based on the matrix method become an attractive solution. An alternative way is to design an interferometer based on multimode interference[7,8]. This method realizes multi-parameter simultaneous sensing using the difference of diverse modes. But, this kind of sensor is limited by low repeatability. Another way is to cascade two independent fiber devices with different sensitivities[9]. But, this method still faces the challenge of complicated structure and high cost.
In this Letter, a Sagnac interferometer based on a cascaded PANDA polarization maintaining fiber (PMF, YOEC, 125 μm) is demonstrated for simultaneous measurement of temperature and strain. Since the two PMFs introduce different optical path differences, the spectrum of this structure will contain different frequency components. Through theoretical calculating, it is found that the different frequency can generate the Vernier effect. In the experiment, a theoretically compliant spectrum is obtained. This Vernier spectrum is composed of finesse fringe and an envelope. The envelope and finesse fringe show strain sensitivity of 58.0 and , respectively. The temperature sensitivities are and . Using the coefficient matrix, simultaneous measurement is realized. This sensor is simple and easy to fabricate with good repeatability and low cost. So, it is a suitable candidate for engineering applications.
Sign up for Chinese Optics Letters TOC. Get the latest issue of Chinese Optics Letters delivered right to you!Sign up now
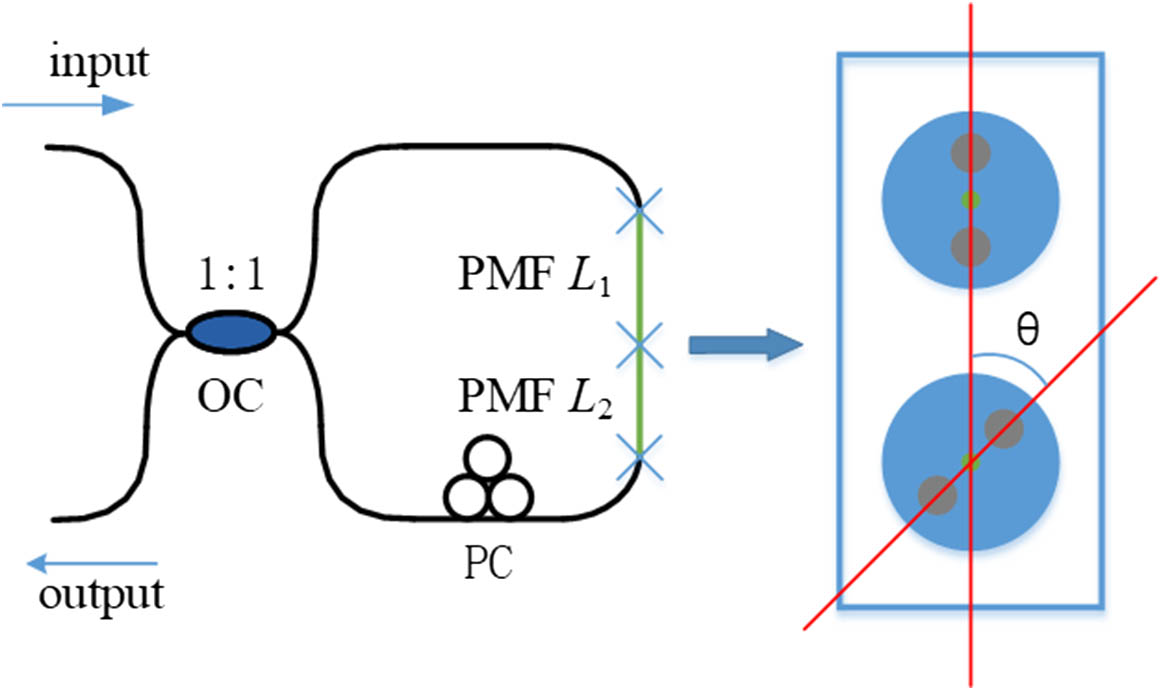
Figure 1 illustrates the schematic diagram of the proposed sensor. It contains a 3 dB optical coupler (OC) with a conventional single-mode fiber, a polarization controller (PC), and two segments of PANDA PMF, whose lengths are 28 and 23 cm, respectively. The birefringence of the PMF is 0.0006. The two segments of PMF are spliced together by a special fusion splicer (Fujikura, FSM-100 P+). Using this splicer, the end face of the PMF can be observed in the splicing process. The sectional view of the splicing point is shown in Fig. 1. Thus, it can be ensured that the angle between the fast axes of the two PMFs is 45°. The 3 dB coupler splits the input light into two waves propagating in the reverse direction. After traveling the loop, light recombines at the coupler and forms the output light. The transmission spectrum of this device can be obtained using the Jones matrix. For this fiber device, the output light can be described as Here, , , , and represent the electric intensity in different polarization states for input and output light. and are the rotation angles that can be adjusted by the PC. and describe the polarization rotation angle of the polarization axis on the splicing point, which can be expressed as is the Jones matrix that describes the two spliced PMFs when light moves clockwise along the Sagnac loop. is the matrix when light moves counterclockwise. They have the forms where is the angle between the fast axes of two PMFs, and , are the phase differences caused by two PMFs, respectively. In these formulas, is the wavelength, , are the lengths of two PMFs, and is the birefringence of the PMF. By combining the equations above, the transmission function of this structure can be obtained:
This formula shows that the structure has potential for the Vernier effect. When parameters are suitable, the transmission spectrum will be composed of the finesse spectrum decided by and the envelope decided by . To generate the Vernier effect, the length of PMF1 should be set close to PMF2, and determines the weight of two frequency components. As mentioned above, the parameters in the experiment are designed as , , , and . In the following simulation, is set as 0.5, and other parameters are set to be the same as the actual experiment situation. The simulation and experiment spectra are shown in Fig. 2. It can be seen that the contrast of the experiment spectrum decreases with decreasing wavelength. The variation of contrast is caused by a coupler. In such a large wavelength range, the coupling ratio moves away from 1:1 and the contrast decreases. Apart from this point, the two spectra contain familiar finesse fringes and envelopes, whose free spectral ranges (FSRs) are about 16 and 80 nm. The two FSRs match well with the calculation. Thus, it can be concluded that the experiment is in good agreement with the theory.
Figure 2.Experiment and simulation spectra of the proposed sensor.
For the proposed sensor that is based on cascaded PMF, strain is applied on one PMF, and temperature change is applied on two PMFs in the sensing process. With the variation of temperature or strain, the envelope and finesse fringe will both shift. As discussed above, the peaks of the envelope are decided by , and the peaks of the finesse fringe are decided by . So, by analyzing these two formulas, the spectrum shift can be calculated.
In order to calculate the sensitivities of the two PMF-based sensors, the inherent character of the PMF should be studied. For a single PMF-based Sagnac interferometer, the spectrum will have a shift when the strain or temperature changes. This shift is directly proportional to strain and temperature differences but has nothing to do with the length of the PMF[10,11]. So, a formula for strain sensitivity is obtained: and a formula for temperature sensitivity can be expressed as where is the length of the PMF, is the wavelength shift caused by strain, is the variation of birefringence of the PMF caused by strain, is the length change of the PMF, is the change of strain, and is the strain sensitivity of sensors based on a single PMF. Besides, , , , , and are the parameters related to temperature change.
Based on the sensitivities of a single PMF, the sensitivities of a cascaded PMF can be calculated. For the cascaded PMF, part of PMF1 whose length is is used to sense strain. The envelope shift caused by strain can be expressed as where is the wavelength shift, is the length change of the sensing PMF, and is the strain sensitivity of the envelope. Compared with Eq. (6), it can be found that the envelope is more sensitive than the spectrum of a single PMF when is large enough. The sensitivity is shown as
The amplification factor of the Vernier effect is expressed as
The strain sensitivity of the finesse fringe, and temperature sensitivity of the envelope and finesse fringe can also be obtained in the same way. They are expressed as
As can be seen in the four formulas, the sensitivities of the proposed sensor are decided by the length of PMF and the inherent sensitivities of the PMF. Compared with the single PMF-based interferometer, the envelope’s sensitivity is amplified, and the finesse fringe’s sensitivity is reduced for strain sensing. As for temperature sensing, the envelope and finesse fringe have the same sensitivity with the single PMF-based interferometer. The envelope and finesse fringe have different reactions when they face the change in strain and temperature. This feature has the potential to realize simultaneous measurement of strain and temperature. The shifts can be given by the coefficient matrix, where and are the measured shifts of the envelope and finesse fringe.
To demonstrate the actual performance of the proposed sensor, a strain and temperature measurement experiment has been conducted. Besides, for comparison, a sensing experiment based on a single PMF Sagnac interferometer was also performed.
The schematic diagram of the experiment setup for strain sensing is shown in Fig. 3. To obtain the real-time transmission spectrum of the fiber device, an optical spectrum analyzer (OSA, Yokogawa AQ6370c) and a broadband light source (BBS) are employed in experiment. Two translational stages are used to apply strain on the fiber. In the experiment, the sensing PMF is fixed on the stage by fiber holders, and the original interval between two stages is . The distance of two translational stages can be adjusted at a step of 10 μm. In addition, temperature measurement is realized by using a thermal electric cooler (TEC) whose temperature resolution is 0.1°C.
Figure 3.Schematic of the experimental setup for strain measurement.
Firstly, a temperature and strain sensing experiment based on a single PMF Sagnac interferometer was conducted. The spectra of the strain and temperature measurements are shown in Figs. 4(a) and 4(b). It is clear that the spectrum shifts to longer wavelengths when strain increases, and the spectrum shifts to shorter wavelengths when the temperature increases. Then, a certain dip is traced to represent the shift. The variations of the traced dip are shown in Figs. 4(c) and 4(d). Using linear fitting, the strain and temperature sensitivities of the PMF can be achieved at and .
Figure 4.Experiment results for a single PMF Sagnac interferometer with (a) the spectrum variation with strain increasing, (b) the spectrum variation with temperature increasing, (c) dip shift with strain variation, and (d) dip shift with temperature variation.
Then, the experiment for two PMF-based Sagnac interferometers was performed. One of the PMFs is put on a translational stage to measure strain. The length is 12.5 cm, and the minimum step of the translational stage is 10 μm, correspondingly applied at at one time. Strain is applied from 0 to . The transmission spectra for are shown in Fig. 5(a). The envelope is indicated as the red line.
Figure 5.(a) The experiment spectrum and the envelope of it. (b) The variation of the fitted envelope with increasing strain.
Here, the finesse fringe shift can be achieved by tracing a random peak of the spectrum. But, for the envelope, the envelope peaks cannot be read directly from the modulated transmission spectrum. Therefore, a curve fitting method is used to recognize the envelope peaks[12,13]. In this method, the first step is to select a section of the spectrum that contains an envelope peak. Then, by employing the Gauss function fitting, the envelope curve is recognized. Finally, the relatively accurate envelope peak can be calculated. The fitted envelopes in different strains are shown in Fig. 5(b). It clearly shows that the envelopes shift to longer wavelengths with the increasing strain. For convenience, the envelope peak is named peak1, and the finesse fringe peak is named peak2. The relationship between the strain and wavelength shifts is shown in Fig. 6. After linear fitting, the strain sensitivities for peak1 and peak2 are obtained as 58.0 and . Consistent with theoretical analysis, there is a big difference in these two sensitivities. As shown in a previous experiment, the strain sensitivity of the single PMF is . The actual amplification factor of the Vernier effect is 2.9. According to Eqs. (9)–(11), the experiment results basically agree with the theoretical calculations. However, there still exists some error that cannot be ignored, which may be caused by the inaccuracy of the fiber length.
Figure 6.Relationship between the wavelength and strain for the proposed sensor.
The temperature performance of the proposed structure is also demonstrated in the experiment. In the measuring process, both PMFs are placed on the TEC. Then, two segments of the PMF are heated from 20°C to 80°C at steps of 5°C. After getting the spectrum at different temperatures, the shifts of peak1 and peak2 can be obtained in the same way as the strain sensing experiment. The relationship between the temperature and wavelength of the peaks is shown in Fig. 7. Here, it is clear that the two peaks both shift to a shorter wavelength when the temperature increases. Using linear fitting, temperature sensitivities of peak1 and peak2 are calculated to be and . As shown in a previous experiment, the temperature sensitivity of a single PMF is . The difference between these three sensitivities is small, which is consistent with Eqs. (12) and (13). So, the experiment is in good agreement with the theoretical calculation.
Figure 7.Relationship between the wavelength and temperature for the proposed sensor.
Based on the strain and temperature sensitivities obtained in the experiment, simultaneous measurement can be realized based on Eq. (14). In this study, , , , and are , , , and , respectively. Strain and temperature can be calculated as
In conclusion, a novel Sagnac fiber interferometer is proposed and demonstrated to realize simultaneous measurement of strain and temperature. This interferometer is based on a cascaded PMF and can generate the Vernier effect in such a simple structure. The experiment shows that the strain sensitivities are 58.0 and for the envelope and finesse fringe in the range of 0 to . In the meantime, temperature can be sensed with sensitivities of and for the envelope and finesse fringe in the range of 20°C to 80°C. This sensor has a simple structure that is easy to fabricate with high repeatability and low cost. Therefore, it may be a suitable candidate for practical engineering applications.