
Dongdi Zhao, Yongpeng Zhao, Huaiyu Cui, Bo An, Lei Li, Yunsong Bai, "Effect of delay time between pre-pulse and main pulse on single-pass and double-pass amplification of 46.9 nm laser," Chin. Opt. Lett. 21, 053401 (2023)
- Chinese Optics Letters
- Vol. 21, Issue 5, 053401 (2023)
Abstract
1. Introduction
In order to generate the 46.9 nm laser pumped by the fast capillary discharge, it is necessary to use a pre-pulse current with an amplitude of tens of amperes to pre-ionize the Ar gas in the capillary into an initial plasma. After a specific delay time, the initial plasma is pinched by the main pulse current to generate the plasma column with a high electron density and a high electron temperature and an output of Ne-like Ar 46.9 nm laser. In 1994, Rocca et al. achieved the first 46.9 nm laser output by a fast capillary discharge device[1]. The delay time between the pre-pulse and the main pulse in this experiment was about 2 µs. After that, the researchers carried out a detailed study on the effect of the pre-pulse current on the 46.9 nm laser. In 2007, Tan et al. studied the effect of delay time between the pre-pulse and the main pulse on the 46.9 nm laser[2]. It was found that the laser intensity increased significantly in the range of 2 µs to 4 µs, the laser intensity was less affected by the delay time in the range of 4 µs to 30 µs, and the laser intensity decreased rapidly with the increase of the delay time when the delay time exceeded 30 µs.
In 2012, our group carried out a corresponding study on the influence of the delay time on the output laser intensity in the range of 2–130 µs[3]. It was found that the laser intensity reached the maximum when the delay time was 12 µs, and the laser intensity changed slowly when the delay time was longer than 40 µs. The above results show the effect of the delay time on the temporal characteristics of the 46.9 nm laser. However, there is little research on the relationship between the spatial characteristics of the 46.9 nm laser and the delay time, and all the above experiments are based on the single-pass amplified laser experiments without a cavity. Rocca et al. carried out the first double-pass amplified 46.9 nm laser experiment in the world with an Ir mirror in 1996[4]. However, the Ir mirror would be damaged by the plasma column after 1–3 discharge shots. Therefore, their team did not provide the experimental results of the temporal and spatial characteristics of the double-pass amplified 46.9 nm laser. In 2021, our group obtained the double-pass amplified 46.9 nm laser with a SiC mirror[5], but we only provided the experimental results corresponding to one kind of spatial distribution. According to our theoretical results, the spatial distribution will affect the double-pass amplification of the 46.9 nm laser. Therefore, it is necessary to change the laser spatial distribution in the double-pass amplification experiments. In previous experiments, we found that the delay time between the pre-pulse and the main pulse can change the spatial distribution of the laser.
In this paper, to the best of our knowledge, the relationship between the double-pass amplified 46.9 nm laser and the delay time was studied for the first time. In order to study the effect of the delay time on the spatial characteristics of the 46.9 nm laser in detail, we used a theoretical model to simulate the spatial distribution of the single-pass and double-pass amplified 46.9 nm lasers. In previous reports, many groups have used the ray-tracing code to simulate the spatial distribution of the X-ray laser[6–9]. However, to the best of our knowledge, there is no report on the theoretical model of the double-pass amplified 46.9 nm laser.
Sign up for Chinese Optics Letters TOC. Get the latest issue of Chinese Optics Letters delivered right to you!Sign up now
In the experiment, the characteristics of the single-pass and double-pass amplified 46.9 nm lasers with different delay times were measured. In theory, a theoretical model was built to study the laser spatial distributions of the single-pass and double-pass amplified 46.9 nm laser. This theoretical model constructed by the ray-tracing code was used to simulate the spatial distributions of the 46.9 nm laser with different electron density distributions and gain coefficient distributions. The experimental results about the double-pass amplified 46.9 nm laser will help to improve the laser performance and to expand the application range of the 46.9 nm laser.
2. Experimental Setup
The capillary discharge device used in this study has been introduced in the previous paper[10]. The capillary used in this experiment was an
3. Experimental Results and Discussions
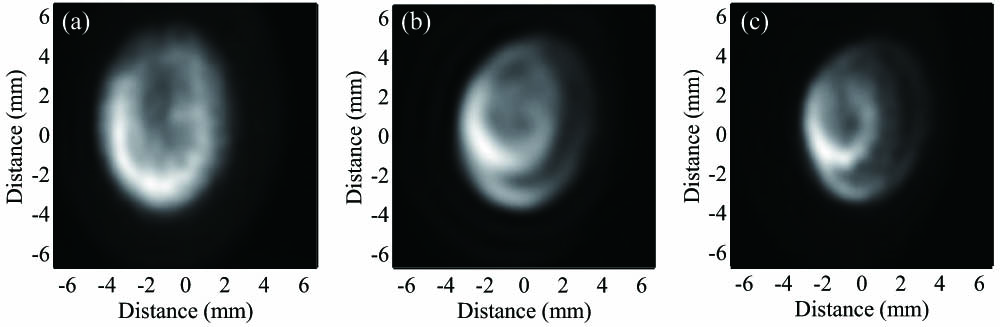
Firstly, the spatial characteristics of the single-pass amplified laser corresponding to different delay times between the pre-pulse and the main pulse were measured. Here, we selected three typical laser spots, which correspond to the delay times of 10 µs, 60 µs, and 75 µs, as shown in Fig. 1. When the delay time is 10 µs, the laser spot shows a single annular-shaped distribution, and the peak-to-peak divergence is 2.6 mrad. The single annular-shaped distribution is formed by the refraction of the X-rays in the plasma column. The refraction effect is related to the electron density gradient in the radial direction. When the delay time is 60 µs, the laser spot shows a double annular-shaped distribution, and the peak-to-peak divergence of the outer annulus is 3.1 mrad. When the delay time is 75 µs, the laser spot also shows a double annular-shaped distribution, and the peak-to-peak divergence of the outer annulus is 2.6 mrad. The possible formation reason for the double annular-shaped distribution is that some X-rays in the small density gradient region will propagate in the plasma column at a small angle and be concentrated near the axis, which has been introduced in the previous paper[9].
![]()
Figure 1.Laser spatial distributions corresponding to delay times between pre-pulse and main pulse of (a) 10 µs, (b) 60 µs, and (c) 75 µs.
After measuring the laser spatial distributions of the single-pass amplified laser and selecting three typical laser spots, the laser pulses corresponding to the three delay times were measured by XRD, as shown in Fig. 2. When the delay time is 10 µs, the laser signal amplitude is 6.8 V, the laser energy is about 290 µJ, and the laser pulse width is 1.2 ns. When the delay time is 60 µs, the laser signal amplitude is 5.4 V, the laser energy is about 240 µJ, and the laser pulse width is 1.1 ns. When the delay time is 75 µs, the laser signal amplitude is 5.4 V, the laser energy is about 260 µJ, and the laser pulse width is 1.2 ns. In Ref. [3], it was found that the laser intensity reached the highest at about 12 µs and changed little after 40 µs. The results in this paper are consistent with Ref. [3]. Therefore, it can be seen that the delay time can influence the laser energy and the spatial distribution of the single-pass amplified 46.9 nm laser.
![]()
Figure 2.The laser pulse signals corresponding to different delay times.
Next, a high-precision polished SiC mirror was placed at the end of the capillary to realize the double-pass amplification experiment. Figure 3 shows the double-pass amplified laser spots. Comparing the single-pass amplified laser spots in Fig. 1 with the double-pass amplified laser spots in Fig. 3, it can be found that the spatial distributions are quite different. When the delay time is 10 µs, it changes from the single annular-shaped distribution to the double annular-shaped distribution. The peak-to-peak divergence of the outer annulus of the double-pass amplified laser is about 3.2 mrad, 0.6 mrad more than that of the single-pass amplified laser. When the delay time is 60 µs, for the single-pass amplified laser, the peak amplitudes of the inner annulus and the outer annulus are nearly equal. However, for the double-pass amplified laser, the peak amplitude of the outer annulus is nearly 1.6 times as large as that of the inner annulus, and the peak-to-peak divergence of the outer annulus is about 3.2 mrad, which is nearly equal to that of the single-pass amplified laser. When the delay time is 75 µs, for the single-pass amplified laser, the peak amplitude of the inner annulus is nearly twice as large as that of the outer annulus. However, for the double-pass amplified laser, the peak amplitude of the outer annulus increases more than that of the inner annulus, and the peak-to-peak divergence of the outer annulus is about 2.6 mrad, which is nearly equal to that of the single-pass amplified laser.
![]()
Figure 3.The double-pass amplified laser spots and their intensity distributions.
Finally, the temporal characteristic of the double-pass amplified 46.9 nm laser was measured by XRD. As shown in Fig. 4, the delay time affected the amplitude and width (full-width at half-maximum) of the double-pass amplified laser pulse. When the delay time is 10 µs, the laser signal amplitude is 10.0 V, the laser energy is about 560 µJ, and the laser pulse width is 1.8 ns. When the delay time is 60 µs, the laser signal amplitude is 13.0 V, the laser energy is about 890 µJ, and the laser pulse width is 2.0 ns. When the delay time is 75 µs, the laser signal amplitude is 8.0 V, the laser energy is about 510 µJ, and the laser pulse width is 1.7 ns. The reason why only one peak can be seen in Fig. 4 is the partial overlap and addition of the first-pass and the second-pass laser pulses.
![]()
Figure 4.The double-pass amplified laser pulse signals corresponding to different delay times.
Table 1 shows the double-pass amplification compared with the single-pass amplification corresponding to the different delay times. As shown in Table 1, the double-pass amplification of 60 µs has the largest laser signal amplitude, the largest magnification, and the widest laser pulse width. Therefore, the feedback laser is amplified most obviously at 60 µs among the three delay times rather than at 10 µs. This may be caused by the fact that more X-rays are concentrated near the axis when the delay time is 60 µs. The X-ray concentrated near the axis has a small divergence angle, which allows more X-rays to enter the plasma column after the reflection from the SiC mirror. This means that the intensity of the feedback laser when the delay time is 60 µs is higher than that of 10 µs.
| Delay Time (µs) | Single-pass Amplified Laser Energy (µJ) | Double-pass Amplified Laser Energy (µJ) | Magnification in the Laser Energy | Laser Pulse Width of the Single-pass Amplification (ns) | Laser Pulse Width of the Double-pass Amplification (ns) | Increase in the Laser Pulse Width (ns) |
|---|---|---|---|---|---|---|
| 10 | 290 | 560 | 1.93 | 1.2 | 1.8 | 0.6 |
| 60 | 240 | 890 | 3.71 | 1.1 | 2.0 | 0.9 |
| 75 | 260 | 510 | 1.96 | 1.2 | 1.7 | 0.5 |
Table 1. The Double-pass Amplification Compared with the Single-pass Amplification Corresponding to Different Delay Times
It can be found that the double-pass amplification effects are different with different delay times. We attribute this to the difference in the electron density distributions and gain coefficient distributions corresponding to the different delay times. In order to prove this analysis, a theoretical model based on the ray-tracing code was used to simulate the spatial distributions of single-pass and double-pass amplified 46.9 nm lasers. The theoretical model of the single-pass amplified 46.9 nm laser is established according to the theories introduced in Refs. [6,7]. Based on this theoretical model, the feedback laser reflected by the mirror is considered in the theoretical model during the calculation of the double-pass amplified laser spot. The intensity of the feedback laser is
Many different types of electron density distributions and gain coefficient distributions have been tried in order to make the simulation spot close to the experimental spot. During the calculation, we found that some different types of curves can obtain similar results to the experimental single-pass amplified laser spot or double-pass amplified laser spot. However, it was hard to find curves that fit both the laser spots. Figure 5 shows a set of curves that are suitable for the experimental single-pass amplified laser spot and double-pass amplified laser spot. We considered that these electron density distributions and gain coefficient distributions may be close to the actual distributions.
![]()
Figure 5.The radial distributions of (a) the electron density and (b) the gain coefficient corresponding to different delay times.
Figures 6–8 show the single-pass amplified and double-pass amplified laser spatial distributions and the intensity distributions in the vertical direction calculated by using the theoretical model. In order to compare with experimental results, the intensity distributions corresponding to the laser spot in Figs. 1 and 3 are also shown in Figs. 6–8. As shown in Figs. 6–8, the simulation spatial distributions are close to the experimental spatial distributions. The divergences of the simulation laser spots are nearly equal to that of the experimental laser spots. The simulation ratios between the inner annulus’ peak amplitudes and the outer annulus’ peak amplitudes are also nearly equal to the experimental ratios. Therefore, we consider that the variation of the plasma column state at the time of maximum laser intensity, including the electron density fraction and gain coefficient distribution, results in the variation of the laser energy and spatial distribution.
![]()
Figure 6.The simulation spot and the intensity distribution in the vertical direction of (a), (b) the single-pass amplified laser and (c), (d) the double-pass amplified laser at 10 µs.
![]()
Figure 7.The simulation spot and the intensity distribution in the vertical direction of (a), (b) the single-pass amplified laser and (c), (d) the double-pass amplified laser at 60 µs.
![]()
Figure 8.The simulation spot and the intensity distribution in the vertical direction of (a), (b) the single-pass amplified laser and (c), (d) the double-pass amplified laser at 75 µs.
Based on the theoretical simulation results in Figs. 5–8, we can explain that the best delay time for double-pass amplification is 60 µs rather than 10 µs. The refraction effect is one of the main factors affecting the 46.9 nm laser intensity, especially in the process of double-pass amplification. The refraction effect may cause the feedback laser to emit from the edge of the plasma column very early. Therefore, the second-pass amplified laser may only have a small gain length product. As shown in Fig. 5, the laser output from the plasma column at 60 µs has a smaller electron density gradient compared to that at 10 µs. The feedback laser is less affected by the refraction effect when propagating in the plasma column. This results in a larger gain length product for the second-pass amplified laser. Compared to 10 µs, the double-pass amplification of 60 µs has a larger feedback laser intensity and a larger gain length product for the second-pass amplified laser. Therefore, 60 µs is more suitable than 10 µs for double-pass amplification. We attribute the variation of the plasma column state with the delay time to the radial inhomogeneity of the initial plasma column introduced in Ref. [11]. In Ref. [11], it is found that the initial plasma generated by the pre-pulse is radially inhomogeneous and changes with time. Therefore, when the main pulse flows through the initial plasma at different delay times, the state of the plasma column generated by the main pulse will be different. As a result, the laser energy, spatial distribution, and double-pass amplification effect corresponding to different delay times are different.
4. Conclusion
In this paper, a series of single-pass and double-pass amplified 46.9 nm laser experiments are carried out by changing the delay time between the pre-pulse and the main pulse. To the best of our knowledge, this is the first regular experiment with the double-pass amplified 46.9 nm laser in the world. For the single-pass amplification, in terms of the temporal characteristics, the laser energy at 10 µs is the largest, the laser energy at 60 µs is larger than that at 75 µs, and their pulse widths are nearly equal. In terms of the spatial characteristics, the laser spot at 10 µs shows a single annular-shaped distribution, the laser spots at 60 µs and 75 µs show double annular-shaped distributions, and the peak-to-peak divergence decreases gradually with the increase of the delay time. For the double-pass amplification, in terms of temporal characteristics, the double-pass amplified laser at 60 µs has the highest laser signal energy and the widest laser signal width. Compared with the single-pass amplified laser signal, the energy enhancement of the double-pass amplified laser pulse was about
In theory, we obtain the simulation laser spatial distributions, which are similar to the experimental results, by using the theoretical model. By analyzing the results, we find that the plasma column with a small electron density gradient is more suitable for double-pass amplification. In addition, we consider that the variation of the plasma column state at the time of maximum laser intensity will affect the laser characteristics of single-pass amplification and double-pass amplification. This variation may be related to the initial plasma state. In conclusion, changing the delay time can change the single-pass laser characteristics and the double-pass amplification effect. This can provide larger energy and wider pulse width of the 46.9 nm laser and help broaden the application range of the 46.9 nm laser. In future work, we will continue to explore the influence of the initial plasma state on laser characteristics.


Set citation alerts for the article
Please enter your email address

© Copyright 2018-2021 | Chinese Laser Press. All Rights Reserved 沪ICP备15018463号-20