1School of Physics and Optoelectronic Engineering, Nanjing University of Information Science and Technology, Nanjing 210044, China
2Jiangsu Collaborative Innovation Center on Atmospheric Environment and Equipment Technology, Nanjing University of Information Science and Technology, Nanjing 210044, China
3School of Electronic & Information Engineering, Nanjing University of Information Science and Technology, Nanjing 210044, China
4Jiangsu Key Laboratory of Meteorological Observation and Signal Processing, Nanjing University of Information Science and Technology, Nanjing 210044, China
Fang Gu, Yi Liu, Jiahong Zhang, Yunyun Chen, Fengping Cui. Research on the fractal model and calibration of the aerosol mass concentration measurement based on the particle group light scattering[J]. Chinese Optics Letters, 2016, 14(11): 112901
Copy Citation Text
In order to improve the inversion precision of aerosol mass concentrations based on the particle group light scattering method, the concept that particles through a laser beam are equivalent to an aggregate is proposed. A fractal model for aerosol mass concentration using the signal amplitude distribution of aggregates is presented, and then the subsection calibration method is given. The experimental results show that the mass concentrations inversed by this model agree well with those measured by the norm-referenced instrument. The average relative errors of the two experiments are 5.6% and 6.0%, respectively, which are less than those obtained by the conventional inversion model.
Environmental pollution has become a global concern and attracts much attention. One of the most important environmental problems is that the aerosol mass concentration increases continuously, which leads to many negative effects on human health and the atmospheric environment, such as causing respiratory and lung disease[1], reducing atmospheric visibility[2,3], and affecting the energy budget of the Earth-atmosphere system and climate change by absorbing and scattering solar radiation[4]. Therefore, determining how to accurately monitor and control the concentration of atmospheric aerosols is an urgent and significant task.
The light scattering method has been widely applied to monitor the environmental air quality and some dangerous environments in mining, fire scenes, and so on, due to the advantages of high speed, high precision, good repeatability and stability, as well as real-time noncontact measurements[5–9]. It is mainly divided into two categories: the single-particle light scattering method (the single-particle counting technique) and the particle group light scattering method (the ensemble-measuring technique). The former, based on the scattering of a single particle, can simultaneously measure the number and mass concentration of particulate matter[10–12]. A review of the related research has been carried out by the authors and the fractal model for aerosol mass concentration by using the pulse signal amplitude distribution obtained by the particle counting method has been proposed in previous literature[10,13]. At present, the commercial instruments using this method mainly include Grimm particle analyzers (Grimm Company’s 1100 series, Germany), which inverse the mass concentration of particulate matter by simultaneously measuring scattering light signals of a plurality of particles[14,15]. The advantages of this method are that it is suitable for online measurements of high concentration aerosols and it is more sensitive to the scattered light signal generated by small particles[16]. The commercial instruments on the basis of the ensemble-measuring technique mainly include the personal aerosol monitor AM510 (TSI corporation, USA) and EPAM–5000par-ticulate monitor (SKC corporation, USA).
However, for the particle group light scattering method, the integrated optical signal is commonly utilized to inverse the aerosol mass concentration in the existing models, which results in loss of the information details. Meanwhile, the morphology of particles has not been considered. Owing to the two reasons, the measurement accuracy must be reduced. Therefore, the measurement theory of aerosol mass concentration based on the particle group light scattering needs to be further investigated. On the basis of the preliminary study[10,13], the measured particles are equivalent to an aggregate in view of the light signal information of particles needing to be refined. A fractal model for aerosol mass concentration by using the scattering light pulse signal amplitude distribution of aggregates is proposed, and then the corresponding calibration method is also investigated.
Sign up for Chinese Optics Letters TOC. Get the latest issue of Chinese Optics Letters delivered right to you!Sign up now
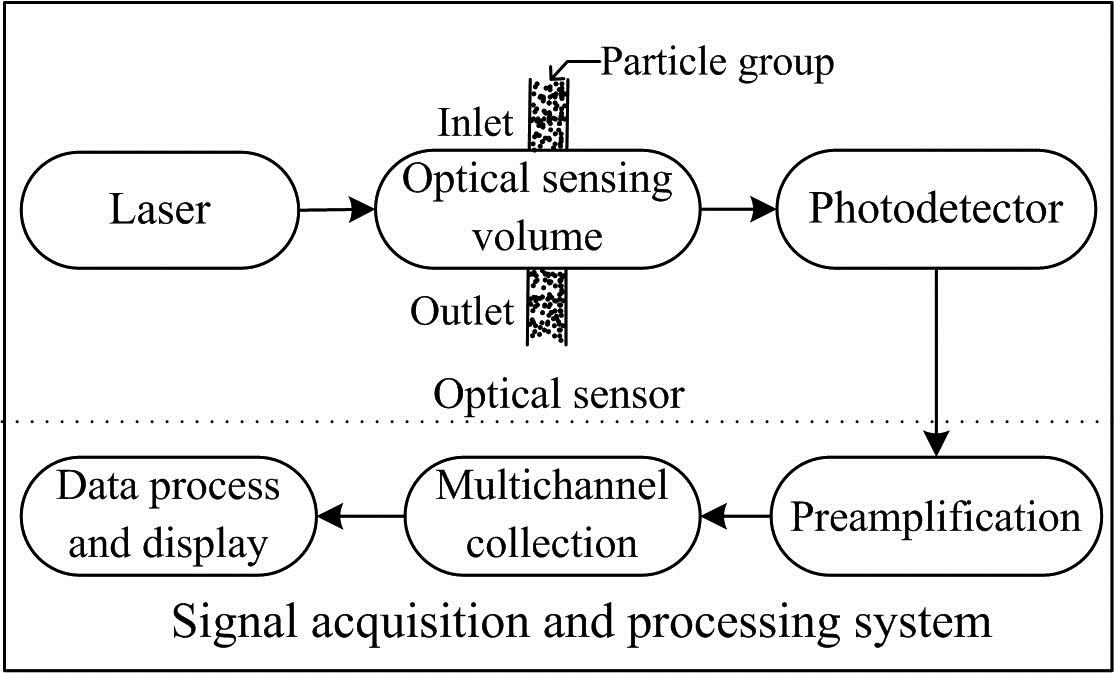
A schematic diagram of the light scattering system, which includes an optical sensor and the signal collecting, processing, and displaying modules, is shown in Fig. 1. When particles perpendicularly flow through an optical sensing volume within the optical sensor, the laser is scattered by the particle group. The cross section of the optical sensing volume is the photosensitive surface, and the length and width of the photosensitive surface is about 5 and 0.5 mm, respectively. The diameter of the laser beam is about 0.7 mm. The scattered light is collected by a spherical reflector in a solid angle of 90°, then converted to an electrical pulse by a photodetector. Through preamplification and multichannel collection, the voltage pulse of the particle group is finally obtained, which can be equivalent to the voltage pulse signal of a particle aggregate. The sampling frequency of the scattered light signal of the particles is 10 MHz. The schematic diagram of the equivalent particle aggregate is displayed in Fig. 2, and a set of discrete particles (particle group) is treated as a particle aggregate. In a measurement cycle, the voltage pulses of the tested particle aggregates are recorded, and the number of voltage pulses is the number of particle aggregates. Because the voltage pulse amplitude distribution of particle aggregates is correlated to their sizes and shape, they provide an accurate way to measure the aerosol mass concentration of a particle group.
Figure 1.Schematic diagram of the measurement system for aerosol mass concentration.
According to the measurement principle of particle group light scattering discussed above, the number of the voltage pulse signals output from the photoelectric detector is the information about the number of the equivalent aggregates, while the amplitude of the pulse signal contains the mass and the morphology information of particle aggregates. This section will mainly focus on how to use the voltage pulse signal to inverse the aerosol mass concentration. Based on the definition of mass concentration, it is the total mass of particles in per unit volume. Using the concept of the particle aggregate illustrated in Fig. 2, the aerosol mass concentration obtained by the measurement system in this Letter is given by where is the total number of aggregatesper unit volume and represents the mass of an aggregate.
On the basis of Eq. (1), the mass of each aggregate per unit volume should be given by using the number and the amplitude of the voltage pulses. However, the morphology of aggregates that are made up of primary particles is very complicated because it is closely related to the composite structure of primary particles and the morphology of each primary particle. Obviously, a large error will be caused by making use of the mass formula for spherical particles to calculate the mass of the aggregate. Therefore, the aggregates that have the same amplitude of scattered light signals are classified as a subset, and the measured aggregates are finally divided into a series of subsets. It is noteworthy that, although the scattering intensities of these aggregates in the same subset are equal, their masses are different. It should also be noted that due to the randomness of the particle flow and morphology, the average mass of the subset of aggregates should be basically unchanged within a certain range of mass concentration when the particle number is large enough. This is the inevitable result of the statistical measurement, and how to express the average mass of the subset of aggregates is the crucial issue.
In practice, aggregates widely exist in the atmosphere. Thanks to the random movement of particles dispersed in the air there are frequent interactions between them, thereby easily forming particle aggregates. By means of scanning electron microscopy (SEM), transmission electron microscopy (TEM), and atomic force microscopy (AFM), many researchers have found that the aggregates have a very complex and irregular structure such as that of a chain, cluster, and flocculent aggregate[17–19]. These complex aggregates are formed by a different number of primary particles, and their shape is random. However, previous studies have also indicated that aggregates in the atmosphere exhibit a statistical fractal feature, and the self-similarity of the aggregate collection can be quantitatively described with fractal dimensions. For example, Wentzel et al. calculated the fractal dimension of soot aggregates with two algorithms based on the SEM images[20]; Virtanen et al. investigated the particle effective density and the fractal dimension of aerosol aggregates[21]; Qiao et al. established a fractal shape model to calculate the fractal dimension of smoke aggregates[22]. As a result, we deduce that the morphology of the equivalent aggregates proposed in this Letter has statistical self-similarity, and the particle aggregate also has a fractal structure. Then the average mass of the subset of aggregates can be expressed by using fractal dimension , where indicates the average density of the tested sample and represents the optical equivalent diameter of the aggregate.
Based on the measuring principle of aerosol mass concentration by the light scattering method, the scattered light of aggregates are converted into voltage pulses, and therefore the optical equivalent diameter of the aggregate is corresponding to its voltage pulse , that is , and then . The parameter is the volume fractal dimension, which is the exhibition of statistical self-similarity of the aggregates’ morphology. Thus, Eq. (2) can also be written as where is the conversion coefficient between the optical equivalent particle diameter and the voltage signal.
Consequently, according to the definition of aerosol mass concentration, using the voltage signal amplitude distribution and the average mass, the calculation formula for aerosol mass concentration can be expressed as where is the proportional coefficient, which has the same dimension as mass concentration; indicates the number of channels; represents the relative median voltage in the th channel, and is the voltage signal amplitude distribution of the aggregates.
On the one hand, we can see that Eq. (4) contains the number information and the amplitude information of the voltage signals in each channel, which makes the voltage signal amplitude distribution be fully utilized. On the other hand, the parameter that exhibits the particles’ morphology is contained in Eq. (4). The above two aspects can ensure the correctness of the inversion results. Obviously, if and are obtained by the calibration experiments, Eq. (4) can be used to inverse the aerosol mass concentration by using measured in real time. Consequently, the correct calibration of and is the precondition of getting highly precise results, which will be discussed in detail. In addition, the calibration and experimental validation results will be given in the following section.
In the fractal model of measuring the aerosol mass concentration by the single particle counting technique, the author proposed the intersection point calibration method to acquire model parameters, and it achieved good results[23]. Considering that the form of the inversion formulas of the single particle counting technique is consistent with that of the ensemble-measuring technique, and only the physical meaning of each physical variable is different, the intersection point calibration method can also be used to calibrate and in Eq. (4). In addition, the range of aerosol mass concentration is also an important factor that should be considered in this work. As previously mentioned, the particle group light scattering method is suitable for the measurement of the high-concentration aerosols, and the average mass of the subset of aggregates is almost constant within a certain range of mass concentration. Hence, the wide range of mass concentration needs to be segmented, then the parameters and are calibrated in different ranges to ensure a higher accuracy. In this Letter, we call this the subsection calibration method. The mass concentration range can be divided into several intervals according to the signal number of the aggregates measured by the system. In general, the higher the mass concentration , the more the signal number are in a measurement cycle, and the results of the experiments are plotted in Fig. 3.
Figure 3.Voltage signal amplitude distribution of aggregates with different mass concentrations.
The calibration experiment devices mainly include the aerosol mass concentration measurement system shown in Fig. 1, the sample container, the aerosol monitor 8533 (TSI corporation, USA) and the humidity sensor. The aerosol monitor 8533 is a light scattering laser photometer that measures the light scattered at 90° and it measures the mass concentration ranging from 0.001 to . The flow rate of the 8533 is 3 L/min, and its measurement cycle is selected to be 1 min. It was used as a norm-referenced instrument to display and record the aerosol mass concentration in real time. In the calibration experiments, the cigarette smoke is used as the sample, which is produced by burning a cigarette in the sample container, then the proposed aerosol mass concentration measurement system in Fig. 1 and the monitor 8533 are applied to detect the sample simultaneously and continuously. Our measurement system gives the pulse height distribution of the sample, and the aerosol monitor 8533 displays the mass concentration . In order to obtain accurate calibration parameters, we carried out three calibration experiments at different times and the number of the measurement cycle of each calibration test is about 100. In the experiments, the relative humidity of the environment is controlled and monitored in real time to make sure it is less than 60% and to avoid the adverse environmental effect on the calibration experiment. Finally, the calibration coefficients and are obtained by the intersection point calibration method, and the results are listed in Table 1.
Range of Number Concentration (104/m3)
Range of Mass Concentration (mg/m3)
β
k(mg/m3)
120–110
[2.75,11.09]1
[4.83,14.90]2
[5.27,11.69]3
2.90
5.69×10⁻⁵
110–100
[1.42,2.47]1
[2.23,4.34]2
[2.21,4.93]3
3.11
5.83×10⁻⁵
100–90
[0.92,1.11]1
[1.21,1.75]2
[1.23,2.15]3
3.25
5.84×10⁻⁵
90–80
[0.71,0.76]1
[0.75,1.09]2
[0.75,1.19]3
3.51
6.24×10⁻⁵
Table 1. Calibration Results of the Proposed Measurement System for Aerosol Mass Concentration
It can be seen from Table 1 that the mass concentration of the three calibration experiments is in the range of 0.71 to , and the range is divided into four intervals according to the number of signals. It is found that the calibration coefficients and gradually increase with the decrease of the mass concentration. However, if the concentration range is not divided into several intervals in this wide concentration range, there are no common calibration coefficients for the three samples. Figure 4 demonstrates the relationship between the fractal dimension and the relative error of the aerosol mass concentration in the condition of the whole interval and subsections. It can be found from Fig. 4(a) that the fractal dimensions of the three calibration experiments have no intersection in the case of the whole experimental concentration range. However, under the condition of subsections, the fractal dimensions of the three calibration experiments all have a common intersection in each concentration section, as shown in Figs. 4(b)–4(e), and the detailed intersection data are illustrated in Table 1. The results confirm the necessity of subsection calibration for high concentration aerosols. In the following, the calibration parameters in Table 1 will be used to inverse the aerosol mass concentration to validate the feasibility of the fractal model and the subsection calibration method.
Figure 4.Relationship between the fractal dimension and the relative error of aerosol mass concentration in the condition of the whole interval and subsections.
Using the calibrated measurement system for aerosol mass concentration and the aerosol monitor 8533, we measured the smoke sample two times, and then the voltage signal amplitude distribution and the mass concentration of the aggregates were recorded simultaneously. combining the calibration coefficients and in Table 1 are applied into Eq. (4) to inverse the mass concentration , and is compared with . Figure 5 illustrates the relationship between the mass concentration and the number of measurement cycles. Figures 5(a) and 5(b) are the experimental results of two different time measurements for the same kind of cigarette smoke. They are repeated experiments. It can be seen from the experimental results that with the increase of the measurement cycle, mass concentrations of the cigarette smoke decreased gradually, which is caused by constantly pumping air from the sample container. It can also be concluded from the two plots that is in good agreement with . The average relative errors of all the measuring points are 5.6% and 6.0%, respectively. Therefore, the experimental results indicate that the mass concentration inversed by the voltage signal amplitude distribution of the aggregates has a high precision and can be applied to measure the mass concentration in real time.
Figure 5.Relationship between the mass concentration and the number of measurement cycle.
In order to further illustrate the validity of the method, the above results are compared with the mass concentrations inversed by the integrated optical signal. The formula for calculating the mass concentration through the integrated signal is described as[14]where is the integrated voltage signal in a measurement cycle and is the calibration coefficient.
First, the sum of the voltage pulse signal amplitude is computed for the three calibrating experiments in Table 1, then the integrated voltage signal in a measurement cycle is obtained. Second, and are linearly fitted, while the slope of the fitted line is the calibration coefficient , and then the average calibration coefficient of three experiments is used to inverse the aerosol mass concentration. For the four concentration ranges in Table 1, the average calibration coefficients are , , , and , respectively. Last, these calibration coefficients combining the integrated voltage signal obtained by the two experiments are applied to calculate the mass concentration through Eq. (5); the results are also illustrated in Fig. 5. It is found that and have the same changing tendency, but there is a significant difference between them. The average relative errors of all the measuring points are 11.0% and 18.5%, respectively, which are obviously higher than those calculated by the voltage signal amplitude distribution. The results demonstrate that the aerosol mass concentration inversed by the signal amplitude distribution of the aggregates is more accurate.
Finally, it is worth noting that the scattered light signal of particles is related to their refractive indexes and morphology, as well as the environmental relative humidity[24,25]. Hence, if there are great differences in the above = mentioned properties between the measured and calibrated particles, the calibration parameters and must be corrected by the recalibration or the data fusion to avoid obvious errors.
In conclusion, the idea that particles passing through a laser beam are equivalent to an aggregate is put forward from the viewpoint of refinement information of particles, based on which a fractal model for aerosol mass concentration by employing the voltage signal amplitude distribution of aggregates is presented, and the corresponding subsection calibration method is also provided. The experimental results indicate that the smoke mass concentrations inversed by the fractal model agree well with those measured by the norm-referenced instrument in the range of 0.53 to . The average relative errors of the two testing experiments are 5.6% and 6.0%, respectively. However, the average relative errors of the mass concentrations inversed by the integrated optical signal are 11.0% and 18.5%, respectively. Therefore, the aerosol mass concentration calculated by the signal amplitude distribution of aggregates is more accurate. The study provides a new inversion method for the online monitoring of aerosol mass concentration based on the particle group light scattering, and it makes the measurement method more accurate.
References
[1] Y. Tao, S. Mi, S. Zhou, S. Wang, X. Xie. Environ. Pollut., 185C, 196(2013).
Fang Gu, Yi Liu, Jiahong Zhang, Yunyun Chen, Fengping Cui. Research on the fractal model and calibration of the aerosol mass concentration measurement based on the particle group light scattering[J]. Chinese Optics Letters, 2016, 14(11): 112901