
Yang WANG, Xiongbo JIANG, Dezhi WU. Species Diversity Characteristics of a Natural Pinus taiwanensis Community with Different Diameter Classes and Forest Densities[J]. Journal of Resources and Ecology, 2020, 11(4): 349
- Journal of Resources and Ecology
- Vol. 11, Issue 4, 349 (2020)
Abstract
1 Introduction
Pinus taiwanensis is a species endemic to China. Pinus taiwanensis has deep roots, and it grows well in middle or high mountain climates with high relative humidity, well-drained acid soils and sunny slopes. It can be adapted to barren soil, although this may contribute to growth retardation (
In the Dabieshan Mountains in eastern Hubei and southern Henan at elevations of 700-1600 m, the diameter class structure of most natural secondary forests of Pinus taiwanensis increased due to forest-enclosure for afforestation, and the forest gradually evolved into pure forest with Pinus taiwanensi being the dominant species. Over a long period of time, due to the improper management of natural forests, anthropogenic disturbances and complex natural environmental conditions, the natural secondary forests of Pinus taiwanensis have developed into forests featuring a simple community hierarchy, fewer tree species in tree layers, lower forest biodiversity and weak ecosystem stability. Therefore, it is difficult for Pinus taiwanensis to fulfill its appropriately ecological functions in the community (
Tree size distribution and undergrowth vegetation diversity are basic attributes of forest structure, with both being closely related to forest biomass, carbon storage and total production (
We chose natural secondary forests of Pinus taiwanensis with different forest ages in Sanhekou Township, Macheng City, Hubei Province as our research object. This study of forest densities, diameter classes, undergrowth species diversity, similarities of species diversity of different plots within the community, and causal factors aimed to reveal the correlations between the tree size structure and species diversity in natural Pinus taiwanensis forests of different ages. After developing a full understanding of the structural characteristics at different growing stages of Pinus taiwanensis forests, we recommended implementation of scientific, feasible forest-tending measures to promote the healthy succession of Pinus taiwanensis communities and maintain biodiversity and ecosystem stability (
2 Research area and methods
2.1 The general situation of research area
We selected four 400 m2 (20 m × 20 m) forest sites (plots) at Aimenguan Village in the Shizifeng forest farm (31°22'34"- 31°23'32"N, 115°17'23"-115°21'41"E), Sanhekou Township, Macheng, China. Aimenguan Village is close to Shangcheng County in Henan Province and Jinzhai County in Anhui Province. The area has a subtropical continental humid monsoon climate and is part of the Jianghuai microclimate zone. It is characterized by abundant rainfall with rainy weather in the hot season, with more hours of sunshine and higher accumulated temperatures. Annual solar radiation is 96.9-112.5 kcal m-2, and this is the highest level in the whole of Hubei Province (
2.2 Survey and sampling
The field survey was conducted in July 2016. The basic situation of vegetation in the tree layer, shrub layer and herb layer was investigated. For the trees (DBH≥2.5 cm) in the tree quadrats, the surveyed items included tree species, tree height and DBH. Five 4 m×4 m shrub quadrats were set at the four corners and at the center of the tree quadrats to investigate shrubs (DBH<2.5 cm included). The shrub species, plant numbers, plant heights and average coverage were recorded. A 1 m×1 m herb quadrat was set randomly in each shrub quadrat to record herb species, coverage and abundance. Coverage refers to the ratio of area covered to total area for each species in the quadrat, and abundance refers to the number of species in the quadrat. The basic information for different plots is shown in
| Plot No. | Elevation (m) | Longitude | Latitude | Slope (˚) | Aspect | Canopy density | Forest density (trees ha-1) | Average DBH (cm) | Average height (m) | Average |
|---|---|---|---|---|---|---|---|---|---|---|
| 1 | 792 | 115°17′23″ | 31°22′34″ | 20 | Southeast | 0.85 | 1425 | 22.479±10.114 | 13.913±3.942 | 296.097 |
| 2 | 812 | 115°18′50″ | 31°22′56″ | 15 | North | 0.70 | 1525 | 18.957±5.141 | 11.502±2.206 | 197.714 |
| 3 | 739 | 115°20'21 | 31°23'32 | 22 | Northeast | 0.65 | 1325 | 29.470±8.694 | 11.775±3.468 | 297.193 |
| 4 | 658 | 115°21′41″ | 31°23′25″ | 18 | Southeast | 0.80 | 1200 | 36.779±4.444 | 14.865±1.828 | 664.605 |
Table 1.
General status of sample plots of natural Pinus taiwanensis forests in Macheng
2.3 Diameter class
Based on the growth characteristics of Pinus taiwanensis, the appropriate research methods for this species (
2.4 Analysis of species diversity
Species richness includes the following indicators:
Patrick index: S
Margalef index:
Menhinick index:
where S is the total number of species i in the quadrat, and N is the total number of all species.
Species diversity index includes the following indicators:
Shannon-Weiner index:
Simpson GINI index:
Species evenness index includes the following indicators:
PieLou index:
Alatalo index:
where pi is the proportion of the number of species i to the number of all species.
Species importance value of a tree layer:
Importance value of shrub and herb layers:
where IVt(%), IVs(%) and IVh(%) represent important values of the tree layer, shrub layer and herb layer. RA refers to the ratio of the number of trees of a species to the total number of trees of all species; the RD value shows the ratio of the sectional area of a species at DBH to that of all species; RF refers to the ratio of the number of times a species occurred in recorded plots to the total number of times all species appeared. With respect to shrub and herb species, RC refers to the ratio of the coverage of a single species to the total coverage for all species; RH refers to the ratio of the height of a single species to the total height of all species. The parameter indexes of species importance, richness, diversity and evenness were calculated for each sample plot.
2.5 Similarities of species diversity
The effects of external disturbances on species composition in a community can be measured by an index for the similarities of species diversity. Greater similarities indicate less influence from disturbances to community species composition (
Jaccard coefficient:
Sǿrenson coefficient:
Ochiai coefficient:
where Cj, Cs and Co are the similarity coefficients; t represents the number of species in common that two communities (or sample plots) being compared have; A and B represent the total number of species in the two communities or sample plots. 0.00<C≤0.25 means great difference; 0.25< C≤0.50 indicates moderate difference; 0.50<C≤0.75 indicates moderate similarity; 0.75<C≤1.00 shows great similarity of compared plots (
3 Results and analysis
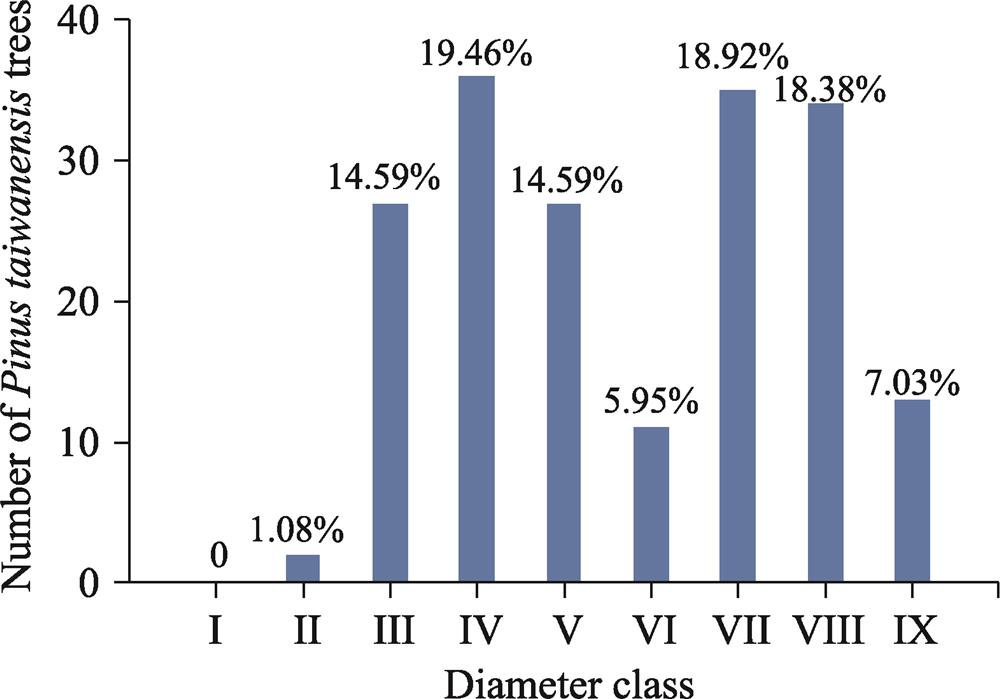
3.1 Diameter class structure
The diameter class structure of Pinus taiwanensis trees in the sample plots is shown in
where y is diameter, x is the number of Pinus taiwanensis trees in different diameter classes.
![]()
Figure 1.Fig. 1
3.2 Species composition under different forest densities
A total of 156 species of vascular plants belonging to 130 genera of 71 families were recorded in the four sample plots. The dominant families in the Pinus taiwanensis community were Compositae (11 genera and 15 species), Rosaceae (12 genera and14 species), Leguminosae (8 genera and 9 species), Euphorbiaceae (5 genera and 7 species) and Gramineae (5 genera and 5 species). Some less dominant families in the community included Rubiaceae (3 genera and 3 species), Caryophyllaceae (3 genera and 3 species), Anacardiaceae (3 genera and 3 species) and Vitaceae ((3 genera and 3 species). Both of the Rhamnaceae family and the Fagaceae family had 2 genera and 4 species; while 4 families, Asparagaceae, Ulmaceae, Apocynaceae and Cyperaceae, each had 2 genera and 3 species. Nine families each had 2 genera and 2 species and these are listed as follows: Liliaceae, Solanaceae, Scrophulariaceae, Iridaceae, Polygonaceae, Zingiberaceae, Betulaceae, Simaroubaceaeand and Celastraceae. The Violaceae family, the Dioscoreaceae family and the Primulaceae family each had 1 genera and 3 species; and 3 families, Aceraceae, Lauraceae and Cornaceae, each had 1 genera and 2 species. The remaining 41 species were members of 41 families and 41 genera.
3.3 Effects of forest density on species diversity
Under different forest densities of Pinus taiwanensis trees in the sample plots, the species diversity indexes of tree layers, shrub layers and herb layers changed significantly (
| Plot No. | Vegetation layer | Richness | Diversity | Evenness | ||||
|---|---|---|---|---|---|---|---|---|
| Patrick ( | Margalef ( | Menhinick ( | Shannon-Weiner ( | Simpson GINI ( | PieLou ( | Alatalo ( | ||
| 1 | Herb | 14 | 2.3267 | 0.8568 | 1.7314 | 0.7618 | 0.6561 | 0.6879 |
| Shrub | 16 | 2.9666 | 1.2769 | 2.1661 | 0.8266 | 0.7812 | 0.6170 | |
| Tree | 14 | 2.9839 | 1.5852 | 1.6215 | 0.6203 | 0.6144 | 0.4023 | |
| 2 | Herb | 34 | 5.7461 | 1.9249 | 2.3669 | 0.8237 | 0.6712 | 0.4836 |
| Shrub | 27 | 5.4308 | 2.4648 | 2.9612 | 0.9306 | 0.8985 | 0.7314 | |
| Tree | 9 | 1.7410 | 0.9045 | 1.4145 | 0.6369 | 0.6438 | 0.5631 | |
| 3 | Herb | 32 | 5.8132 | 2.2242 | 3.0697 | 0.9853 | 0.9025 | 0.9593 |
| Shrub | 22 | 4.3351 | 1.9522 | 2.5248 | 0.8673 | 0.8168 | 0.5687 | |
| Tree | 9 | 1.9384 | 1.1430 | 1.1886 | 0.5016 | 0.5410 | 0.4408 | |
| 4 | Herb | 24 | 4.4244 | 1.7839 | 2.7411 | 0.9097 | 0.8625 | 0.6944 |
| Shrub | 18 | 3.8577 | 1.9878 | 2.4750 | 0.8876 | 0.8563 | 0.7253 | |
| Tree | 12 | 2.0040 | 0.7714 | 1.6716 | 0.7705 | 0.6727 | 0.7768 | |
Table 2.
Species diversity of natural Pinus taiwanensis communities at different forest densities
![]()
Figure 2.Fig. 2
As average density increased and average diameter decreased, the Dma of the shrub layer first increased, then decreased and finally increased. When the average forest density reached its maximum (1525 trees ha-1), the S reached the maximum value (27 species) and the Dma was 5.4308. The Dmc of the shrub layer decreased with the increase of forest density, but the Dmc increased when forest density reached its maximum, which was similar to the change of the S of shrub layers. The H' of shrub layers had a tendency to change by increasing-decreasing-increasing. The change trend of D in response to changes of forest density was consistent with that of Dmc. The change trend of E was consistent with that of H'. The Ea decreased first and then increased as forest density increased. At the maximum forest density (1525 trees ha-1) when average tree diameter (DBH= 18.957±5.141 cm) was lowest, the richness, diversity and evenness of all shrub layers reached their maximum.
As forest density increased, the richness of the herb layer increased first, then decreased and finally climbed up again. The H' and the D of the herb layers showed a trend of increasing-decreasing-increasing, while both the D and the Dmc showed a trend of increasing-decreasing-increasing in response to the changes of forest density. The E first rose, then decreased and afterwards ascended again, while the Ea showed a trend of increasing-decreasing-descending as the forest density increased. When forest density was 1325 trees ha-1, the richness, diversity and evenness of herb layers in the sample plots all reached their maximums.
3.4 Importance values at different forest densities
The importance values of plants in the four sample plots of Pinus taiwanensis in Macheng are listed below in
The importance value of Pinus taiwanensis was 63.10% in the fourth sample plot, while in other sample plots it was higher than 80.00%, indicating that Pinus taiwanensis was the dominant species in the tree layer and the forest was close to a pure forest. The dominant species varied significantly among the four shrub layers, while the importance values of shade tolerant herb Rhododendron simsii were in the first five components of the shrub layers in three sample plots. The highly adaptable shrub species Lindera erythrocarpa and Lindera glauca were the dominant species in the 2nd and the 3rd plots, while Camellia sinensis was observed to be the dominant species in forest gaps of two plots. The important values of Camellia sinensis changed dramatically, from a low of 4.54% to a high of 21.74%. Lespedeza formosa was the dominant shrub species in the fourth sample plot only. The dominant species in the herb layers showed slight changes from plot to plot. Among the dominant herb species were the shade tolerant species Alpinia japonica, Oplismenus undulatifolius, Goodyera repens and Aster ageratoides, and the highly adaptable species Aristolochia mollissima and Anaphalis sinica.
| Plot No. | Tree species | Shrub species | Herb species | |||
|---|---|---|---|---|---|---|
| 1 | 84.33 | 34.72 | 39.33 | |||
| 2.17 | 21.74 | 18.73 | ||||
| 2.07 | 8.39 | 15.73 | ||||
| 1.72 | 6.63 | 14.61 | ||||
| 1.57 | 5.19 | 3.75 | ||||
| 0.78 | 4.40 | 2.25 | ||||
| 2 | 81.84 | 22.31 | 34.94 | |||
| 5.60 | 10.65 | 19.23 | ||||
| 1.68 | 6.92 | 8.33 | ||||
| 1.16 | 5.90 | 4.81 | ||||
| 0.70 | 5.88 | 4.49 | ||||
| 0.59 | 4.27 | 4.81 | ||||
| 3 | 81.12 | 38.61 | Geum aleppicum | 13.43 | ||
| 6.69 | 12.87 | 14.63 | ||||
| 4.48 | 11.88 | 10.79 | ||||
| 3.57 | 8.91 | 8.87 | ||||
| 2.21 | 6.93 | 6.71 | ||||
| 1.76 | 5.94 | 5.04 | ||||
| 4 | 63.10 | 15.85 | 20.44 | |||
| 15.79 | 15.23 | 12.71 | ||||
| 12.26 | 14.63 | 8.84 | ||||
| 4.20 | 8.54 | 8.29 | ||||
| 2.31 | 4.54 | 5.65 | ||||
| 1.32 | 3.95 | 5.52 |
Table 3.
The importance value of tree, shrub and herb species in the 4 sample plots
3.5 Comparison and analysis of similarities of diversity
To quantify the differences in diversity of the four sample plots, an analysis of the similarities of diversity within the community was carried out. The indexes used to track similarities of diversity between any two plots were: Sǿrenson index Cs>Ochini index Co>Jaccard index Cj. The three diversity similarity indexes showed the same change trends for comparisons of any two sample plots.
The four sample plots were aligned in a roughly straight line, and the distance between each of the plots was roughly the same. The shortest distance between two adjacent plots was 2.167 km, and the longest distance was 2.632 km. The greatest distance was between sample plot one and sample plot four (6.966 km). Therefore, the community similarity coefficients between any two adjacent sample plots were higher. The similarity coefficients are shown in
| Plot No. | 1 | 2 | 3 | ||||||||||||
|---|---|---|---|---|---|---|---|---|---|---|---|---|---|---|---|
| Jaccard ( | Sǿrenson( | Ochiai( | Jaccard ( | Sǿrenson( | Ochiai( | Jaccard ( | Sǿrenson( | Ochiai( | |||||||
| 2 | 0.3412 | 0.5088 | 0.3436 | ||||||||||||
| 3 | 0.2022 | 0.3364 | 0.2540 | 0.3232 | 0.4886 | 0.3284 | |||||||||
| 4 | 0.1951 | 0.3265 | 0.2469 | 0.2680 | 0.4228 | 0.2982 | 0.3295 | 0.4957 | 0.3319 | ||||||
Table 4.
The diversity similarity indexes of 4 plots in the Pinus taiwanensis community
4 Discussion
4.1 Diameter class structure and the forest succession trend
Tree size distribution is the most important and most basic element of forest structure, and the structure of tree size distribution can reflect the succession trend of a forest community (
4.2 Forest density and species composition
The average number of tree species in the Pinus taiwanensis community was small (11), and Pinus taiwanensis had predominant advantages in number and in diameter class structure. It was obvious that the community succession trend of Pinus taiwanensis progressed towards a community composed almost exclusively of Pinus taiwanensis. As the diameter class and canopy density increased in the sample plots, there were changes in the light intensity, humidity, soil nutrients and other conditions in the community, resulting in different understory microenvironments, species and distributions of shrub and herbs quantities (
4.3 Variations in the characteristics of species diversity
In general, diameter class structure affected undergrowth diversity, and light intensity affected species richness of regenerating undergrowth (
As the Pinus taiwanensis forest developed towards a pure forest, the main understory shrub species were the shade-tolerant species Rhododendron simsii, and the highly-adaptable species Lindera erythrocarpa and Camellia sinensis. Both the abundance and diversity of the understory herb species were low, and the number of minor species was small, resulting in lower evenness. The dominant species in the herb layer were the shade-tolerant species Alpinia japonica and the highly-adaptable species Aristolochia mollissima. In terms of vertical structure, the diversity indexes were herb layer > shrub layer > tree layer, indicating that the herb layer required the least environmental resources, despite occupying a larger ecological niche. Once it had colonized the upper layer of the community, Pinus taiwanensis had the greatest potential to capture the light resources in the environment, and required the largest amount of other environmental resources, thus dominating the asymmetric competition in the community environment. Our research results revealed that the community structure of Pinus taiwanensis was the same as those of other light-demanding tree species (
4.4 Similarities of species diversity in the sample plots
Due to spatiotemporal differences and changes of ecological factors in different areas, habitat heterogeneity is formed, and this inevitably leads to differences in species composition and structure within a community (
5 Conclusions
During the restoration of natural secondary forest of Pinus taiwanensis in Macheng City, the species diversity in the unders-tory gradually decreased as the diameter class structure of Pinus taiwanensis increased. A greater distance between two sample plots resulted in lower diversity similarity. The community structure was simple, and the succession trend of the Pinus taiwanensis forest was obviously towards a purer forest. Therefore, appropriate management measures should be taken that give consideration to forest density, or the diameter class of the forest and the characteristics of community structure. First, for large-diameter forests lacking a renewal layer, it is necessary to increase the proportion of small-diameter trees by supplementing the seedlings of Pinus taiwanensis, rationalizing the diameter class structure, and limiting the rate of aging of the present forest. Second, positive human intervention is needed to create “forest gaps.” Doing so may improve the physio-logical conditions for small plants in ways that better the habitat for the ontogeny of the population renewal layer of Pinus taiwanensis and enhance natural regeneration ability (
References
[1] L Chao, T Hong, J Li et al. Analyses on diameter class structure and species diversity of understory of artificial forest of
[2] P Chen Y, C Jiang, M Jian X et al. Spatial distribution characteristics of grassland plant communities in a moderately degraded tiankeng in Zhanyi, Yunnan. Acta Ecologica Sinica, 38, 8008-8021(2018).
[3] M Dong. Studies on the ecological protection and construction planning in Macheng. Master diss., Wuhan: Huazhong Agricultural University(2016).
[4] . Flora Reipublicae Popularis Sinicae., 266(1978).
[5] Y Fang J, P Wang X, H Shen Z et al. Methods and protocols for plant community inventory. Biodiversity Science, 17, 533-548(2009).
[6] F Hu J, S Xu M, B Tian W et al. Community structure for main forests in Mount Putuo, Zhejiang Province. Journal of Zhejiang A&F University, 33, 768-777(2016).
[7] S Lai J, A Coomes D, J Du X et al. A general combined model to describe tree-diameter distributions within subtropical and temperate forest communities. Oikos, 122, 1636-1642(2013).
[8] D Lei X, Z Tan S, L Li D et al. Stand variables affecting understorey plant species diversity in natural forests. Chinese Journal of Ecology, 22, 18-22(2003).
[9] Z Li K. Studies on structure and function of shrub layer of karst forest in Guizhou provincial center mountainous area, China. PhD diss., Guiyang: Guizhou University(2008).
[10] Y Lin J, C Tang F, M He Y et al. Effects of human disturbance on community structure and species diversity of
[11] P Liu L, J Yong, Y Wang et al. Distribution pattern of natural
[12] Z Liu W, L Guo X, Z Zhang S et al. Diameter class and species diversity of
[13] J Jiang, S Xie Y, C Lu Y et al. Community structure at different age stages and optimization management strategies in a. Massoniana pine plantation. Journal of Northwest Forestry University, 30, 1-7(2015).
[14] H Jin, Y Zhao, W Zhao et al. Elevational changes in species diversity and similarity analysis of a. Rhododendron chrysanthum community on Changbai Mountain. Acta Ecologica Sinica, 35, 125-133(2015).
[15] J Niklas K, J Midgley J, H Rand R et al. Tree size frequency distributions, plant density, age and community disturbance. Ecology Letters, 6, 405-411(2003).
[16] W Pan J, Q Guo Q, L Yu D et al. Analysis on diameter class structure of dominant species and species diversity of
[17] A Rivaie A. The effects of understory vegetation on P availability in
[18] R Shen, L Zhang J, B He et al. The structure characteristic and analysis on similarity of grassland community in dry-hot valley of Yuanjiang River. Ecology and Environmental Sciences, 19, 2821-2825(2010).
[19] L Stephenson N, J Van Mantgem P, G Bunn A et al. Causes and implications of the correlation between forest productivity and tree mortality rates. Ecological Monographs, 81, 527-555(2011).
[20] J Su S, F Liu J, R Lan S et al. A review of
[21] S Wang S, X Yu X, Y Luo Y et al. Effects of reforestation on woody plant biodiversity of forest vegetation in Badaling, Beijing. Journal of Beijing Forestry University, 30, 155-159(2008).
[22] Y Wang, X Yan K, X Teng J et al. Analysis on natural population dynamics of endangered species
[23] Y Wang, J Zhu S, J Li et al. Species abundance distribution patterns of a
[24] C Xing, L Jiang, S He Z et al. Height class structure of a
[25] C Yuan J, J Qiu, Y Cai J et al. Analysis of α diversity and the related environmental factors of natural
[26] X Zhang, Y Zhang H, H Lu Z et al. Vegetation restoration effects of rock cutting slopes in the cold region of China. Acta Ecologica Sinica, 37, 1450-1457(2017).
[27] G Zhen D, P Liu L, Y Gao W et al. Research on α diversity of natural
[28] P Zhou S, N Liang K, J Du et al. Research on understory vegetation and soil physical-chemical properties of teak plantation with difference stand densities. Bulletin of Botanical Research, 37, 200-210(2017).


Set citation alerts for the article
Please enter your email address

© Copyright 2018-2021 | Chinese Laser Press. All Rights Reserved 沪ICP备15018463号-20