Optical chirp chain Brillouin optical time-domain analysis (OCC-BOTDA) has the capabilities of fast measurement, high Brillouin threshold, and freedom from the nonlocal effect; at the same time, however, it also has problems introduced by transient stimulated Brillouin scattering. The influence of the transient interaction is reflected as the broadened asymmetric Brillouin spectrum, the ghost peak, and the frequency shift of the main peak. This introduces difficulty in computing the fiber Brillouin frequency shift with good measurement accuracy. Besides, the OCC modulation causes additional noise due to the uneven amplitude response for different frequency components. In this work, we propose a high-performance OCC-BOTDA using the principal component analysis (PCA) based pattern recognition algorithm and differential pulse-width pair (DPP) technique. After building the Brillouin spectrum database (i.e., all patterns), the fiber intrinsic Brillouin frequency shift can be recognized by the PCA algorithm from a nonstandard Brillouin spectrum profile, resulting in good measurement accuracy. Meanwhile, the DPP technique, subtracting between two Brillouin signals generated by two wide-width pump pulses, is utilized to reduce the OCC modulation noise and avoid the pulse self-phase modulation effect in long-range BOTDA sensing. In the experiment, a temperature measurement with 1.3?MHz measurement precision, 4?m spatial resolution, and 5?s measurement time is achieved over a 100?km single-mode fiber.
1. INTRODUCTION
In the last two decades, Brillouin-based distributed optical fiber sensors have been widely studied, due to their numerous features such as high spatial resolution [1,2], dynamic measurement [3–10], and long-range sensing [11–16]. Brillouin optical time-domain analysis (BOTDA) is one of the typical Brillouin-based sensors generally operating on the principle that the pump pulse interacts with the counterpropagating probe waves through stimulated Brillouin scattering (SBS), while their frequency offset is scanned in the vicinity of the fiber Brillouin frequency shift (BFS) to reconstruct the Brillouin spectrum profile [17]. Then, the accurate BFS is calculated from the curve fitting of the measured Brillouin spectrum profile. Due to the linear relationship between the BFS and temperature (or strain), BOTDA sensors have already been widely used for distributed environment information measurement in oil pipelines, large civil infrastructures, and cables [18].
Rapid progress of long-range BOTDA measurement has been reported in the last decade. The distributed Raman amplification is utilized to optimize BOTDA for achieving high spatial resolution over a 120 km sensing range [11]. Optical pulse coding and optical pre-amplification are also regarded as effective methods for long-range Brillouin fiber sensing by increasing the signal-to-noise ratio (SNR) [12]. Soto et al. proposed an image denoising process in 2016 to enhance the long-range performance, in which the SNR can be remarkably improved 100-fold without hardware modification [13]. Meanwhile, the systematic errors induced by the nonlocal effect have been investigated and then effectively mitigated to increase measurement accuracy. In the frequency scanning process, the power transfer between the pump and probe is high near the sensing fiber BFS, while it is low away from the sensing fiber BFS. This introduces a power fluctuation and profile distortion of the pump pulse that induces the nonlocal effect, especially in the far end of the sensing fiber. The saw-tooth frequency modulation is able to provide the pulse spectrum with a flat gain and then overcome the nonlocal effect by two specific implementations: the additional distributed Brillouin amplification scheme [14] and the pump-amplification-based Brillouin loss configuration [15]. Besides, a novel frequency scanning method is investigated to achieve distortion-free BOTDA measurement [16]. It can be seen that the long-range BOTDA sensors have achieved substantial development, especially in the aspect of the SNR and the measurement accuracy.
Recently, we have proposed a novel BOTDA based on an optical chirp chain (OCC) probe wave generated by the frequency-agile technique [19,20]. The OCC modulation is the key technique to realize distributed fast [19] and long-range [20] BOTDA sensing, which is enabled by cascading the fast-frequency-changing microwave short-chirp segment head to tail. In each segment, the frequency is scanned over several hundred megahertz within tens of nanoseconds. The distributed Brillouin spectrum profiles are demonstrated in the time domain, as the chirp span covers the BFS of the sensing fiber. Therefore, the measurement time is only restricted by the length of the sensing fiber and the averaging times. In the long-range scheme, it is also able to increase the SNR by high Brillouin threshold and Brillouin amplification of the pump pulse. The measurement accuracy is improved by not only the high SNR but also by eliminating the nonlocal effect. However, it also makes it difficult to compute the fiber Brillouin frequency shift with good measurement accuracy, due to the transient SBS interaction and OCC modulation noise. The influence of the transient interaction is reflected as the broadened asymmetric Brillouin spectrum, the ghost peak, and the frequency shift of the main peak. The above detrimental influences can be explained by the delay of the acoustic wave excitation. Besides, the OCC modulation introduces additional noise to the probe wave, due to the uneven amplitude response for different frequency components.
Sign up for Photonics Research TOC. Get the latest issue of Photonics Research delivered right to you!Sign up now
In this paper, a high-performance OCC-BOTDA scheme is proposed by combining the principal component analysis (PCA) based pattern recognition algorithm and differential pulse-width pair (DPP) technique. First, the Brillouin loss spectrum (BLS) is simulated based on the SBS coupled three-wave equation. Then, a reference database is built with different BFSs, and the feature vector of each BFS is obtained through the PCA algorithm. The fiber intrinsic BFS is obtained by matching the feature vector of the measured spectrum in the reference database resulting in a good measurement accuracy. Meanwhile, the DPP technique, subtracting between two Brillouin signals generated by two wide-width pump pulses, is utilized to reduce the OCC modulation noise and avoid the pulse self-phase modulation effect in long-range BOTDA sensing. To test the performance of the proposed OCC-BOTDA scheme, a temperature measurement is implemented over a 100 km single-mode sensing fiber.
2. PRINCIPLE
A. Numerical Simulation
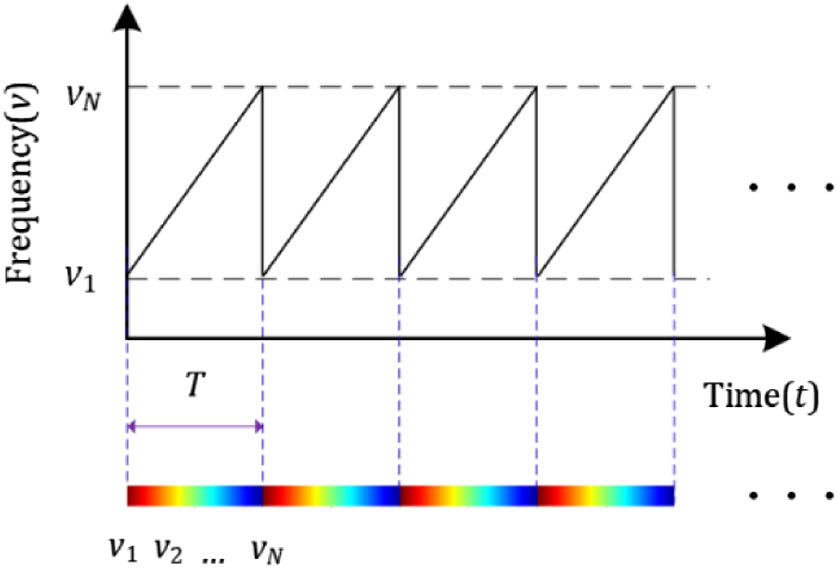
The Brillouin loss spectra obtained from the OCC-BOTDA scheme cannot be expressed by any known standard waveform, which can only be constructed through numerical analysis based on the coupled three-wave equations [21]. The accurate and general solutions of the SBS coupled equations are obtained using numerical methods with an implicit finite differencing in time and down-winding or backward differencing in space [22]. The boundary conditions are known for the pump pulse and probe wave. The input pump pulse at the beginning is a traditional optical pulse, while the probe wave at the remote end is OCC modulated. The injected OCC modulated probe wave () is expressed by where is the power of the probe wave, is the effective core area, is the initial phase of the optical wave, and is the optical frequency. In one chirp period (), the probe optical frequency is linearly scanned from to , which is given by The OCC modulation is operating in the saw-tooth mode, where two adjacent optical short-chirp segments are cascaded by the head-to-tail cohesion. The time-frequency relationship of the OCC probe wave is shown in Fig. 1. Besides, the initial acoustic field is assumed to be zero. The simulation parameters are set at the same value as the experiment parameters, which are 70 ns/40 ns pump pulses, 40 ns chirp chain period, and 295 MHz OCC frequency span.
Figure 1.Time-frequency relationship of the OCC probe wave.
As shown in Fig. 2(a), the simulated BLSs are obtained from the 70 ns pulse (purple short dash–dot) and 40 ns pulse (pink dashed line), while the differential BLS (black line) is computed from the subtraction of the two pulse-width BLSs. The simulated differential BLS (black line) is in good agreement with the measured one (red dots), as exhibited in Fig. 2(b). The intrinsic BLS (blue dashed line) is also drawn in Fig. 2(b), and the center BFS is 10.845 GHz. There is a 40 MHz frequency shift of the OCC-based BLS compared with the intrinsic BLS. This can be explained by the delay of the acoustic wave excitation, which makes it difficult to compute the fiber intrinsic BFS. Moreover, both the simulated and measured BLSs are broadened to more than 110 MHz and have an asymmetric profile, which introduces a big fitting error using the quadratic least-square (QLS) fitting method [23]. Here, the PCA algorithm is utilized to extract the fiber intrinsic BFS from the measured nonstandard Brillouin spectrum profile, which has been reported as a pattern-recognition-based fitting method, providing better measurement accuracy, faster processing speed, and larger noise tolerance [24].
Figure 2.(a) BLSs obtained from a 70 ns pulse (purple short dash–dot) and a 40 ns pulse (pink dashed line), resulting in the differential BLS (black line). (b) Simulated differential BLS (black line), measured differential BLS (red dots), and intrinsic BLS (blue dashed line) based on the DPP technique.
The operation principle of the pattern recognition based on the PCA algorithm is illustrated in Fig. 3. A reference database of the simulated BLSs should be first built up with different BFS intrinsic BLSs. Then, the feature vector of each BLS in the reference database is obtained through the PCA algorithm, and that of the measured data can also be calculated in the same way. Finally, a matching process is adopted to compute the intrinsic BFS of each measured BLS, which is the widely used Euclidean distance function. The PCA algorithm has already been used in BOTDA applications such as the extraction of temperature distributions [24] and the preprocessing for artificial neural networks to discriminate the temperature and strain [25]. Besides, the detailed process to calculate the feature vector is introduced in the above papers and can be summarized as follows.
The reference database is expressed as an matrix, where and are the number of sweeping frequencies in one BLS and the number of BLSs in the reference database, respectively.
The relevant zero-mean matrix of the reference database is obtained by subtracting the mean of each row in .
The covariance matrix of the reference database is defined as .
The eigenvectors and eigenvalues of the covariance matrix are calculated and ranked in descending order. The (much less than ) most significant eigenvalues are selected, and the corresponding orthogonal eigenvectors are obtained in the meantime.
The feature matrix ) is used to approximately represent the simulated zero-mean database () through the new base matrix (). Now the feature vector of each intrinsic BLS is contained in the feature matrix.
The feature vector of the measured BLS can also be obtained through the new base matrix.
Figure 3.Operation principle of how to employ the PCA algorithm to compute the fiber intrinsic BFS from the measured Brillouin signal in the OCC-BOTDA scheme.
In order to experimentally demonstrate the proposed fast long-range OCC-BOTDA and its performance on temperature measurement, the scheme in Fig. 4 was implemented. A distributed feedback laser was used as the light source, operating at a wavelength of 1550 nm. The output light was divided into two arms by an optical coupler. The upper arm with 90% power was used to generate the pump wave with a fixed frequency downshift of 8.335 GHz. First, an electro-optic modulator (EOM1) was utilized to produce the 8.335 GHz double sidebands. Then, EOM2 followed to generate an optical pulse pair with the widths of 70 and 40 ns. The lower sideband of the optical pulse was selected by the tunable fiber Bragg grating (TFBG), and its peak power was amplified to 100 mW by the erbium-doped fiber amplifier (EDFA1). The pump pulse pair was injected into the 100 km sensing fiber through a circulator.
Figure 4.Experiment setup scheme of fast long-range BOTDA based on the OCC technique and Brillouin loss scheme. MG, microwave generator.
In the lower arm, the 10% light was OCC modulated by the microwave chirp signal with the frequency ranging from 2.4 to 2.695 GHz, which was provided by a 12 GHz bandwidth arbitrary waveform generator (AWG). The EOM3 was biased at the minimum transmission point and driven by the microwave chirp segments resulting in the OCC signal with double sidebands, and then the upper sideband was selected by a narrowband fiber Bragg grating (FBG). The duration of one OCC segment was set at 40 ns, corresponding to a 4 m spatial resolution. As we discussed before, the spatial resolution was determined by the OCC segment duration, which was longer than the convolution time of the equivalent pump pulse width (30 ns) and the Brillouin intrinsic spectrum occupied time (4 ns) [20]. To eliminate the polarization fading, the polarization state of the OCC probe wave was randomized by the polarization scrambler (PS). Then, a power of 10 dBm probe was launched into the fiber under test (FUT) from the other end.
Finally, the pump pulse pair and the OCC probe wave were counterpropagated and interacted in the FUT, which contained four spools, and each one was a 25 km single-mode fiber. To test the sensor performance, 4 m of fiber at position B was heated in the oven. The probe signals were received by a high gain photodetector (PD) and collected by data acquisition (DAQ) with a sampling rate of 5 GSa/s. The probe signals were averaged 2000 times for each pump pulse-width pair (70 and 40 ns) to improve the SNR. The measurement time was 5 s, while the repetition rate of the pulse was 800 Hz.
4. RESULTS AND DISCUSSION
The Brillouin time traces of the pump pulse pair are shown in Fig. 5(a), where the black trace is obtained for the 70 ns pump pulse, and the red one is obtained for the 40 ns pump pulse, resulting in a differential Brillouin signal by the DPP technique, as shown in Fig. 5(b). The length of the FUT (i.e., Brillouin interaction region) can be clearly identified between the position from 0 to 100 km. Besides, the intensity is reduced in the first 60 km, while it is increased in the last 20 km thanks to the distributed amplification in the Brillouin loss scheme. Compared with the trace in Fig. 5(a), the background noise in Fig. 5(b) is decreased from to 1 mV. The background noise is composed by two components: one is the white noise induced by the PD, which has already been partially reduced by the averaging process; the other is the OCC modulation noise due to the uneven amplitude response for different frequency components. Although a feedback closed-loop system is utilized to adjust the amplitude of the different frequency components, it is impossible to realize an absolute flat power distribution for the OCC probe wave. Using the DPP technique, the OCC modulation noise with the same pattern can be effectively suppressed, as the level of the background noise in our experiment is reduced by nearly 4.8 dB.
Figure 5.(a) Brillouin time traces of the 70 ns (black curve) and 40 ns (red curve) pump pulses. (b) Brillouin time trace of the differential signal (blue curve). (c) BLSs obtained from (a) and (b). (d) The 40 and 70 ns pump pulses at the input end and the output end of the FUT.
With the data in Fig. 5(a), the 70 and 40 ns BLSs can be obtained within each optical chirp segment. The corresponding differential BLS is calculated by subtracting between the two wide-width BLSs, as shown in Fig. 5(c). In addition, the ghost peak can also be found in Fig. 5(c), as observed in our previous work due to the transient SBS interaction [20]. The waveforms of the pump pulse-width pair (40/70 ns) at both the input end (black and red short dashed lines) and the output end (blue and magenta lines) of the FUT are plotted in Fig. 5(d). In the Brillouin loss scheme, the power of the OCC probe wave is transferred to the pump pulse, which can compensate the transmission loss of the pump pulse. Considering the fiber loss of 0.19 dB/km at 1550 nm, a 19 dB increment for the pump pulse is generated by the OCC probe wave in the 100 km FUT because the powers of the input and output pump pulses remain almost the same in Fig. 5(d). The smoothed leading edge of the pump pulse is caused by the self-phase modulation effect, as described in Ref. [15]. Meanwhile, the BFS measurement error induced by the smooth leading edge can also be avoided by subtracting between the two Brillouin signals generated by the pulse pair. The width of the output pump pulse is slightly compressed, but it has no influence on the spatial resolution in OCC-BOTDA, which is determined by the duration of the OCC segments.
The BLSs at three typical positions (1, 60, and 100 km) are plotted in Fig. 6, while the fiber at the 100 km position is placed in the oven. The QLS algorithm is used to extract the peak frequency information, while the PCA algorithm is able to compute the fiber intrinsic BFS. The reference database has already been built, where the frequency span is from 10.8 to 10.95 GHz with a frequency step of 0.1 MHz providing a large fitting range and good frequency resolution. The PCA fitting result at the position of 1 km is shown in Fig. 6(a), while the QLS fitting result with the same spectrum is shown in Fig. 6(b). The fiber intrinsic BFS obtained from the PCA algorithm is 10.8537 GHz, and the QLS fitting result is 10.8809 GHz with 120 MHz spectrum around the main peak. The peak frequency (10.8940 GHz) can be computed with only a 60 MHz frequency span around the main peak, while it only utilizes about 20% of the information of the measured spectrum, and then the fitting result is sensitive to noise. With more fitting data, the PCA algorithm has a larger noise tolerance than the QLS algorithm, especially in Figs. 6(c) and 6(d). The PCA and QLS fitting results are 10.8480 and 10.8742 GHz at the position of 60 km, respectively. The fiber at position B is heated in the oven, and the linewidth of the BLS is observed to be narrower than at other positions, as shown in Figs. 6(e) and 6(f). It can be explained that the phonon absorption is related to the temperature [26]. The linewidth decreases with temperature possibly represent the upper tail of the absorption peak. Besides, the power and the width of the pump pulse have an influence on the width of the Brillouin spectrum. Thus, we build more OCC BLS reference databases with different linewidths from 17 to 35 MHz with the frequency step of 1 MHz. The fitting results at position B are 10.8812 and 10.9107 GHz with the PCA and QLS algorithms. As a result, the PCA algorithm is a better fitting method than the QLS fitting method for the OCC Brillouin spectrum because it can provide the fiber intrinsic BFS from a nonstandard Brillouin spectrum profile with good precision and large noise tolerance.
Figure 6.Measured BLS and the fitting result based on the PCA and QLS fitting methods: (a) PCA fitting result and (b) QLS fitting result at 1 km, (c) PCA fitting result and (d) QLS fitting result at 60 km, (e) PCA fitting result and (f) QLS fitting result at 100 km in the oven.
The BFSs along the 100 km sensing fiber are demonstrated based on the QLS (black line) and PCA (red line) algorithms, as shown in Fig. 7. The fitting frequency spans of the QLS algorithm and PCA-based pattern recognition algorithm are 60 and 295 MHz, respectively. In order to demonstrate the performance of the two algorithms, the BFS standard deviation (SD) is computed along each 25 km fiber spool, which shows the dispersion degree of the BFS calculation. The BFS SDs based on the QLS algorithm are 3.1, 3.7, 3.2, and 2.6 MHz for each 25 km fiber spool, while the BFS SDs based on PCA algorithms are 1.9, 1.9, 1.3, and 1.7 MHz for the same fiber spool. The results prove well that the noise tolerance of the PCA algorithm is better than that of the QLS algorithm. The BFS SD is in connection with not only the SNR but also the fiber uniformity. Although the SNR is lowest in the third fiber spool, the BFS SD is minimum due to the uniformity of the coiling strain. As a result, we can draw a conclusion that the BFS measurement uncertainty is less than 1.3 MHz along the whole sensing fiber based on the PCA algorithm. Moreover, it can be seen that the BFS fitting difference between the QLS and PCA algorithms is higher than 41 MHz in the first 50 km, while it is around 37 MHz in the last 25 km. The result proves again that the QLS fitting results introduce an additional error relative to the Brillouin spectrum profile, which is avoided in the PCA algorithm by the same spectrum pattern between the simulation and measurement.
Figure 7.100 km sensing fiber BFS results of two algorithms: black curve is the QLS fitting result; red curve is the PCA fitting result.
The evolution of 3D BLS along the 100 km sensing fiber can be obtained from Fig. 5(b), and the top view of the last 268 m is displayed in the insert in Fig. 8. It is easy to find the heated fiber at position B, as the peak of the BLS is moving upward. The temperature demodulation result of the last 268 m of fiber is shown in Fig. 8 based on the PCA algorithm. Using the BFS (10.8447 GHz) at room temperature (25.5°C) at position A as a reference value, the temperature distribution and the corresponding BFS difference are calculated with a temperature coefficient of 1.06 MHz/°C. The BFS of position B is 10.8812 GHz, and the demodulated temperature is 60°C, which agrees well with the actual temperature of the oven. Besides, the last 50 m of fiber is in a loose condition without coiling strain, so the temperature distribution is smaller than that of the rest.
Figure 8.Temperature measurement in the last 268 m of the sensing fiber and the top view of the sensing fiber 3D Brillouin loss spectra (inset).
In this work, a high-performance distributed fast long-range OCC-BOTDA has been experimentally demonstrated by combining the PCA-based pattern recognition algorithm and the DPP technique. After building a reference database of the asymmetrical BLSs via numerical calculation, the fiber intrinsic BFS can be demodulated based on the PCA algorithm, which can provide more accurate fitting results than the QLS algorithm. The DPP technique is verified as an important tool for reducing the OCC-modulation noise and avoiding the self-phase modulation effect. However, it takes twice the measurement time for the DPP technique, compared with the single-pulse measurement. In the experiment, a temperature measurement along a 100 km sensing fiber has been obtained with the spatial resolution of 4 m and the averaging times of 2000, resulting in a 1.3 MHz (1.22°C) measurement precision and 5 s measurement time. The optimized OCC-BOTDA would provide a superior solution to good precision, wide dynamic range, long sensing distance, and distributed and fast measurement for applications ranging from the health monitoring of railways to border security.
Acknowledgment
Acknowledgment. The authors would like to express our gratitude to Dr. Sanogo Diakaridia, who gave us valuable suggestions for this work.