Abstract
The effects of human activities on climate change are a significant area of research in the field of global environmental change. Land use and land cover change (LUCC) has a greater effect on climate than greenhouse gases, and the effect of farmland expansion on regional drought is particularly important. From the 1910s to the 2010s, cultivated land in Songnen Plain increased by 2.67 times, the area of cultivated land increased from 4.92×10 4km 2 to 13.14×10 4km 2, and its percentage of all land increased from 25% to 70%. This provides an opportunity to study the effects of the conversion of natural grassland to farmland on climate. In this study, the drought indices in Songnen Plain were evaluated from the 1910s to the 2010s, and the effect of farmland expansion on drought was investigated using statistical methods and the Weather Research and Forecasting Model based on UK’s Climatic Research Unit data. The resulting dryness index, Palmer drought severity index, and standardized precipitation index values indicated a significant drying trend in the study area from 1981 to 2010. This trend can be attributed to increases in maximum temperature and diurnal temperature range, which increased the degree of drought. Based on statistical analysis and simulation, the maximum temperature, diurnal temperature range, and sensible heat flux increased during the growing season in Songnen Plain over the past 100 years, while the minimum temperature and latent heat flux decreased. The findings indicate that farmland expansion caused a drying trend in Songnen Plain during the study period.1 Introduction
As stated in the Fifth Assessment Report of the Intergovernmental Panel on Climate Change (IPCC, 2013), the average global temperature has increased by 0.85℃ over the past 130 years. Therefore, global warming has become a serious environmental problem that should be collectively addressed by humans. Climate change and global warming affect the environment, agriculture, human life, and many other things (Zhao et al., 2016; Lizana et al., 2017; Emerson et al., 2018; Füssel and Klein, 2006). Human activities contribute to climate change through the emission of greenhouse gases along with land use and land cover change (LUCC) (Pielke et al., 2011; Mahmood et al., 2014). In some cases, LUCC may contribute to climate change to a greater extent than greenhouse gas emissions (Feddema et al., 2005; Piao et al., 2007). The conversion of natural vegetation to farmland, which is one type of LUCC caused by human activities, is one of the major factors contributing to global climate change (Foley et al., 2005; Mahmood et al., 2010). Song et al. (2018) estimated 60% of all changes were associated with direct human land-use activities. In recent decades, researchers have used statistical methods and numerical models to analyze the climatic effects of farmland expansion. However, most of these studies focused on the effects of arable land expansion on temperature and precipitation (Betts et al., 2007; Li et al., 2007; Sampaio et al., 2007; Bonan, 2008; Zhang et al., 2010; Lee et al., 2011; Ge et al., 2013; Peng et al., 2014; Cao et al., 2015; Zhang et al., 2015; Zhang et al., 2017; Zhang et al., 2018), whereas the effect of farmland expansion on drought has received relatively little attention. For example, the large-scale expansion of farmland in the western part of the USA, where the area of arable land increased by 1.53 times from 1836 to 1985, resulted in desertification, ecological imbalance, and unbalanced agricultural development (Chen and Sun, 2001; Yan, 2001). In the 1950s, large-scale land reclamation led to regional ecological imbalances in the Soviet Union (Chen and Sun, 2001). In China, there are many examples of large-scale agricultural expansions in ancient times. LUCC has been shown to cause water shortages, droughts (Zhang, 2005), and the decline of society and civilization (Meng, 2002). Thus, in addition to meeting the needs for human survival, intensive LUCC has also aggravated droughts, which in turn has limited the ability to meet human needs. The feedback mechanism between LUCC and climate change is a key scientific problem (Liu, 2016). However, the effects of farmland expansion on drought remain poorly understood.
A historic, large-scale immigration event called “Chuang Guandong” (meaning go and settle down in Northeast China) occurred in the late Qing Dynasty in China. During this event, land reclamation occurred in northeast China, resulting in considerable LUCC. This LUCC was particularly significant in Songnen Plain, where the area of cultivated land increased almost exponentially. Thus, the effect of human activities on LUCC in Songnen Plain has great significance to coupled human-environment systems (Zhang et al., 2017). This study analyzed the effects of farmland expansion on drought in Songnen Plain during the last century based on LUCC and changes in various types of meteorological data.
2 Study area
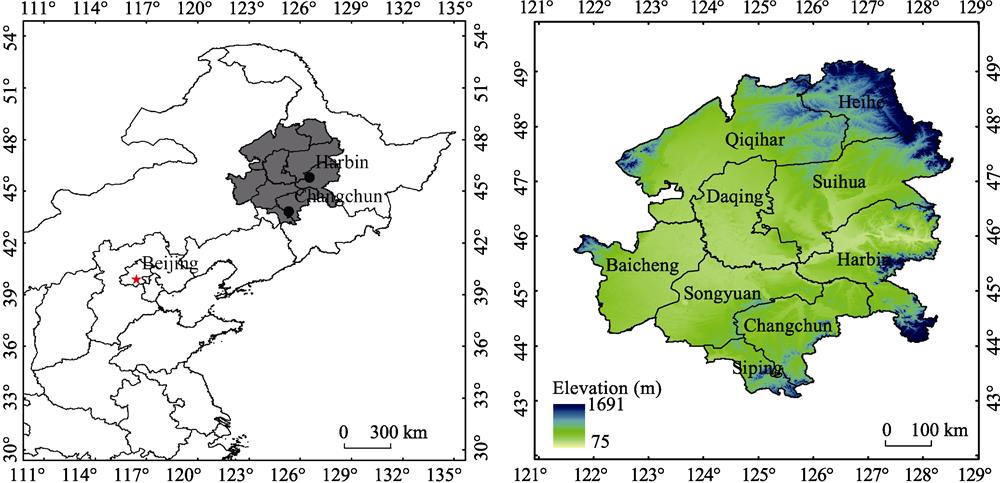
Songnen Plain is located in the central and western parts of Northeast China (Figure 1). Songnen Plain lies between 42°30'N-51°20'N and 121°40'E-128°30'E and covers an area of approximately 23.75×10⁴ km2 (Jiang et al., 2015). Songnen Plain is an alluvial plain that was formed by the Songhua and Nenjiang rivers. The terrain in Songnen Plain is relatively flat, and the elevation is 120-300 m above sea level. Along with Sanjiang Plain and Liaohe Plain, Songnen Plain is one of the three major plains in Northeast China.

Figure 1.Figure 1
The diamond-shaped Songnen Plain is bounded to the south by the Songliao watershed, which separates the Songnen Plain from the Liaohe Plain. The northern boundary of Songnen Plain is connected to the Lesser Khingan Mountains, the western boundary is the eastern part of the Greater Khingan Mountains, and the eastern boundary is the eastern part of Changbai Mountains. The geologic structure of Songnen Plain is a sag area that is part of the Songliao fault zone; as a result, Songnen Plain is known as the wavy plain. The middle of Songnen Plain has a large number of wetlands and lakes. The soil in Songnen Plain is very fertile, with black soil and chernozem accounting for more than 60% of the soil. Songnen Plain is a major grain-producing area, with major crops including soybeans, wheat, corn, sugar beets, flax, and potato. Animal husbandry is also developed in Songnen Plain due to the high concentration of grasslands. The climate of Songnen Plain, which contains semi-humid and semi-arid zones, is temperate and monsoonal with four distinct seasons. The annual average temperature increases gradually from north to south, presenting a zonal distribution. In winter, the climate is cold and dry. The coldest month is January, when the average temperature is between -16℃ and -26℃, and total precipitation is generally 10-24 mm in January. The temperature rises quickly in spring, which is characterized by frequent southwest winds and relatively little precipitation. In summer, Songnen Plain is affected by southeast winds along with heavy rainfall and even rainstorms, with total precipitation of approximately 270-417 mm. In autumn, the intensity of solar radiation along with the sunshine time decrease, the temperature decreases sharply, and precipitation is slightly higher than in the spring (Zhang et al., 2017).
3 Data
3.1 Land use data
The time series data of land use and land cover in Songnen Plain used in this study (1910s, 1930s, 1950s, 1970s, 1980s, 1990s, 2000s, and 2010s) are detailed by Zhang et al. (2015 and 2017). The land cover data for Songnen Plain in the 1910s and 1930s were derived from forest distribution, population, and settlement distribution data obtained from historical documents combined with the distribution of rivers and the cultivation index. The spatial resolution of cultivated land in this study was 1 km × 1 km, which is based on Zhang et al. (2015). Other land use types in the 1910s and 1930s were reconstructed in accordance with land use data for the 1950s. Land cover data for the 1950s were obtained according to the vector map of historical documents based on Landsat multispectral scanner imagery (1975). After false color synthesis, the vegetation surface information was highlighted, and vectorization was completed with a resolution of 80 m. Land cover data for the 1980s, 1990s, 2000s, and 2010s were based on TM remote sensing images and were completed by vectorization. Land uses were divided into seven types: urban construction land, farmland, wetland, grassland, woodland, unused land, and other land. From the 1910s to the 2010s, the cultivated area in Songnen Plain increased by 2.67 times, and the cultivation rate increased from 22.78% to 60.85%. Meanwhile, 38.07% of natural surfaces were converted into cultivated land, indicating that the increase in cultivated area was attributed to the conversion of natural surfaces. The proportion of arable land increased from 1/4 to 2/3 (Table 1 and Figure 2). The land surface properties underwent tremendous changes over the past 100 years. These changes were characterized by the expansion of cultivated land from the southeast to the central-western parts of the plain. As a result, Songnen Plain became one of China’s most important areas for the production of grain commodities. The most concentrated areas of cultivated land shifted from the southeastern part of Songnen Plain (125.7°E, 45.82°N) in the 1910s to the northwestern part (125.4°E, 46.14°N) in the 2010s (Figure 3). The center of gravity of the cultivated land is the average value of the latitude and longitude of the center of all cultivated land. The process of arable land reconstruction and the calculation of the center of gravity are described in the reference Zhang et al. (2017).
| 1910s | 1930s | 1950s | 1970s | 1980s | 1990s | 2000s | 2010s |
|---|
| Farmland area fraction (%) | 22.78 | 35.20 | 49.19 | 55.52 | 54.48 | 58.03 | 58.60 | 60.85 |
| Farmland area (104 km2) | 4.92 | 7.60 | 10.62 | 11.99 | 11.76 | 12.53 | 12.652 | 13.138 |
Table 1.
Farmland area and fraction of farmland area in Songnen Plain from the 1910s to the 2010s
Figure 2.Figure 2
Figure 3.Figure 3
3.2 Meteorological data
CRU data: The Climatic Research Unit (CRU) at the University of East Anglia reconstructed a complete, high-resolution, non-disruptive monthly mean surface climate factor dataset (CRU TS 3.1) by integrating several well-known databases (spatial resolution is 0.5°×0.5°) starting in 1901. CRU data have many advantages compared to existing climate data in China. First, relatively few observational data are available for the early 20th century. According to the conclusion of relevant literature research, the annual mean temperature time series which is reconstructed from CRU data are in good agreement with the observations in China, with the correlation coefficient of 0.84. At the regional scale, the variable rates of temperature of the CRU data are also in good agreement with the observations in 10 typical zones, and the overall correlation coefficient remains at about 0.8. The annual total precipitation revealed by CRU data from 1951 to 2000 coincides with the observations which come from 160 meteorological stations in China, with the correlation coefficient of 0.93. The seasonal precipitation data reconstructed by CRU are in good agreement with the actual precipitation data in eastern China, and the best consistency in autumn with the correlation coefficient of 0.93. Above all, the CRU data can always represent the main characteristics of the interdecadal variations of temperature and precipitation in China. So it is reliable to study the large-scale climate over the past 100 years. (Wen et al., 2006).
NNR data: The NNR data is the NCEP/DOE global atmospheric reanalysis data jointly proposed by the National Center for Environmental Prediction (NCEP) and the US Department of Energy (DOE). The starting date of NNR is 1979. This article has registered and downloaded the global average 2 m monthly average temperature data from 1982 to 2010 from http://www.esrl.noaa.gov/psd/data/gridded/tables/temperature.html. For Gaussian points, there are 192 × 94 grid points in the world.
4 Methods
4.1 Drought indices
Three drought indices were calculated in this study: drought index (K), Palmer drought severity index (PDSI), and standardized precipitation index (SPI). K was calculated using the Penman formula. PDSI is an index of relative dryness based on monthly temperature and precipitation data along with a physical model of soil water balance. PDSI is normalized and generally ranges from -6 (dry) to +6 (wet). SPI, another index used to characterize drought, has a skew normal distribution. Therefore, it is difficult to compare precipitation at different scales based on SPI. In this study, SPI was first used to calculate the probability distribution (Γ distribution function) of precipitation in a certain period of time. SPI was then converted to a normal distribution probability, and finally the cumulative precipitation frequency to divide the drought level. The calculation process of the three indices can be seen in the literature (GB, National Standard of the People’s Republic of China, GB/T, 20481-2006).
4.2 Observation minus reanalysis
It is difficult to isolate the effect of LUCC on local climate from the background of global climate change using practical observation methods. Reanalysis data only reflect the effects of large-scale circulation and greenhouse gases on climate; thus, reanalysis data cannot reveal the effects of LUCC. Since observed data contain all the radiative forcing factors, the reanalysis surface temperature data can be subtracted from the surface observations to obtain the effect of LUCC on local temperature. That is, the effect of LUCC on local temperature is given by the surface observation data minus the reanalysis surface temperature data. This observation minus reanalysis (OMR) method (Kalman et al., 2003) was used to determine the effect of LUCC on climate in this study.
where ΔTOR represents the OMR temperature, T0 represents the measured temperature and TR represents the reanalysis of temperature.
Calculation process: The temperature OMR is the difference temperature anomaly between the CRU and the NNR data. The OMR trend value is calculated by the average variation of 10a on each grid point in order to reduce the random error, and then the hyperbolic interpolation method is used to obtain the temperature OMR. The spatial resolution of grid data is 1 km × 1 km, which is consistent with the spatial resolution of land use/cover data. The specific calculation process is referred to Kalman et al. (2003) and Yang et al. (2009).
4.3 Trends in meteorological elements
Trends in the time series of different meteorological elements were analyzed by linear trend estimation. For the data sequence y(x), x = 1, 2, ..., n, the original sequence was fitted by a linear function:
where the sign of “a” represents the direction of change in the data series with time, the absolute value of a represents the rate of change in the data series, and b is the y intercept.
4.4 Weather research and forecasting model
The Weather Research and Forecasting (WRF) model, a new-generation mesoscale model jointly developed by the National Center for Atmospheric Research (NCAR), was applied in the study area from the initial mesoscale weather forecast to the regional climate simulation. The WRF model is appropriate for long-term regional climate modeling. In recent years, the WRF model has been widely used to study land-atmosphere interactions in China.
The specific simulation process: The land use type parameter is set by the “land cover type-physical parameter” checklist preset by the model; the simulated area is the Songnen Plain. The center point of the simulated area was located at 125°E, 46°N. There were 94 grid points in the east-west direction and 89 in the north-south direction. The mesh size of the cell grid was 30 km × 30 km. The integration time was from January 1, 2008, to December 31, 2012. FNL reanalysis data (daily grid point data from US National Center for Environment Prediction, NCEP) reanalysis data at six-hour intervals were used as the side boundary, as shown in Table 2. A consistent physical parameterization scheme is adopted. The main physical process parameterization schemes are as follows: WSM3 simple ice microphysical scheme (Myhre G and Myhre A, 2003), CAM3 radiation scheme, YSU boundary layer scheme, Grell-Devenyi ensemble cumulus convection scheme and Noah-MP land surface process scheme (Zhang et al., 2015).
| Test name | Type of test | Land cover data | Simulation time |
|---|
| 1910s test | Control test | 1910s data | 2008-2012 |
| 1930s test | Comparative test | 1930s data | 2008-2012 |
| 1950s test | Comparative test | 1950s data | 2008-2012 |
| 1970s test | Comparative test | 1970s data | 2008-2012 |
| 1980s test | Comparative test | 1980s data | 2008-2012 |
| 1990s test | Comparative test | 1990s data | 2008-2012 |
| 2000s test | Comparative test | 2000s data | 2008-2012 |
| 2010s test | Comparative test | 2010s data | 2008-2012 |
Table 2.
Experimental design
Based on the land use and cover data for Songnen Plain, a set of control experiments and seven sets of experiments for comparison with the control were designed. The experimental program with the same experimental setup and the same physical parameters in the eight experiments excluded the land cover data. The control experiment, which was based on the land cover data from the 1910s, represented farmland before agricultural reclamation. The land cover data for the 1930s, 1950s, 1970s, 1980s, 1990s, 2000s, and 2010s represented different periods after reclamation.
5 Results and analysis
5.1 Trends in drought in Songnen Plain over the past 100 years
Three drought indices (K, PDSI, and SPI) were calculated from 1901 to 1930 and from 1981 to 2010 (Table 3). Based on these indices, there was no significant drying trend from 1901 to 1930 in Songnen Plain as a whole. In contrast, all three drought indices indicated a significant drying trend from 1981 to 2010. Only the northwestern part of Songnen Plain exhibited a drying trend from 1901 to 1930; most of the eastern part of the study area showed a wetting trend (Figure 4). From 1981 to 2010, most of Songnen Plain showed a drying trend, and the drought indices in most areas were significantly higher than those from 1901-1930 (Figure 5). While these trends were mainly attributed to changes in climate, the expansion in farmland in Songnen Plain also played a role and should be further studied.
| Index | Average value | Range | Climatic tendency rate (10a) | Significance test (P < 0.1) |
|---|
| 1901-1930 | K | 1.33 | 0.28-1.87 | -0.003 | no |
| 1901-1930 | PDSI | -0.95 | -4.29-3.93 | 0.09 | no |
| 1901-1930 | SPI | -0.29 | -1.46-0.98 | 0.06 | no |
| 1981-2010 | K | 1.30 | 0.92-1.80 | 0.08 | yes |
| 1981-2010 | PDSI | -0.29 | -3.27-2.35 | -0.82 | yes |
| 1981-2010 | SPI | 0.08 | -0.61-0.98 | -0.21 | yes |
Table 3.
Comparison of drought indices for 1901-1930 and 1981-2010 in Songnen Plain
Figure 4.Figure 4
Figure 5.Figure 5
5.2 Factors affecting the drought indices
All the meteorological factors for 1901-1930 and 1981-2010 were subjected to variance analysis in this study. Average temperature, maximum temperature, minimum temperature, diurnal temperature range, evapotranspiration, water vapor pressure, and frost day all showed highly significant differences (0.01 probability level) between the two time periods, while cloud cover showed a significant difference (0.05 probability level). The average temperature, maximum temperature, minimum temperature, diurnal temperature range, evapotranspiration, water vapor pressure, precipitation, and precipitation days were higher from 1981 to 2010 than from 1901 to 1930, whereas the cloud cover and frost days were lower; however, the precipitation and the number of precipitation days were not significantly different between the two time periods. Thus, the change in dry rate in 1981-2010 was larger than that in 1901-1930, which may be attributed to the significant changes in meteorological factors (Table 4). The three drought indices and meteorological elements were subjected to correlation analysis. The three drought indices were significantly correlated with meteorological factors (P < 0.05) in Songnen Plain from 1901 to 1930 and 1981 to 2010, and the correlation coefficients decreased in the following order: precipitation > evapotranspiration > average temperature > diurnal temperature range > maximum temperature (Table 5). Although the precipitation and precipitation days increased from 1901-1930 to 1981-2010, the change was not significant. Therefore, we can conclude that the drought indices were greatly affected by evapotranspiration and temperature. We then calculated the correlation coefficients between evapotranspiration and all temperature elements. The correlation coefficients between evapotranspiration and average temperature, maximum temperature, and diurnal temperature range were 0.678, 0.777, and -0.005, respectively. Thus, evapotranspiration was significantly correlated with average temperature and maximum temperature. These results indicate that average temperature, maximum temperature, and diurnal temperature range were the main factors affecting the three drought indices. The drought indices increased with increasing average temperature, maximum temperature, and diurnal temperature range; accordingly, the climate became drier, resulting in a tendency toward drought.
| Years | 1901-1930 | 1981-2010 | |
|---|
| Factors | Average value | Change rate (10a) | Average value | Change rate (10a) | Variance analysis(t value) |
| Average temperature (℃) | 2.8 | 0.08 | 4.1 | 0.33** | -8.84*** |
| Maximum temperature (℃) | 9.1 | 0.07 | 9.9 | 0.33** | -5.55*** |
| Minimum temperature (℃) | -3.4 | 0.08 | -1.6 | 0.34** | -11.44*** |
| Diurnal temperature range (℃) | 12.5 | -0.01 | 11.6 | -0.01 | 9.52*** |
| Precipitation (mm) | 495.1 | 12.56 | 516.6 | -15.08 | -1.05 |
| Evaporation (mm) | 791.1 | 12.70 | 821.5 | 18.20** | -3.05*** |
| Precipitation days (d) | 84.1 | 0.01 | 85.3 | 0.01 | -0.81 |
| Water vapor pressure (hPa) | 7.5 | -0.03 | 7.8 | -0.02 | -4.15*** |
| Cloud cover (%) | 46.1 | 0.01* | 44.8 | 0.01* | -5.55** |
| Frost days (d) | 198.1 | -1.47 | 186.1 | -0.34*** | 8.71*** |
Table 4.
Comparison of meteorological factors for 1901-1930 and 1981-2010 in Songnen Plain
| 1901-1930 | 1981-2010 |
|---|
| K | PDSI | SPI | K | PDSI | SPI |
| Cloud cover (%) | -0.30 | 0.34 | 0.23 | -0.03 | -0.27 | -0.32 |
| Water vapor pressure (hPa) | 0.14 | -0.24 | -0.10 | -0.46* | 0.51** | 0.38* |
| Precipitation (mm) | -0.92** | 0.82** | 0.68** | -0.94** | 0.77** | 0.60** |
| Evaporation (mm) | 0.59** | -0.72** | -0.55** | 0.77** | -0.71** | -0.52** |
| Precipitation days (d) | -0.90** | 0.83** | 0.67** | -0.84** | 0.82** | 0.59** |
| Average temperature (℃) | 0.46* | -0.57** | -0.39* | 0.43* | -0.40* | -0.26 |
| Minimum temperature (℃) | 0.29 | -0.40* | -0.23 | 0.29 | -0.27 | -0.16 |
| Maximum temperature (℃) | 0.58** | -0.68** | -0.51** | 0.53** | -0.49** | -0.34 |
| Diurnal temperature range (℃) | 0.51** | -0.49** | -0.49** | 0.45* | -0.41* | -0.32 |
| Frost days (d) | -0.25 | 0.35 | 0.19 | -0.06 | 0.21 | 0.16 |
| K | 1 | -0.86** | -0.75** | 1 | -0.79** | -0.59** |
| PDSI | -0.86** | 1 | 0.91** | -0.79** | 1 | 0.89** |
| SPI | -0.75** | 0.91** | 1 | -0.59** | 0.09** | 1 |
Table 5.
Correlation coefficients between drought indices and all temperature elements in Songnen Plain
5.3 Effects of farmland expansion on temperature in Songnen Plain over the past 100 years
5.3.1 Model simulation results
Based on the model simulation results, the average temperature in Songnen Plain increased by 0.02℃ from the 1910s to the 2010s (linear rate = 0.00℃/10a), but the increase was not significant (Figure 6a). The maximum temperature of the land surface increased significantly by 0.09℃ (linear rate = 0.01℃/10a; Figure 6b), while the minimum temperature of the land surface decreased significantly by 0.03℃ (linear rate = -0.01℃/10a; Figure 6c). The expansion of cultivated land in Songnen Plain over the past 100 years significantly affected the maximum and minimum temperatures (i.e., the maximum temperature increased, while the minimum temperature decreased). Because of these effects, the change in average temperature was insignificant, while the diurnal temperature range increased by approximately 0.05℃. As cultivated land expanded, the area of maximum temperature in Songnen Plain gradually moved from the southeastern to the central-western part of the study area. This shift corresponds to the shift in the most concentrated areas of cultivated land (Figure 7b). In contrast, the area of minimum temperature shifted in the opposite direction as the location of maximum temperature (Figure 7c). Changes of the average temperature were basically consistent with the direction of maximum temperature movement (Figure 7a).
Figure 6.Figure 6
Figure 7.Figure 7
5.3.2 Results of statistical analysis
The OMR values of Songnen Plain were calculated from 1980 to 2010, and the spatial distribution of OMR was obtained by spatial interpolation. Land use maps from 1980, 1990, and 2010 were overlaid with OMR spatial maps. The OMR values of farmland and grassland were then extracted, and the mean values were calculated (Table 6). The conversion of grassland into farmland increased the average temperature and maximum temperature during the growing season in the study area but decreased the minimum temperature. These results are consistent with the simulation results, further confirming the reliability of the simulation results.
| Temperature | LUCC | Spring | Summer | Autumn | Winter |
|---|
| Average | Grassland | 0.04 | -0.04 | -0.02 | 0.03 |
| Average | Farmland | 0.03 | -0.03 | -0.02 | -0.00 |
| Maximum | Grassland | 2.78 | 1.36 | 2.24 | 2.69 |
| Maximum | Farmland | 2.78 | 1.64 | 2.38 | 2.19 |
| Minimum | Grassland | 1.83 | 1.90 | 1.81 | -1.86 |
| Minimum | Farmland | 1.76 | 1.88 | 1.73 | -1.91 |
Table 6.
OMR values for farmland and grassland (℃)
6 Discussion
Up to now, there are few studies on the impact of farmland expansion on drought index, some of which involve the impact of farmland expansion on precipitation. For example, the expansion of farmland in India during 1990-2000 weakened the average precipitation intensity and reduced the total precipitation by 12.8% (Mao et al., 2016). Agricultural reclamation in traditional agricultural areas in China in the past 300 years has led to a decrease in water vapor supply and precipitation in the Huang-Huai-Hai region (Ge et al., 2013). Land use change in China caused decrease of annual pecipitation in North China from 1987 to 2001 (Gao et al., 2007). Under the farmland expansion, precipitation has decreased and drought has intensified in Northeast China (Dong et al., 2014). Due to changes in land use/land cover, summer precipitation decreased in northern China from 1980 to 2000 (Li et al., 2017). The greenness of cropland increased led to the cooling and wetting effects in spring, resulting in warming and drying effects in early summer in the North China Plain during 1982-2006 (Zhang et al., 2012). It also showed that the wetting or drying effects accounted for about 48% of the spatial variations in spring daily minimum humidity change and about 19% in early summer (Liu et al., 2016). In this paper, the research on the drought effect caused by farmland expansion is different from the previous research. Because precipitation in the growing season of the Songnen Plain has increased, the three indicators indicating drought in 1980-2000 showed a significant increase in drying trend. This paper analyzes that the key meteorological factors which determined the three drought indices are the average temperature, the highest temperature and the temperature difference. And the expansion of farmland has obvious influence on the three indicators. Therefore, it is considered that the expansion of the farmland strengthens the regional drought degree by affecting the temperature.
While many studies have focused on the conversion of forest to farmland (Snyder et al., 2004; Findell et al., 2007; Bonan, 2008), little attention has been paid to the climatic effects of the conversion from grassland to farmland. Eastman et al. (2001) simulated the climate effects of converting natural grassland into farmland in the Great Plains of the United States and found that the average daily maximum temperature of farmland increased by 1-6℃ during the growing season in most parts of the Great Plains. Specifically, when natural grasslands were converted into cultivated lands for wheat, maize, and other crops in the northeastern United States, South Dakota, Nebraska, and Kansas, the temperature increased minimally in April, increased to a greater extent in May and June, and exhibited the largest increase from July to September during the growing season. In some places, the maximum temperature increased by more than 6℃ from July to September. The increasing trend in temperature then slowed in October during the harvest. These findings are consistent with the results of the present study.
Eastman et al. (2001) studied the mechanism of increasing maximum temperature associated with the conversion of natural grassland to farmland. They found that the increase is mainly caused by the lower reflectivity of farmland compared to grassland during the growing season, and the sensible heat flux is larger than the latent heat flux in grassland. In this study, MODIS reflectance data were overlain with land use data for Songnen Plain in 1990, 1995, and 2010, and the average reflectance values of grassland and farmland were calculated for each season (Table 7). The reflectivity of cultivated land was higher than that of grassland in spring and winter, while the opposite was true in summer and autumn. Thus, the surface temperature of cultivated land was lower than that of grassland in spring and winter, and the conversion of grassland to farmland reduced the surface temperature in spring and winter. Conversely, the conversion of grassland to cultivated land increased the temperature in summer and autumn. As a result, the change in average temperature was not significant. The simulation results show that the surface sensible heat increased by 0.6 W/m2 from the 1910s to the 2010s (linear rate = 0.15 W·m-2/10a; Figure 8a), while the surface latent heat flux decreased by 3.4 W/m2 (linear rate = -0.46 W·m-2/10a; Figure 8b). These changes were attributed to farmland expansion in Songnen Plain. The above results indicate that farmland expansion can increase sensible heat flux, maximum temperature, and diurnal temperature range and decrease latent heat flux and minimum temperature. Thus, the increase in average temperature from the 1910s to the 2010s in Songnen Plain was not significant. The results of this study further confirm the physical mechanism proposed by Eastman et al. (2001).
| Year | Spring | Summer | Autumn | Spring |
|---|
| Farmland | 0.30 | 0.28 | 0.17 | 0.22 | 0.54 |
| Grassland | 0.29 | 0.25 | 0.18 | 0.22 | 0.50 |
Table 7.
The reflectance value of farmland and grassland in each season
Figure 8.Figure 8
Many studies have suggested that a significant increase in the minimum temperature is the main cause for climate warming. Alexander et al. (2006) attributed global warming to the increase in minimum temperature in the 20th century. Hossein and Parisa (2011) reported that the rate of increase in minimum temperature (0.314℃/10a) was larger than that of maximum temperature in the western part of Iran from 1966 to 2005. Duhan et al. (2013) found that in India, the rate of increase in minimum temperature (0.420℃/10a) was higher than those of average temperature and maximum temperature from 1901 to 2013. Tang et al. (2007) studied the change in temperature based on meteorological data in China (from1961 to 2002) and found that the minimum temperature increased faster than the maximum temperature. Sun et al. (2008) analyzed data from 74 meteorological stations in Northeast China and found that the increasing trend in minimum temperature from 1959-2002 was distinct from the trend in maximum temperatur. Xu et al. (2014) found that the increasing trend of the mean and maximum air temperature over China indeed shifted, however the increasing trend of minimum air temperature over China did not cease from 1961 to 2014 .This study analyzed the change in temperature in Songnen Plain over the past 100 years (Figure 9). The average temperature, maximum temperature, and minimum temperature in Songnen Plain showed significant increasing trends over the past 100 years (0.05 probability level, R2 = 0.20). The annual mean temperature and minimum temperature showed significant increasing trends (0.01 probability level, R2 = 0.25), while the daily temperature difference showed a significant decreasing trend. These findings indicate that farmland expansion in Songnen Plain over the past century contributed positively to the increase in maximum temperature and negatively to the increase of minimum temperature. Farmland expansion also contributed negatively to the decrease in daily temperature range. In other words, the expansion of cultivated land in Songnen Plain in the past century sped up the regional increase in maximum temperature but slowed down the increase in minimum temperature along with the reduction in diurnal temperature range. If the effect of farmland expansion on temperature change is linear, its contribution to localized warming can be calculated. Assuming a linear effect, the contributions of farmland expansion in Songnen Plain were 12.037% for the increase in maximum temperature, -3.500% for the increase in minimum temperature; and 1.948% for the increase in average temperature. Thus, among temperature parameters, the expansion of cultivated land in Songnen Plain over the past 100 years had the greatest effect on the increase in maximum temperature.
Figure 9.Figure 9
7 Conclusions
Based on the calculated values of K, PDSI, and SPI, the entire Songnen Plain showed a significant drying trend from 1981 to 2010, and the tendency rates were 0.08, -0.82 and -0.21. In contrast, during the first 30 years of the 20th century, no significant drying trend was observed, and arid areas were only found in the northwestern part of Songnen Plain, K, PDSI and SPI tendencies were -0.003, 0.09 and 0.06, respectively. The maximum temperature, average temperature, and diurnal temperature range were significantly correlated with the three drought indices. In the last 30 years of the 20th century, the maximum temperature, average temperature, and diurnal temperature range showed significant increasing trends. WRF model simulation and statistical analysis indicated that farmland expansion in Songnen Plain over the past 100 years (1910 to 2010) caused the increases in maximum temperature and diurnal temperature range. The simulation results showed that the average temperature, the maximum temperature and the diurnal temperature range increased by 0.03, 0.13 and 0.20℃, respectively, leading to the development of drought. The findings indicate that farmland expansion has accelerated the development of aridity in Songnen Plain, resulting in the expansion of drought.
References
[1] L V Alexander, X Zhang, T C Peterson et al. Global observed changes in daily climate extremes of temperature and precipitation. Journal of Geophysical Research, 111, 1-22(2006).
[2] R A Betts, P D Fallon, K K Goldewijk et al. Biogeophysical effects of land use on climate: Model simulations of radiative forcing and large-scale temperature change. Agricultural and Forest Meteorology, 142, 216-233(2007).
[3] G B Bonan. Forests and climate change: Forcings, feedbacks, and the climate benefits of forests. Science, 320, 1444-1449(2008). https://www.ncbi.nlm.nih.gov/pubmed/18556546
[4] F Q Cao, L Dan, Z G Ma et al. Simulative study of the cropland change on the regional climate over China. Acta Meteorologica Sinica, 73, 128-141(2015).
[5] D F Chen, Z Y Sun. American agriculture production and the protection of resource and environment. Ecological Economy, 9, 60-65(2001).
[6] D Duhan, A Pandey, K P S Gahalaut et al. Spatial and temporal variability in maximum, minimum and mean air temperatures at Madhya Pradesh in central India. Comptes Rendus Geoscience, 345, 3-21(2013).
[7] S Y Dong, X D Yan, Z Xiong. Modeled impacts of land-use and land-cover change in Northeast China on climate. Climatic and Environmental Research, 19, 351-361(2014).
[8] J L Eastman, M B Coughenour, R A Pielke et al. Does grazing affect regional climate?. Journal of Hydrometeorology, 2, 243-235(2001).
[9] P S Emerson, E William, B S Magnusson et al. Extinction risks forced by climatic change and intraspecific variation in the thermal physiology of a tropical lizard. Journal of Thermal Biology, 73, 50-60(2018). https://www.ncbi.nlm.nih.gov/pubmed/29549991
[10] J J Feddema, K W Oleson, G B Bonan et al. The importance of land-cover changes in simulating future climate. Science, 310, 1674-1678(2005). https://www.ncbi.nlm.nih.gov/pubmed/16339443
[11] K L Findell, E Shevliakova, P C D Milly et al. Modeled impact of anthropogenic land cover change on climate. Journal of Climate, 20, 3621-3634(2007). https://www.ncbi.nlm.nih.gov/pubmed/25154094
[12] J A Foley, R DeFries, G P Asner et al. Global consequences of land use. Science, 309, 570-574(2005). https://www.ncbi.nlm.nih.gov/pubmed/16040698
[13] H M Füssel, R J T Klein. Climate change vulnerability assessments: An evolution of conceptual thinking. Climatic Change, 75, 301-329(2006). http://link.springer.com/10.1007/s10584-006-0329-3
[14] X J Gao, D F Zhang, Z X Chen et al. Land use effects on climate in China as simulated by a regional climate model. Science in China: Earth Sciences, 50, 620-628(2007).
[15] Q S Ge, J Y Zheng, X Z Zhang et al. Simulated effects of cropland expansion on summer climate in eastern China in the last three centuries. Advances in Meteorology, 65, 93-100(2013).
[16] Tabari Hossein, Hosseinzadeh Talaee Parisa. Recent trends of mean maximum and minimum air temperatures in the western half of Iran. Meteorology and Atmospheric Physics, 111, 121-131(2011).
[17] Climate change 2013: The physical science basis. In: Stocker T F, Qin D H, Plattner G K et al. Contribution of Working Group I to the Fifth Assessment Report of the Intergovernmental Panel on Climate Change(2013).
[18] L Q Jiang, L J Zhang, S Y Zang et al. Comparison of approaches of spatially explicit reconstruction of cropland in the late Qing Dynasty. Journal of Geographical Sciences, 70, 625-635(2015).
[19] E Kalnay, M Cai. Impact of urbanization and land-use change on climate. Nature, 423, 528-531(2003). https://www.ncbi.nlm.nih.gov/pubmed/12774119
[20] X C Lizana, A Avila, A Tolaba et al. Field responses of potato to increased temperature during tuber bulking: Projection for climate change scenarios, at high-yield environments of Southern Chile. Agricultural and Forest Meteorology, 239, 192-201(2017).
[21] X H Lee, M L Goulden, D Y Hollinger et al. Observed increase in local cooling effect of deforestation at higher latitudes. Nature, 479, 384-387(2011). https://www.ncbi.nlm.nih.gov/pubmed/22094699
[22] Q P Li, Y H Ding, W J Dong. A numerical simulation study of impacts of historical land-use change on the regional climate in China since 1700. Acta Meteorologica Sinica, 21, 9-23(2007).
[23] X X Li, X Z Zhang, L J Zhang. The varied impacts of land use/cover change on summer precipitation over eastern China. Geographical Research, 36, 1233-1244(2017).
[24] J Y Liu, Q Q Shao, X D Yan et al. The climatic impacts of land use and land cover change compared among countries. Journal of Geographical Sciences, 26, 889-903(2016).
[25] R Mahmood, R A Pielke, K G Hubbard et al. Land cover changes and their biogeophysical effects on climate. International Journal of Climatology, 34, 929-953(2014).
[26] R Mahmood, R A S Pielke, K G Hubbard et al. Impacts of land use/land cover change on climate and future research priorities. Bulletin of the American Meteorological, 91, 37-46(2010).
[27] J Meng. Agricultural development of Qing dynasty in Shanxi region and destruction of ecological environment. Journal of Historical Science, 37-42(2002).
[28] H Q Mao, Z Xiong, X D Yan et al. Modeled impact of cropland expansion on regional climate in India. Chinese Journal of Ecology, 35, 1627-1634(2016).
[29] G Myhre, A Myhre. Uncertainties in radiative forcing due to surface albedo changes caused by land-use changes. Journal of Climate, 16, 1511-1524(2003). http://journals.ametsoc.org/doi/abs/10.1175/1520-0442-16.10.1511
[30] S S Peng, S Piao, Z Z Zeng et al. Afforestation in China cools local land surface temperature. Proceedings of the National Academy of Sciences, 111, 2915-2919(2014). https://www.ncbi.nlm.nih.gov/pubmed/24516135
[31] R A Pielke, A Pitman, D Niyogi et al. Land use/land cover changes and climate: Modeling analysis and observational evidence. Wiley Interdisciplinary Reviews Climate Change, 2, 828-850(2011). http://doi.wiley.com/10.1002/wcc.144
[32] G Sampaio, C A Nobre, M H Costa et al. Regional climate change over eastern Amazonia caused by pasture and soybean cropland expansion. Geophysical Research Letters, 34, L17709(2007).
[33] P Shilong, F Pierre, C Philippe et al. Changes in climate and land use have a larger direct impact than rising CO2 on global river runoff trends. Environmental Sciences, 104, 15242-15247(2007). https://www.ncbi.nlm.nih.gov/pubmed/17878298
[34] P K Snyder, C Delire, J A Foley. Evaluating the influence of different vegetation biomes on the global climate. Climate Dynamics, 23, 279-302(2004).
[35] X P Song, C Matthew, S V Hansen1 et al. Global land change from 1982 to 2016. Nature, 560, 639-643(2018). https://www.ncbi.nlm.nih.gov/pubmed/30089903
[36] F H Sun, J Yuan, Y Guang. A symmetric change of maximum and minimum temperature in the Northeast China from 1959-2002. Scientia Geographica Sinica, 28, 532-536(2008).
[37] G L Tang, Y H Ding. Impacts of average air temperature derived from maximum and minimum temperatures on annual mean air temperatures series of China. Journal of Applied Meteorological Science, 18, 187-192(2007).
[38] X Y Wen, S W Wang, J H Zhu et al. An overview of China climate change over the 20th century using UK UEA/CRU high resolution grid data. Chinese Journal of Atmospheric Sciences, 30, 894-903(2006).
[39] Y Xu, G L Tang, Q Zhang. Analysis of the variation of the air temperature over China during the global warming hiatus period. Climate Change Research, 13, 569-577(2017).
[40] J M Yan. Lessons and enlightenment from land exploration and utilization in the west of the USA. Journal of Peking University (Humanities and Social Sciences), 38, 119-126(2001).
[41] X C Yang, Y L Zhang, L S Liu et al. Sensitivity of surface air temperature change to land use/cover types in China. Science in China (Series D: Earth Sciences), 39, 1207-1215(2009).
[42] D E Zhang. Historical records of environmental changes and agricultural development in Northwest China. Advances in Climate Change Research, 1, 58-64(2005).
[43] D F Zhang, X J Gao, Y Shi et al. Agricultural land use effects on climate over China as simulated by a regional climate model. Journal of Meteorological Research, 24, 215-224(2010).
[44] L J Zhang, L Q Jiang, X Z Zhang. Spatial explicit reconstruction of farmland for Heilongjiang province of Northeast China in 1900-1910. Journal of Geographical Sciences, 25, 627-637(2015).
[45] L J Zhang, L Q Jiang, X Z Zhang. Reconstruction of cropland spatial pattern and its spatiotemporal changes over the 20th century on the Songnen Plain, Northeast China. Journal of Geographical Sciences, 27, 1209-1226(2017).
[46] L J Zhang, C Z Wang, X X Li et al. Impacts of agricultural expansion (1910s-2010s) on the water cycle in the Songneng Plain, Northeast China. Remote Sensing, 10, 1108(2018).
[47] L Z Zhang, T Pan, H W Zhang et al. The effects of forest area changes on extreme temperature indexes between the 1900s and 2010s in Heilongjiang Province, China. Remote Sensing, 9, 1280(2017).
[48] X Z Zhang, J Y Liu, Z Xiong et al. Simulated effects of agricultural development on surface air temperature over central and eastern China in the late 20th century. Acta Geographica Sinica, 70, 1423-1433(2015).
[49] X Z Zhang, W C Wang, X Q Fang et al. Agriculture development-induced surface albedo changes and climatic implications across northeastern China. Chinese Geographical Science, 22, 264-277(2012).
[50] L Y Zhao, R Ding, J C Moore. The High Mountain Asia glacier contribution to sea-level rise from 2000 to 2050. . Annals of Glaciology, 57, 223-231(2016).