
Haijun WANG, Bin ZHANG, Yaolin LIU, Yanfang LIU, Shan XU, Yuntai ZHAO, Yuchen CHEN, Song HONG. Urban expansion patterns and their driving forces based on the center of gravity-GTWR model: A case study of the Beijing-Tianjin-Hebei urban agglomeration[J]. Journal of Geographical Sciences, 2020, 30(2): 297
- Journal of Geographical Sciences
- Vol. 30, Issue 2, 297 (2020)
Abstract
Keywords
1 Introduction
Since 1978, and especially in the early 1990s when China reformed the land-use system, the pace of urban construction in China has accelerated. In 1990, the average urbanization rate of China was 26.41%, and in 2015 it reached 56.10%. The rapid urbanization pace and industrialization process has spurred urban development into an advanced stage, and the regional connection has become increasingly close. Urban agglomeration has gradually become the key focus of geographical research. The analysis of the urban expansion patterns and driving forces has gradually become a research hotspot (
However, there are still some inadequacies in the present studies: 1) the analysis of the driving forces of urban expansion patterns has been limited to the analysis of the speed and area of expansion, and multi-dimensional analyses are rare. The related research into urban agglomeration has been concentrated on the overall level, and research into the core driving forces has rarely been seen under the background of the overall policy of urban agglomeration. 2) The spatial interaction between the cities within urban agglomerations has led to the fact that the urban land expansion of urban agglomerations is different from that of single cities (
In view of this, in this paper, we build the center of gravity-geographically and temporally weighted regression (GTWR) model by coupling the center of gravity model with the GTWR model (
2 Research methods
2.1 Analysis index of expansion pattern
2.1.1 Intensity index of urban expansion
The intensity index of urban expansion indicates the stage change rate of the urban land area of each spatial unit, which can directly reflect the change range and speed of the urban land area of each spatial unit. Through the calculation of the intensity index of the urban expansion of each city within the urban agglomeration, we can study the development speed and condition of the cities within the urban agglomeration. After standardization, the speed of the urban land expansion in different stages can be compared (
where UERi indicates the intensity index of urban expansion, and $U_{i}^{t_{1}}$ and $U_{i}^{t_{2}}$ represent the urban land-use area of spatial unit at i times t1 and t2, respectively. Δt indicates the duration of the research.
2.1.2 The differentiation index of urban expansion
The differentiation index of urban expansion is the ratio of the change rate of urban expansion in a spatial unit to the change rate of urban expansion in the whole research area. Its essence is the ratio of the dynamic degree of urban land use in each research unit to the dynamic degree of urban land use in the whole study area. It allows the speed of the urban land expansion of different spatial research units to be compared. On the other hand, the spatial distribution of the index values can also reflect the synergistic development trend of urban agglomeration (
where UEDIi indicates the differentiation index of the urban expansion, and $ u_{i}^{t_{1}}$ and $u_{i}^{t_{2}}$ represent the urban land-use area of spatial unit i at times t1 and t2, respectively. $ u^{t_{1}}$ and $ u^{t_{2}}$ represent the urban land-use area in the research region at times t1 and t2, respectively.
2.1.3 The land urbanization rate
The land urbanization rate is the ratio of urban construction land to urban-rural construction land in the process of urbanization, and it measures the level of land urbanization. The study of land urbanization is a combination of urbanization and land-use change. In this paper, we reveal the rules of the urban expansion patterns and study the change of the urbanization level from the spatial view (i.e. the land urbanization), under the background of urban land expansion. We analyze the spatio-temporal evolution trends of urban land expansion and the variation in the urbanization rate, and further analyze the driving forces of these trends and variations (
2.1.4 The fractal dimension index
The fractal dimension index comes from the concept of geometry. Its purpose is to study the characteristics of irregular geometry. Currently, most geographical researchers use the fractal dimension index to draw the characteristics of geographical objects, in combination with the characteristics of the geographical phenomena. The fractal dimension index is an important index (
Where Dit indicates the fractal dimension index, and Pit is the perimeter of the built-up area of spatial unit i in year t. Ait is the built-up area of spatial unit i at year t.
2.2 Center of gravity-GTWR model
The “center of gravity” is a physical concept. In geography, it indicates the spatial balance point of a certain area, and is often used in the study of urban evolution and the change of land-use types. The barycentric coordinate system is an index that can be used to describe the spatial distribution of geographical objects, and it can clearly and objectively reflect the changing spatial and temporal trajectory of the regional geographical objects (
As an extension of the geographically weighted regression model, the geographically and temporally weighted regression (GTWR) model is a spatio-temporal nonstationary regression model, where the core idea is to add the time factor to the geographically weighted regression model. In this model, spatial and temporal coordinates are added to calculate the space-time weight matrix. The traditional geographically weighted regression analysis does not introduce the temporal dimension, and the spatial coordinate data of the analysis object are fixed. However, the GTWR model requires that the analysis objects have different spatial coordinates at different time stages, and more coordinate coincidences will make the model’s result close to that of linear regression analysis, which focuses on the temporal dimension (
Where Yi is the observed value; $ X_{i}^{t},Y_{i}^{t},T_{i}$ are the spatio-temporal coordinates of sample point i; $\beta_{0}(X_{i}^{t},Y_{i}^{t},T_{i})$ is the regression constant of point i (i.e. the constant term in the spatio-temporal geographically weighted regression model); $\beta_{k}(X_{i}^{t},Y_{i}^{t},T_{i})$ is the k-th regression coefficient of point i (i.e. the model function’s term weight of $ X_{i}^{t},Y_{i}^{t},T_{i}$);Xik is the value of independent variable X at point i (i.e. each quantitative indicator’s value in the spatio-temporal graphically weighted regression model); $\varepsilon_{i}$ is the residual error of the model function; and $ X_{i}^{t},Y_{i}^{t}$ are the barycenter point’s longitude and latitude coordinates, respectively, which are calculated as follows:
Where $ C_{i}^{t}$ indicates the urban land-use area of spatial unit i at time t; and Xi,Yi are the geographic coordinates of the barycenter point of the built-up area of spatial unit i.
3 Research area and data
3.1 Research area
The Jing-Jin-Ji urban agglomeration is located in the north of the North China Plain, facing Bohai Bay in the east and Taihang Mountains in the west. It is an important part of the “capital economic circle”. It is composed of 13 cities, namely, Beijing, Tianjin, Shijiazhuang, Baoding, Zhangjiakou, Chengde, Tangshan, Qinhuangdao, Cangzhou, Langfang, Hengshui, Xingtai, and Handan, covering a total area of 216,485.2 km2. In the Jing-Jin-Ji urban agglomeration, the natural environment is dominated by plain and mountainous areas. The mountains are mainly concentrated to the north of Baoding, Zhangjiakou, and Chengde. The plain area is large and flat, and the type of cultivated land in this area is mainly dry land agriculture. The Jing-Jin-Ji urban agglomeration is an important part of the capital economic circle of China, so it is of great significance to analyze the characteristics of the urban land expansion patterns and their driving forces in this area.
3.2 Sources of data
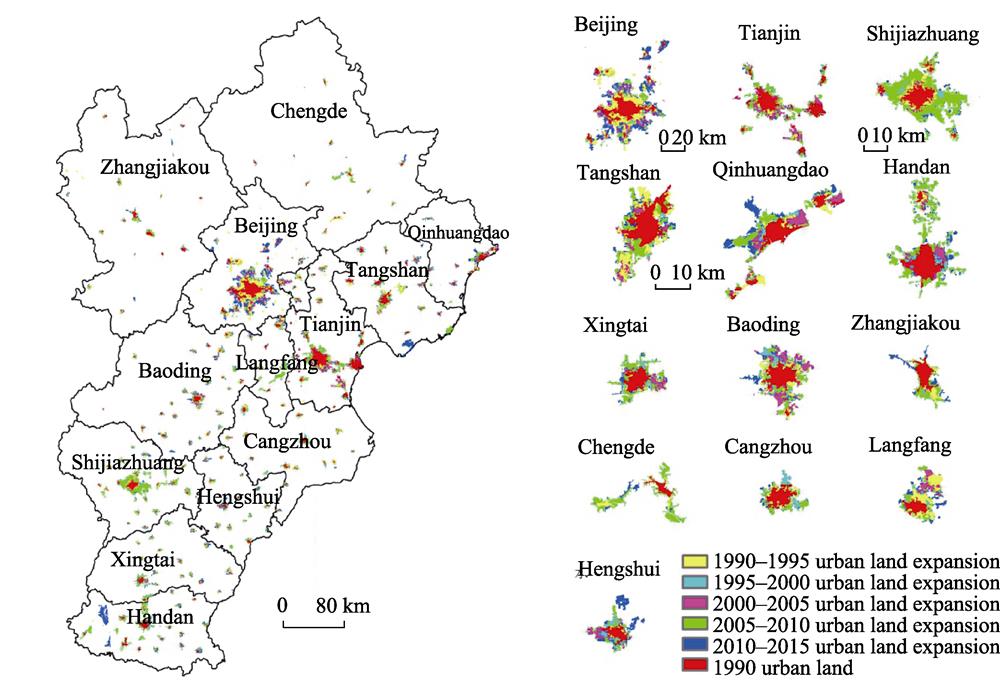
The spatial data used in this research were the 30 x 30 m land-use grid data and the vector data of the administrative division of the Jing-Jin-Ji urban agglomeration, covering the six periods of 1990, 1995, 2000, 2005, 2010, and 2015. This dataset is part of the 1:10,000,000 scale land-use status remote sensing monitoring database (using Landsat TM/ETM remote sensing images as the main data source and produced by artificial visual interpretation) of the Resources and Environmental Science Data Center of the Chinese Academy of Sciences. This data set includes six first-degree types of cultivated land, woodland, grassland, water area, urban and rural industrial and mining land, and unused land; and 25 second-degree types (among which the urban and rural industrial and mining land is divided into urban land, rural settlements, and another three types of construction land). We obtained the urban land-use information and data of different types of land use for the six periods, and we then established the urban land expansion changes over the 25 years (
![]()
Figure 1.
3.3 Model data preprocessing
The GTWR model is a regression method combining temporal and spatial factors, which can analyze the driving forces of the spatial and temporal evolution in a certain period of time. The index value of the urban land expansion patterns was used as the dependent variable to analyze the driving forces of the spatio-temporal evolution of the urban land expansion of the Jing-Jin-Ji urban agglomeration. The research indices were divided into two categories: 1) staged indices, i.e., the intensity index of the urban expansion and the differentiation index of the urban expansion; and 2) continuity indices, i.e., the fractal dimension indices of urban land use and urban land urbanization rate. For the staged indices, the independent variable adopted the incremental change value between the early stage and the end stage, and the temporal node adopted the end-stage time point. For the continuity indices, the independent variable adopted the factor value of the year, and the temporal node adopted the index year. Using ArcGIS 10.2, attributes were added to the object points (13 cities in five phases or periods of six years) with spatio-temporal coordinates, and the characteristic index values were assigned to the attribute fields of the corresponding spatio-temporal object points.
3.3.1 Selection of the driving factors
According to the existing research literature and statistical yearbooks, the driving factors were selected from 22 types of statistical data, including population, economy, transportation, science and education, culture, and health. The choice of driving factors is shown in
| Index | Variable | Unit | Index | Variable | Unit |
|---|---|---|---|---|---|
| Population | X1 | 104 people | Gross agricultural output value | X12 | 108 yuan |
| Number of year-end social workers | X2 | 104 people | Railway freight volume | X13 | 104 tons |
| GDP | X3 | 108 yuan | Road freight volume | X14 | 104 tons |
| The first industrial output value | X4 | 108 yuan | Railway passenger traffic | X15 | 104 people |
| Secondary industrial output value | X5 | 108 yuan | Highway passenger traffic | X16 | 104 people |
| Tertiary industrial output value | X6 | 108 yuan | Colleges and universities | X17 | 1 |
| Total fixed asset investment | X7 | 108 yuan | College and university students | X18 | 104 people |
| Total retail sales of social consumer goods | X8 | 108 yuan | Primary school students | X19 | 104 people |
| Financial revenue | X9 | 108 yuan | Hospital | X20 | 1 |
| Financial expenditure | X10 | 108 yuan | Health technicians | X21 | 104 people |
| Gross industrial output value | X11 | 108 yuan | Hospital beds | X22 | 104 beds |
Table 1.
The driving factors of urban expansion
3.3.2 Preprocessing of independent variables
To check and exclude the multiple collinearity of the data, we first used the correlation analysis (
| Category | Principal component | Composition of principal component | The dominant direction |
|---|---|---|---|
| Staged index | F1 | X3, X8, X9 | Economy |
| F2 | X7, X10 | Investment development | |
| F3 | X1, X19, X21 | Population and education | |
| F4 | X4, X12 | The first industry | |
| F5 | X16, X1 | Population flow | |
| F6 | X20 | Medical and health | |
| F7 | X15 | Transportation | |
| Continuity index | F1 | X3, X11, X18, X22 | Socio-economic development |
| F2 | X7, X10 | Investment development | |
| F3 | X4, X12 | The first industry | |
| F4 | X13, X16 | Transportation |
Table 2.
The dominant factors of principal components of driving factors
4 Results analysis
4.1 Characteristics of the urban expansion patterns
4.1.1 Intensity characteristics of the urban land expansion
Through ArcGIS 10.2, we used the vector map of the Jing-Jin-Ji urban agglomeration administrative division to extract each city’s urban land-use data for the six periods, obtaining the urban land area of each city and the urban agglomeration, which allowed us to calculate the expansion of the urban land use of each city.
The intensity index is shown in
| 1990-1995 | 1995-2000 | 2000-2005 | 2005-2010 | 2010-2015 | 1990-2015 | |
|---|---|---|---|---|---|---|
| Beijing | 0.255 | 0.020 | 0.037 | 0.015 | 0.051 | 0.121 |
| Tianjin | 0.042 | 0.013 | 0.076 | 0.080 | 0.006 | 0.063 |
| Shijiazhuang | 0.129 | 0.046 | 0.016 | 0.235 | 0.009 | 0.158 |
| Tangshan | 0.143 | 0.008 | 0.034 | 0.084 | 0.056 | 0.112 |
| Qinhuangdao | 0.082 | 0.031 | 0.071 | 0.073 | 0.053 | 0.112 |
| Handan | 0.030 | 0.046 | 0.045 | 0.189 | 0.071 | 0.143 |
| Xingtai | 0.136 | 0.031 | 0.044 | 0.147 | 0.052 | 0.168 |
| Baoding | 0.179 | 0.061 | 0.041 | 0.060 | 0.028 | 0.136 |
| Zhangjiakou | 0.090 | 0.003 | 0.026 | 0.104 | 0.035 | 0.078 |
| Chengde | 0.125 | 0.006 | 0.014 | 0.147 | 0.024 | 0.099 |
| Cangzhou | 0.183 | 0.036 | 0.011 | 0.054 | 0.017 | 0.092 |
| Langfang | 0.305 | 0.022 | 0.062 | 0.138 | 0.031 | 0.247 |
| Hengshui | 0.123 | 0.073 | 0.031 | 0.104 | 0.046 | 0.151 |
Table 3.
The intensity index of the urban expansion in the Jing-Jin-Ji urban agglomeration
4.1.2 Differentiation characteristic of the urban land expansion
We respectively calculated the urban expansion differentiation indices of each city at the city level, using the natural breakpoint classification method to divide the development state into five grades: slow, low speed, medium speed, rapid speed, and high-speed development. From an overall point of view, the speed of the urban development in the southern part of Jing-Jin-Ji has been higher than that in the northern region. Over the study period, the center of the rapid development of the whole region has gradually moved from the north to the south. Compared with the changes in the overall regional development, the cities have shown different stages of high-speed or low-speed development, and the urban development in different cities of the urban agglomeration has been different. However, high-speed development cities have spatial spillover effects, and the barycenter transfer of the high-speed development cities can be affected by the high-speed development of the cities in the last stage. The differentiation index of urban expansion shows that the development gap between the cities in the Jing-Jin-Ji urban agglomeration is still obvious (
![]()
Figure 2.
4.1.3 Morphological characteristics of the urban land expansion
In general, the fractal dimension index is between 1 and 2. The larger the fractal dimension index, the more complex the urban morphology. When the index is less than 1.5, the city’s morphology is relatively regular and complete, and when it is greater than 1.5, the urban morphology is more complex. Over the past 25 years, the fractal dimension indices of Beijing and Tianjin have been obviously higher than those of other areas in the Jing-Jin-Ji urban agglomeration. The fractal dimension indices of each city in the Jing-Jin-Ji urban agglomeration are all below 1.5, reflecting that the urban morphology of each city is regular and complete. After 25 years of development, the fractal dimension index of cities in the Jing-Jin-Ji urban agglomeration has increased to a greater or lesser degree, among which the fractal dimension index of Handan has increased by 0.104, and Beijing has witnessed the smallest change in the fractal dimension index. It is known that, over the 25 years, the urban morphology of Handan has changed dramatically, while that of Beijing has remained relatively stable. On the whole, the changes of the fractal dimension indices of the southern cities in the Jing-Jin-Ji urban agglomeration have been greater than those of the northern cities, among which the changes in the fractal dimension indices of Handan, Xingtai, and Baoding in the south are more obvious, and the northern cities have tended to remain unchanged. The changes of the fractal dimension index reflect the stage, state, and trend of the urban development. Therefore, the limited changes in the fractal dimension index of the Jing-Jin-Ji urban agglomeration reflect that its urban expansion morphology has remained relatively stable. However, the difference between cities is obvious (
| 1990 | 1995 | 2000 | 2005 | 2010 | 2015 | |
|---|---|---|---|---|---|---|
| Beijing | 1.252 | 1.245 | 1.250 | 1.257 | 1.267 | 1.251 |
| Tianjin | 1.236 | 1.242 | 1.244 | 1.267 | 1.263 | 1.263 |
| Shijiazhuang | 1.208 | 1.184 | 1.196 | 1.204 | 1.193 | 1.198 |
| Tangshan | 1.165 | 1.202 | 1.202 | 1.199 | 1.188 | 1.177 |
| Qinhuangdao | 1.193 | 1.204 | 1.204 | 1.189 | 1.196 | 1.206 |
| Handan | 1.137 | 1.141 | 1.137 | 1.130 | 1.243 | 1.241 |
| Xingtai | 1.135 | 1.124 | 1.126 | 1.167 | 1.192 | 1.186 |
| Baoding | 1.141 | 1.200 | 1.189 | 1.210 | 1.192 | 1.185 |
| Zhangjiakou | 1.163 | 1.175 | 1.179 | 1.174 | 1.163 | 1.195 |
| Chengde | 1.209 | 1.220 | 1.221 | 1.221 | 1.267 | 1.267 |
| Cangzhou | 1.155 | 1.132 | 1.147 | 1.150 | 1.163 | 1.159 |
| Langfang | 1.124 | 1.146 | 1.133 | 1.145 | 1.140 | 1.164 |
| Hengshui | 1.158 | 1.124 | 1.142 | 1.164 | 1.166 | 1.181 |
Table 4.
The fractal dimension index of cities in the Jing-Jin-Ji urban agglomeration
4.1.4 Characteristics of the land urbanization
In the Jing-Jin-Ji urban agglomeration, apart from Chengde and Zhangjiakou, whose land urbanization rate in 2010 decreased, the other cities over the last 25 years (1990-2015) have maintained a trend of growth in the land urbanization rate. The urbanization of Beijing and Tianjin is more prominent, and their land urbanization rates are at a high level. The overall land urbanization rate of the whole area has increased gradually, and the growth rate increased somewhat after 2005, indicating that the urbanization speed of the Jing-Jin-Ji urban agglomeration has accelerated since 2005. The overall trend of the urbanization rate is consistent, showing that the development trends of the cities in the agglomeration are consistent. Both Beijing and Tianjin are in the extended development stage, and the high land urbanization rate in Beijing and Tianjin shows that there are still gaps between cities in the agglomeration (
| 1990 | 1995 | 2000 | 2005 | 2010 | 2015 | |
|---|---|---|---|---|---|---|
| Beijing | 0.330 | 0.501 | 0.540 | 0.541 | 0.550 | 0.691 |
| Tianjin | 0.271 | 0.283 | 0.334 | 0.379 | 0.435 | 0.448 |
| Shijiazhuang | 0.158 | 0.204 | 0.247 | 0.257 | 0.355 | 0.371 |
| Tangshan | 0.089 | 0.149 | 0.152 | 0.168 | 0.187 | 0.240 |
| Qinhuangdao | 0.187 | 0.229 | 0.276 | 0.337 | 0.337 | 0.426 |
| Handan | 0.143 | 0.163 | 0.154 | 0.176 | 0.255 | 0.346 |
| Xingtai | 0.082 | 0.117 | 0.128 | 0.150 | 0.173 | 0.218 |
| Baoding | 0.083 | 0.128 | 0.165 | 0.190 | 0.170 | 0.194 |
| Zhangjiakou | 0.120 | 0.157 | 0.170 | 0.186 | 0.172 | 0.201 |
| Chengde | 0.195 | 0.262 | 0.318 | 0.327 | 0.221 | 0.248 |
| Cangzhou | 0.068 | 0.101 | 0.116 | 0.121 | 0.182 | 0.198 |
| Langfang | 0.084 | 0.153 | 0.192 | 0.235 | 0.322 | 0.372 |
| Hengshui | 0.068 | 0.117 | 0.128 | 0.145 | 0.184 | 0.227 |
Table 5.
The land urbanization rate of cities in the Jing-Jin-Ji urban agglomeration
4.1.5 Characteristics of the barycenter transfer of urban land use
During 1990-1995, the direction of the barycenter transfer of the urban expansion moved to the central part of the region, i.e., Beijing and Baoding. As time passed, although the barycenter of the urban land expansion has presented a divergent trend, and no longer shows obvious overall tendency characteristics, the influence between cities has resulted in the expansion barycenters showing a local attraction tendency. The characteristics of the barycenter transfer show that the specific functions of each city have become gradually prominent in the development of the Jing-Jin-Ji urban agglomeration, and the interaction forces among cities have been strengthened (
![]()
Figure 3.
4.2 Analysis of the driving forces of urban land expansion in the urban agglomeration
After processing the data by the method described above, and using the principal component variable as the independent variable, along with the characteristic index value as the dependent variable, we obtained the spatio-temporal coordinates X, Y through barycenter transfer calculation. The minimum step length unit of the time coordinate T value was a day. By using the spatio-temporal weighted regression ArcGIS 10.2 plug-in produced by
![]()
Figure 4.
![]()
Figure 5.
![]()
Figure 6.
![]()
Figure 7.
4.2.1 Analysis of the driving forces of urban intensity changes of land expansion
Cities whose urban land expansion intensity is affected by the same driving force in the Jing-Jin-Ji urban agglomeration have the obvious characteristic of concentration, and this characteristic has shown no obvious change over time. The expansion intensity of the southern cities in the Jing-Jin-Ji urban agglomeration is strongly influenced by the driving forces of F1 (economy) and F4 (the first industry), with Xingtai and Handan as the most out- standing examples. The degree of influence gradually decreases from the south to the north in the agglomeration. The northern cities are strongly influenced by the driving forces of F2 (investment development), F3 (population and education), F5 (population flow), and F7 (transportation), among which Zhangjiakou, Chengde, and Qinhuangdao are the most influenced cities. The degree of influence gradually decreases from north to south in the agglomeration. The cities in the west and south are more strongly influenced by the F6 (medical and health) driving force, while Tangshan and Qinhuangdao are less influenced by this driving force at all stages. The driving force effects on urban expansion intensity changes in the Jing-Jin-Ji urban agglomeration have changed very little over the last 25 years. The urban expansion intensity has been influenced by the different location factors in the different cities. The southern cities are driven by the economy and the development of the first industry, and the northern cities are driven by the investment, population, and transportation development.
4.2.2 Analysis of the driving forces of differentiation changes of urban land expansion
The cities whose urban land expansion differentiation is affected by the same driving force in the Jing-Jin-Ji urban agglomeration have shown obvious characteristics of shrinkage, expansion, or transfer as time has passed. The northern cities are strongly influenced by the F1 (economy), F3 (population and education), F5 (population mobility), and F7 (transportation). With the passage of time, the driving force range of F1 and F5 has contracted to the north, while the driving force range of F3 has extended to the south, and the driving force range of F7 has remained basically unchanged. The cities strongly affected by the F2 (investment development), F4 (first industry), and F6 (medical and health) have gradually shifted from the south to the north over time. The trends of the influence distribution of each driving factor show that cities in the urban agglomeration are influenced by each other, because of their geographical proximity, which is the embodiment of the urban spatial interaction force. The concentration of the driving forces’ influence represents the function orientation and development characteristics of the city.
4.2.3 Analysis of the driving forces of urban morphology changes
The cities whose urban morphology is affected by the same driving force in the Jing-Jin-Ji urban agglomeration have shown obvious characteristics of concentration and transfer. In 1990, the development of society and economy (F1) had a strong influence on the change of the southern cities’ morphology. As time went by, the range in which the cities are strongly driven by F1 gradually moved northward, and then gradually concentrated in the central areas after 2005, which covers cities such as Beijing, Tianjin, and Langfang. Before 2005, the investment development (F2) factor had a strong influence on the urban morphological changes in the central cities such as Beijing, Tianjin, Baoding, and Langfang. After 2005, cities whose morphology is strongly influenced by this factor have been mainly concentrated in southern areas, such as Xingtai and Handan. In 1990, the first industry (F3) factor had a strong influence on the morphological changes in the central and northern cities. With the passage of time, the affected range gradually shifted to the south, and the overall impact degree decreased year by year. In 2010 and after 2010, only Zhangjiakou and Xingtai were influenced by this factor. In 1990, the development of transportation (F4) had a strong influence on the morphological changes in central cities such as Tianjin, Baoding, and Langfang. With the passage of time, the urban range strongly affected by this factor has shown a tendency to expand from the central area to the south. In 2015, only Zhangjiakou, Chengde, and Qinhuangdao were less affected. Overall, the morphology of the Jing-Jin-Ji urban agglomeration has been most influenced by the development of transportation.
4.2.4 Analysis of the driving forces of land urbanization
The changes of the driving forces of the land urbanization of the Jing-Jin-Ji urban agglomeration have shown obvious regularity in time and space. The level of land urbanization in the southern cities has been strongly influenced by the F1 (socioeconomic development), F2 (investment development), and F3 (first industry). Handan and Xingtai have shown the highest level of impact, of which the influence of F1 was unchanged before 2005, but then gradually expanded from the south to the north over time. The influence range of F2 has remained basically unchanged, and the influence range of F3 has gradually shrunk to the south. The level of land urbanization in the central cities has been strongly influenced by the F4 (transportation), with Beijing, Baoding, and Chengde as the most typical examples, as their level has remained unchanged over the past 25 years. The driving forces of the land urbanization of the Jing-Jin-Ji urban agglomeration have also shown obvious regional differences. The urbanization stages of each city are different, and the difference between the north and the south is more prominent. The driving force direction of urban land urbanization is also distinct. Grasping the function of the city is the key to the development of the Jing-Jin-Ji urban agglomeration.
4.3 Analysis of the functional core of urban agglomeration development
Through the above analysis, we have summarized the changes of the core driving forces of the development of the Jing-Jin-Ji urban agglomeration. The results are shown in
| Index | Intensity | Differentiation | Urbanization | The fractal dimension index | |||||
|---|---|---|---|---|---|---|---|---|---|
| Year | 1990-2015 | 1990 | 1995 | 2000 | 2005 | 2010 | 2015 | ||
| Beijing/ | Population | Medical and health | Socio-economic development | Socio-economic development | |||||
| Shijia- zhuang | Socio-econo- | Investment development | Transpor- | ||||||
| Tangshan | Investment development | Socio-economic development | |||||||
| Qinhuangdao | Investment development | Socio-economic development | Transpor- | ||||||
| Handan | Socio-econo- | Investment development | |||||||
| Xingtai | Socio-economic development | The first industry | Investment development | ||||||
| Baoding | Socio-economic development | Investment | Socio-economic development | ||||||
| Zhang- | Investment development | The first industry | Transportation | ||||||
| Chengde | Transportation | The first industry | Transportation | ||||||
| Cangzhou/ | Socio-economic development | ||||||||
Table 6.
The core driving forces of cities in the Jing-Jin-Ji urban agglomeration
5 Conclusions
Based on the land-use data of six periods (1990, 1995, 2000, 2005, 2010, 2015) of the Jing-Jin-Ji urban agglomeration, this paper has summarized the spatio-temporal evolution patterns of the urban land use, analyzed its expansion intensity, differentiation, morphology, and urbanization characteristics, and further revealed their driving forces by the use of the center of gravity-GTWR model. The main conclusions are as follows:
(1) Between 1990 and 2015, the expansion intensity of the Jing-Jin-Ji urban agglomeration showed a down-up-down trend, confirming
(2) From 1990 to 2015, the development stages of the Jing-Jin-Ji urban agglomeration have showed strong differences and spatial spillover characteristics with the high-speed development center gradually shifting from north to south. Beijing, Tianjin, and other cities in the northern part were the initial dual-core of the urban agglomeration, where the level of development was higher than in the other cities. With the social and economic development moving into a new stage, their speed of development gradually slowed down, while the other cities gradually entered into a high-speed development stage, especially in the dual-core peripheral cities. The spatial spillover effect shifted this influence to the southern part, and the development of the urban agglomeration gradually changed from dual-core to multi-core mode. Population, investment, socio-economic development, and transportation have been strong driving forces on the change of urban development morphology, which complies with the research conclusions of
(3) At present, the development policy orientation of the Jing-Jin-Ji urban agglomeration is of integrated and coordinated development. However, the different core driving forces of the urban agglomeration restrict the improvement of the regional integration level. In order to further enhance the validity and “scientificity” of regional decision-making and promote the coordinated development of the region, the Jing-Jin-Ji urban agglomeration should choose the right spatial development mode and give full play to the respective advantages of the core driving forces of urban characteristics. Between 1990 and 2015, the spatial development of the Jing-Jin-Ji urban agglomeration changed from a dual-core development mode centered on Beijing and Tianjin to a multi-core development mode. With the comprehensive development of the cities, three core groups have appeared in the urban agglomeration: the northern resource transportation core, the central economic development core, and the southern investment development core. Grasping the core driving forces of the different cities, adopting a multi-core functional coordinated development mode, and formulating a coordinated development plan that could give full play to the characteristics and advantages of the cities is of great significance to the integration and coordinated development of the Jing-Jin-Ji urban agglomeration.
(4) In this paper, we used the center of gravity-GTWR model to analyze the urban expansion patterns and their driving forces in the Jing-Jin-Ji urban agglomeration. This model introduces urban spatial interaction through the use of spatio-temporal barycenter transfer, and introduces the temporal dimension through the GTWR model. It not only considers the spatio-temporal nonstationary characteristics by taking the characteristics of time and space as the influencing factors of the regression analysis, but also considers the urban spatial interaction. It combines the analysis of spatio-temporal nonstationarity with urban spatial interaction, and analyzes the urban land expansion as a space-time dynamic system. However, there are still many shortcomings to be studied, such as the parameter ratio settings of the temporal and spatial dimensions, the optimization of the model bandwidth, and the choice of time step unit.
References
[1] M I Aguayo, T Wiegand, G D Azócar et al. Revealing the driving forces of mid-cities urban growth patterns using spatial modeling: A case study of Los Ángeles, Chile. Ecology and Society, 12, 181-194(2007).
[2] V Andreoni, M Duriavig. Economic resilience and land use: The Cocoa Crisis in the Rio Cachoeira Catchment, Brazil. Environmental Policy & Governance, 23, 118-129(2013).
[3] C Bao. Spatio-temporal coupling relationships among urbanization, economic growth and water use change in China. Acta Geographica Sinica, 69, 1799-1809(2014).
[4] Z C Cai, L M He. The application of relevance analysis principle in library and information analysis. Journal of Modern Information, 26, 151-152(2006).
[5] M H Cui. The relationship of coupling coordination between urbanization and ecological environment: A case of urban cluster in the central plains. Economic Geography, 35, 72-78(2015).
[6] C L Fang. Progress and the future direction of research into urban agglomeration in China. Acta Geographica Sinica, 69, 1130-1144(2014).
[7] C L Fang. Theoretical foundation and patterns of coordinated development of the Beijing-Tianjin-Hebei Urban Agglomeration. Progress in Geography, 36, 15-24(2017).
[8] C L Fang, C H Zhou, C L Gu et al. Theoretical analysis of interactive coupled effects between urbanization and eco-environment in mega-urban agglomerations. Acta Geographica Sinica, 71, 531-550(2016).
[9] Z Q Gao, W Yi. Land use change in China and analysis of its driving forces using CLUE-S and dinamica EGO model. Transactions of the Chinese Society of Agricultural Engineering, 28, 208-216(2012).
[10] D A Griffith. Geometry and spatial interaction. Annals of the Association of American Geographers, 72, 332-346(1982).
[11] X L Guan, C L Fang, M Zhou et al. Spatial and temporal characteristics of spatial expansion of urban land in Wuhan urban agglomeration. Journal of Natural Resources, 27, 1447-1459(2012).
[12] S H Guo. Urban land use structure and land use efficiency in Hercynian urban agglomeration. Economic Geography, 37, 170-175(2017).
[13] O Hamdy, S Zhao, T Osman et al. Applying a hybrid model of Markov chain and logistic regression to identify future urban sprawl in Abouelreesh, Aswan: A case study. Geosciences, 6, 1-17(2016).
[14] X H Han, Y H Zhang, F J Sun et al. Method of determining index weight based on principal component analysis. Sichuan Ordnance Journal, 33, 124-126(2012).
[15] M D L L Hernández- Flores, E M Otazo-Sánchez, M Galeana-Pizaña et al. Urban driving forces and megacity expansion threats. Study case in the Mexico City periphery. Habitat International, 64, 109-122(2017).
[16] B Huang, B Wu, Michael Barry. Geographically and temporally weighted regression for modeling spatio-temporal variation in house prices. International Journal of Geographical Information Science, 24, 383-401(2010).
[17] B Kuang, X h Lu, M Zhou et al. Spatio-temporal features of urban land structure change in Wuhan city group and underlying causes. Economic Geography, 36, 71-78(2016).
[18] C X Li, K N Wu, L S Zha. Research on land use change characteristics and driving forces in Beijing, Tianjin and Hebei region. China Population, Resources and Environment, 26, 252-255(2016).
[19] J Li. Fractal dimension of urban spatial morphology and its application. Engineering Journal of Wuhan University, 38, 99-103(2005).
[20] J H Li, W Fang, T Wang et al. Correlations between socioeconomic drivers and indicators of urban expansion: Evidence from the heavily urbanised Shanghai Metropolitan Area, China. Sustainability, 9, 1-13(2017).
[21] J M Li, W Z Zhang, T S Sun et al. Characteristics of clustering and economic performance of urban agglomerations in China. Acta Geographica Sinica, 69, 474-484(2014).
[22] X Li, J Wen, J Lin. Review of research on land urbanization and related studies. Progress in Geography, 31, 1042-1049(2012).
[23] H Liu, H B Deng, X F Li. Research on the spatial and temporal difference of coordinated development between population urbanization and land urbanization in Yangtze River Economic Belt. China Population, Resources and Environment, 26, 160-166(2016).
[24] M Liu, Y M Hu, F Y Sun et al. Application of land use model CLUE-S in the planning of central Liaoning urban agglomerations. Chinese Journal of Ecology, 31, 413-420(2012).
[25] D D Lu. Function orientation and coordinating development of subregions within the Jing-Jin-Ji urban agglomeration. Progress in Geography, 34, 265-270(2015).
[26] S Mubareka, E Koomen, C Estreguil et al. Development of a composite index of urban compactness for land use modelling applications. Landscape & Urban Planning, 103, 303-317(2014).
[27] A Mustafa, M Cools, I Saadi et al. Coupling agent-based, cellular automata and logistic regression into a hybrid urban expansion model (HUEM). Land Use Policy, 69, 529-540(2017).
[28] C Peng, L L Chang. Spatial-temporal pattern of county urbanization and its relationship with economic development in Hunan province. Economic Geography, 33, 73-78(2013).
[29] Jaimes N B Pineda, Sendra J Bosque, Delgado M Gómez et al. Exploring the driving forces behind deforestation in the state of Mexico (Mexico) using geographically weighted regression. Applied Geography, 30, 576-591(2010).
[30] L Salvati, G Venanzoni, P Serra et al. Scattered or polycentric? Untangling urban growth in three southern European metropolitan regions through exploratory spatial data analysis. Annals of Regional Science, 57, 1-29(2016).
[31] H Shafizadeh-Moghadam, M Helbich. Spatiotemporal variability of urban growth factors: A global and local perspective on the megacity of Mumbai. International Journal of Applied Earth Observations & Geoinformation, 35, 187-198(2015).
[32] P Silva, L Li. Mapping urban expansion and exploring its driving forces in the city of Praia, Cape Verde, from 1969 to 2015. Sustainability, 9, 1-21(2017).
[33] N T Son, C R Chen. Urban growth mapping from Landsat data using linear mixture model in Ho Chi Minh City, Vietnam. Journal of Applied Remote Sensing, 6, 100-106(2012).
[34] J P Song, X J Zhao, Q Wang. Analysis of land use change and socioeconomic driving forces of Fengtai District in Beijing. China Population, Resources and Environment, 18, 171-175(2008).
[35] Y Sun, Z Q Liu, Q B Wang et al. Spatial expansion of urban land use and its driving forces in Shenyang city over the past century. Resources Science, 33, 2022-2029(2011).
[36] S H Tan, S X Ni. Discussion on driving forces of regional land use change. Geography and Geo-information Science, 21, 47-50(2005).
[37] E L Ullman. American Commodity Flow(1957).
[38] H J Wang, H X Wang, Y Deng et al. Study on the spatio-temporal pattern and differentiation of rank-size distribution of urban land expansion in Wuhan urban agglomeration. Resources and Environment in the Yangtze Basin, 27, 272-285(2018).
[39] M J Wang. Analysis the change of urban internal spatial structure based on the shift of city gravity in Dalian city. Territory & Natural Resources Study, 4, 1-3(2015).
[40] W Wu, S L Zhou, Y H Wei et al. Modeling spatial determinants of land urbanization in urban fringe. Transactions of the Chinese Society of Agricultural Engineering, 29, 220-228(2013).
[41] H L Xie, B Li. Driving forces analysis of land use pattern changes based on logistic regression model in the farming-pastoral zone: A case study of Ongiud Banner, Inner Mongolia. Geographical Research, 27, 294-303(2008).
[42] M Xie, H Q Yang. Study on Chang-Zhu-Tan’s urbanization construction in the context of “Two Oriented Society”. Journal of Changsha University, 26, 16-18(2012).
[43] L H Xu, L Yang, J L Li et al. Analysis on the driving forces of landscape evolvement of Hangzhou Bay based on GIS-Logistic coupling model. Journal of Applied Oceanography, 35, 75-86(2016).
[44] X L Xu, L G Tong, K D Zheng et al. Spatial-temporal characteristics and scenario prediction of urban expansion in Beijing-Tianjin-Hebei Metropolitan Region. China Population, Resources and Environment, 22, 256-261(2012).
[45] J Y Yang, J H Gao, Y J Shi. Studies on the trend and development of the urbanization of Zhongyuan urban agglomeration: A PIL perspective. China Land Sciences, 28, 59-66(2014).
[46] Y Yang. Research on geographically and temporally weighted regression for spatial and temporal nonstationarity. Wuhan: Wuhan University(2016).
[47] S M Yao, X H Wang, Z G Chen. Strategy problem of new urbanization in big urban agglomeration. Human Geography, 30, 1-5(2015).
[48] J Ye, B L Chen. The application of fractal theory in urban research. Urban Planning Forum, 38-42(2001).
[49] J S Zhao, L Yuan, M Zhang. Driving forces coupling model for multi-scale land use change based on system dynamics. China Land Sciences, 29, 57-66(2015).
[50] W T Zhou, T S Sun. The spatial spillover effect of economic growth in Beijing-Tianjin-Hebei. Journal of Capital University of Economics and Business, 18, 50-58(2016).

Set citation alerts for the article
Please enter your email address
© Copyright 2018-2021 | Chinese Laser Press. All Rights Reserved 沪ICP备15018463号-20