Abstract
Optical microcavities offer a promising platform for highly efficient light–matter interactions. Recently, the combination of microresonators and 2D materials in the nanoscale has further enriched the optoelectronics of microcavity geometries, spurring broad advances including lasers, nonlinear converters, modulators, and sensors. Here, we report the concept of compact dual-laser cogeneration in a graphene-microcavity fiber, which offers a way to cancel the optical common mode noises. Driven by a single 980 nm pump, orthogonally polarized laser lines are generated in a pair of degeneracy breaking modes. The two laser lines produce a heterodyne beat note at 118.96 MHz, with frequency noise down to at 1 MHz offset, demonstrating a linewidth of 930 Hz in vacuum. This compact device enables on-line and label-free gas detection with high resolution, realizing a detection limit on a single pmol/L level, and a capability to quantitatively trace gas–graphene interactions. Such a combination of graphene optoelectronics and microcavity photonics demonstrates a novel physical paradigm for microlaser control and offers a new scheme for in situ chemical sensing.1. INTRODUCTION
By resonantly recirculating light in small volumes, optical microcavities confine photons for a long time with high energy, offering a powerful tool for the unique property to significantly enhance light–matter interactions [1,2]. In recent decades, the vigorous development of microcavity photonics has spurred a broad range of studies including nonlinear optics [3,4], non-Hermitian and chaotic physics [5,6], resonant plasmonics [7,8], quantum dynamics [9,10], and cavity opto-mechanics [11–13]. Such developments also contribute to various applications such as Kerr soliton microcombs [14–16], microlasers [17–19], and, in particular, microsensors [20–22]. Especially for biochemical detection, by combining microcavities with advanced measurement schemes such as mode shifting and splitting [23–25], Stokes soliton heterodyne [26], intracavity Q switching [27], fluorescent interference [28], and parity-time (PT) symmetric breaking [29,30], researchers have found that microcavity sensors demonstrate remarkable sensitivity down to single-molecule level. To overcome the inert nature of conventional microcavity materials (such as silica, fluoride, and silicon nitride), the utilization of emerging material platforms further improves the selectivity and sensitivity of microcavity sensors [31–33]. In spite of the enhancements of material and structure intracavity, the intrinsic frequency noise of the optoelectronic probe signal in sensing operation (with an approximately 1/f-shaped spectral density) imposes an ultimate detection limit for monitoring many paramount processes, such as biological and chemical molecule motions, binding, and trapping [34]. Therefore, for high performance microcavity sensors relying on frequency or phase demodulation, frequency noise canceling (or probe signal linewidth compressing) is a significant but challenging job. To date, much effort has been devoted to suppressing the noise in a microcavity, such as self-referenced mode splitting [24,35], frequency tracking [36,37], and lock-in amplification [38,39], but the common mode noise suppression in a single microresonator chemical sensor without external-cavity equipment auxiliary is still unexplored.
Here we report a low-noise optical sensing scheme for gas detection by using graphene-based microcavity lasers. The assembly of graphene monolayer on an erbium-doped D-shaped optical fiber breaks the symmetry of the optical geometry, forming a pair of orthogonally polarized modes with distinct resonant frequencies. Therefore, by constructing a distributed-Bragg-reflection (DBR) microresonator, we excite a pair of lasers with a frequency offset of 118.96 MHz. When gas molecules are adsorbed on the graphene, the two laser frequencies have the same common mode noise but different responses to external gas molecules. Via simple heterodyne interference, we demonstrate that the linewidth of the dual-laser beat note reaches 930 Hz ( of the laser linewidth), suggesting a frequency noise down to . This offers a powerful tool to detect polar gases such as ammonia () with detection limit down to 2 pmol/L in vacuum and 0.01 parts-per-billion in air. Taking advantage of the direct lock-in amplifying method, the all-in-fiber microcavity sensor provides a way towards studying on-line gas–graphene interactions.
2. RESULTS
Figure 1(a) shows the conceptual design of the dual-laser coexcitation in our graphene-based active fiber microcavity, in which the laser frequencies of the two fundamental modes with orthogonal polarizations would shift distinctly when gas molecules are adsorbed on the graphene. In the experiment, we use a section of standard single-mode erbium-doped fiber (6 μm core diameter, 125 μm cladding diameter). For laser generation around 1550 nm, we use a pair of Bragg reflectors (reflection bandwidth 120 GHz, reflection ratio ) to form a DBR microcavity [, typical free-spectral-range ]. In order to realize the evanescent wave coupling between transmitting lightwave and graphene, we side-polish the erbium fiber to a D-shaped geometry, whose polishing depth is . Monolayer graphene is deposited on the side-polished fiber section via the wet-transfer technique [40]. The effective area for light–graphene interaction is . When gas molecules are adsorbed on the graphene, the carrier transport effect will change the group indices of the intracavity modes, inducing distinct laser frequency shifts. Figure 1(b) shows the device microscopic pictures (top view) of our device. The top panel illustrates that when injecting a 980 nm pump laser in, the energy upconversion of the erbium ions scatters green light. Besides, the bottom panel shows that the graphene (the black shadows) deposited on the D-shaped fiber is obvious. Figure 1(c) presents the front view scanning-electron-microscopic image of our D-shaped fiber, verifying that the side-polished depth reaches the fiber core region. In Fig. 1(d), we characterize the quality of the graphene monolayer by using in situ Raman spectroscopy (spatial resolution 10 μm). Here the two colored maps demonstrate the G peak (at ) and the 2D peak (at ) intensities; the measured area is boxed out in Fig. 1(b). In this region, both the G peak and the 2D peak seem uniform, and the G/2D intensity ratio is , suggesting the good quality of the graphene coverage [41]. We also note that the graphene on fiber may have several defects since the transferring process may bring wrinkles and cracks, but the defects would not deteriorate the sensing performance of such an all-optical device.
Sign up for Photonics Research TOC. Get the latest issue of Photonics Research delivered right to you!Sign up now
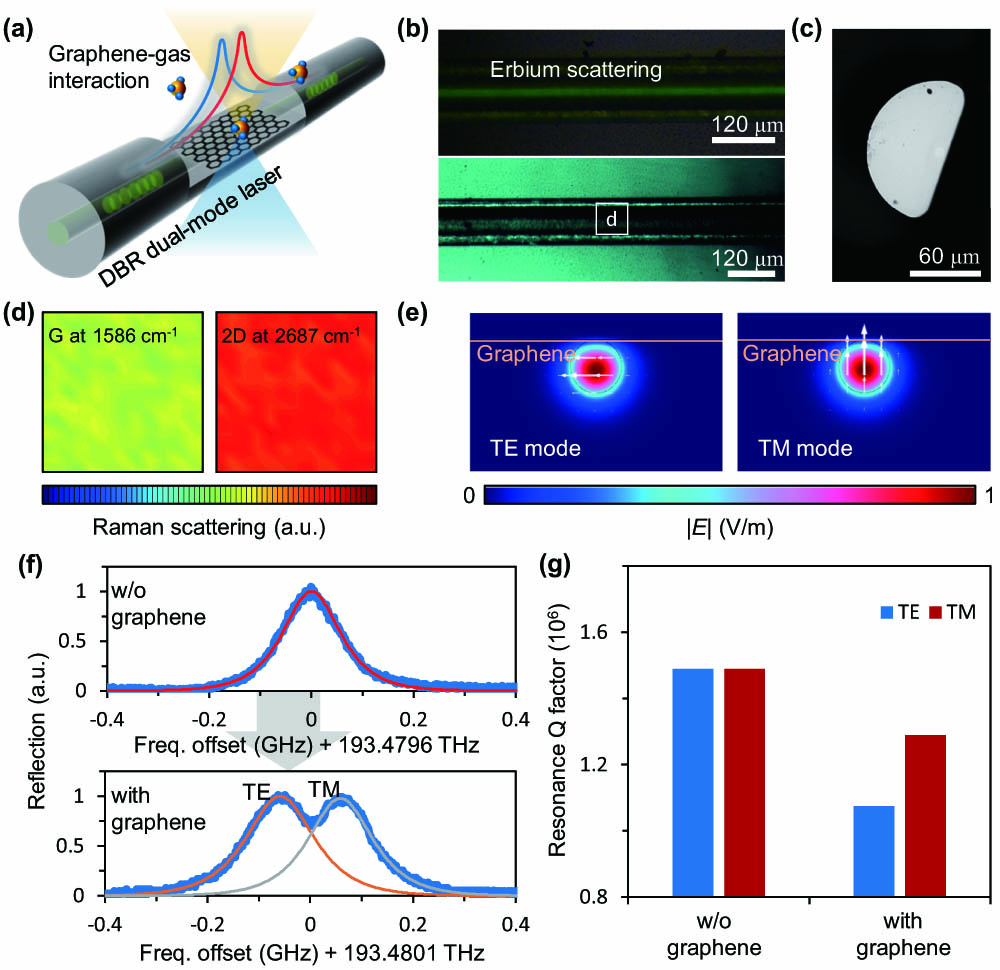
Figure 1.Conceptual design of the dual-laser sensor based on a graphene D-shaped fiber DBR microcavity. (a) Schematic diagram of the device; graphene is deposited on the D-shaped region of an erbium-doped fiber section, and two Bragg gratings provide high reflection. Gas adsorption on graphene would change the laser frequencies (blue and red curves) distinctly. (b) Optical microscopic images of the graphene-based fiber microcavity. Here the bright green scattering is due to the erbium excitation. (c) Scanning electron microscopic image of the D-shaped fiber, in front view. (d) In situ Raman spectroscopic maps, for the G peak and the 2D peak of the graphene on fiber. Color bar: intensity. (e) Simulated optical mode fields. The left panel and the right panel show the electrical field distributions in TE and TM polarization. The color bar is normalized. (f) Measured resonances of the D-shaped fiber DBR microcavity around 1550 nm; here the red, orange, and gray curves are fittings. (g) factors of the resonant modes before and after graphene deposition.
In Fig. 1(e), we demonstrated the simulated electrical field distributions of the mode and the mode propagating along the graphene-based D-shaped fiber, in the sectional view. The optical frequency is 193.48 THz (C band); the material refractive index of the fiber core, fiber cladding, and graphene monolayer (thickness 0.4 nm) is 1.462, 1.446, and . Since the graphene coverage intensifies the asymmetry of the structure in the directions from top to bottom, the group indices of the modes in TE polarization () and TM polarization () would be different. Specifically, , while . As a result, resonances in the TE and the TM polarizations would divide in the spectrum, as they now demonstrate two slightly different FSRs. Figure 1(f) plots the measured resonances at 193.48 THz for the D-shaped fiber DBR microcavity before and after graphene deposition. When without graphene coverage, the TE- and the TM-polarized modes are degenerated; thus one can only see one single resonance peak, whose linewidth is in fitting. After graphene coverage, one can see two separated resonances (offset 118.96 MHz) when measured by an obliquely-polarized scanning laser. Via fitting, linewidths of the TE resonance and the TM resonance become 180 MHz and 150 MHz, respectively. It is expectable that when laser excitation appears in the two resonances, the two lasers would generate a beat note at 118.96 MHz in a photodetector. Figure 1(g) compares the factors of the two modes before and after graphene deposition. By optimizing the graphene induced intrinsic loss, factors of the TE resonance and the TM resonance keep on and .
Figure 2(a) plots the “pump-laser” power correlation. Since the microcavity is erbium doped, we can use a 980 nm laser to excite microlasers. By increasing the pump power (), we observe different laser states subsequently. First, when the reaches 36 mW, a 1550 nm band laser grows up from the amplified spontaneous emission (ASE) background. After the mode competition state, the TM mode laser is generated first, because its resonant factor is higher than that of the TE mode. Then, when the reaches 54 mW, the TE-polarized laser begins to appear. Limited by the cavity length, the erbium gain would be saturated when the is higher than 68 mW. Our device works as a standard dual-laser system in this region. Moreover, referring to the cavity , we can control the total intracavity power density , below the graphene-based saturable absorption threshold; thus we would not see temporal oscillations such as mode locking [42,43].

Figure 2.Excitation of the orthogonally polarized dual lasers. (a) Correlation of the 980 nm pump power and the total laser power. Laser threshold, 36 mW; dual-laser threshold, 54 mW. (b) Polarization of the laser states. Left panel: for , the laser is only in the TM polarization. Right panel: for , there are two lasers; one is in the TM polarization, while the other one is in the TE polarization. (c) Laser spectra for distinct pump powers. (d) Low-frequency beat notes of the microcavity laser device.
Figure 2(b) verifies that the dual lasers are in orthogonal polarization. By using a polarizer, we map the laser power in the polarization map. The left panel shows the case in which is in the range of 40–50 mW. Here one can only see the TM-polarized (vertical) power. On the other hand, when is in the range of 50–70 mW, both TM-polarized and TE-polarized lasers are detectable. In these two panels, the laser power is normalized. In Fig. 2(c), we characterize the laser spectra under different pump powers. Here we use a high-resolution optical spectrometer with a sampling rate of 1 pm. When , there is no laser excitation, and the small peaks demonstrate unstable ASE. When , we can see one laser peak, located at 1550.5458 nm, with peak power , belonging to the TM resonance. When , two laser peaks appear. The wavelengths of them are 1550.5462 nm and 1550.5472 nm, suggesting a frequency difference . For further identifying the dual-laser generation, we record their low-frequency beat note in Fig. 2(d). For the cases “below laser threshold” and “single frequency laser excitation,” the dual-laser coexistence enables a beat signal at 118.96 MHz in the radio frequency domain.
Figure 3(a) schematically sketches how the optical common mode noise of the TE-/TM-polarized dual lasers is canceled in their heterodyne beat signal. Low-frequency noise of a laser determines its linewidth, typically obeying the spectral density [44], where is the frequency offset and is the order number. The noises are induced by flicker, quantum fluctuation physically, or thermal instability and spatial vibrations technically. Generally, the uncertainty of the cavity FSR is a major factor determining the . In our dual-laser microcavity, the environmental uncertainty induced cavity fluctuation changes the absolute frequency of each laser line ( and ), but the relative frequency difference of the two lasers would be much more stable, written in . Researchers usually call this effect common mode noise cancellation [45]. Through dual-laser heterodyne beating, we can obtain an electrical signal at with much narrower linewidth, or higher stability. When a very weak sensing response occurs, the in the radio frequency band demonstrates much higher spectral resolution than the lasers in the optical band. In the technique, the sensing method based on the two lasers beating is similar to the scheme using laser mode splitting [25,35]. A heterodyne signal of the splitting modes generated in the same cavity can also cancel the common noise, and thus obtain ultrahigh sensitivity. In the mechanism, laser-splitting-based biochemical detection relies on the measurement of the scattering permittivity [46], which is more suitable for operation in WGM cavities, and can demonstrate remarkable advantages in virus or nanoparticle detection. Meanwhile, in this work, the frequency of the beat note originating from two distinct modes exhibits higher sensitivity to the group index difference, which is more suitable for gas detection on the in-fiber platform.
Figure 3.Dual-laser beat note with suppressed common mode noise. (a) Schematic mechanism of the common mode noise cancelation. (b) Setup for verifying that noise of the dual-laser beat is lower than that of independent lasers. LD, laser diode; PD, photodetector; OSA, optical spectrum analyzer; ESA, electrical spectrum analyzer. (c) Optical spectrum containing the microcavity dual lasers and the reference laser. (d) Measured RF spectrum; the fitting curves are in shape. (e) Linewidth of the beat notes. (f) Frequency noise of the TE and TM laser beat signal. Gray dashed line, -line; blue dotted line, white noise; green dotted line, flicker noise.
For verifying the noise suppression performance of our dual-laser device, we build an external laser-reference setup, as shown in Fig. 3(b). A 980 nm diode pumps the graphene D-shaped fiber microcavity (GDMC), which generates two lasers in a pair of closed resonances. Then we couple the laser outputs with a reference laser (NKT E15, typical linewidth 200 Hz), measuring the optical spectrum in an optical spectrometer (Yokogawa 6370D) and the beat notes in an electrical spectral analyzer (R&S FSW43). Figure 3(c) plots the spectrum in the range 1550.3–1550.7 nm. Typically, the TE mode laser is generated at 1550.5462 nm, while the TM mode laser is generated at 1550.5472 nm. We tune the reference laser frequency between them. But limited by the resolution of the spectrometer (minimum 2 GHz), one cannot divide the TE-polarized laser line, the TM-polarized laser line, and the reference laser.
Figure 3(d) shows the measured spectrum in radio frequency domain. By using a low-noise photodetector, we can find three beat notes. Starting from zero frequency, the first two beat notes come from the beats of “ and reference” and “ and reference,” and they reflect the true linewidths of the TE and TM lasers. The third one is the intracavity dual-laser beat signal, which locates at 118.96 MHz, demonstrating the accurate frequency difference between the two lasers. By using fitting curves, we mark the linewidth of the two intracavity lasers at about 2.3 and 1.6 MHz. By zooming the “ and ” beat in, we note that its linewidth approaches 930 Hz, three orders smaller than the laser linewidth. In Fig. 3(e), we summarize this result. Typically, the linewidth of a two-laser-line beat note is determined by their coherence [47]. For instance, the beat linewidth of a phase-locked frequency comb could be very narrow, e.g., at hertz level [48]. In our device, the linewidth of the TE and TM lasers is at single megahertz level, hugely limited by the cavity factor. A wider passive resonance linewidth (corresponding to a low ) brings higher white noise. Besides, flicker noises are induced by the fluctuations from different sources such as the laser cavity, the pump, and the electronics. The common noise is mainly caused by the cavity fluctuations. In our measurement, the “ and ” beat linewidth (approaching 1 kHz) is mainly limited by the white noise and the flicker noise coming from the pump and the electronics.
In Fig. 3(f), we show the single sideband frequency noise of the “ and ” beat signal. Frequency noise density is written in , where is the frequency offset. Noises in a laser system largely consist of the flicker noise (in fitting) and the white noise (in fitting) [49]. When the frequency offset is higher than 10 kHz, the white-noise-limited frequency noise is , marked by the blue dotted line. Now we analyze the beat linewidth. For ultranarrow linewidth identification, the -line is a commonly used tool. It is defined as . This line divides the frequency noise spectrum into two regions. When , the noises would broaden the linewidth. One can obtain the linewidth of the beat signal by using the simple approximation full width at half-maximum (FWHM) of . Here A is the area when . Typically, one can define a measurement time before the intersection point of the and the -line. For a measurement time of 10 ms (counting interval , marked by the green dotted line), the noise determined linewidth is 926 Hz, meeting the RF measurement.
Figure 4(a) demonstrates the process when we use the dual-laser microcavity for gas detection. Originally, the dual-laser frequency difference is . Once gas molecules are adsorbed on graphene, the electrical bonding changes the group indices of the TE mode and the TM mode distinctly. Thus, the resonant frequency shift of the TE laser mode and the TM laser mode could be different. This leads to a frequency change of their beat note. In the experiment, we fix the laser sensor device in a tightly sealed gas chamber, with a volume of 8 L. By injecting gas into this chamber with different concentrations, we record the frequency shift of the dual-laser beat signal. This effect is determined by the Fermi level change of the intracavity graphene, and can also be obtained by electrically doping the graphene [39].
Figure 4.Measured results of the gas detection in vacuum. (a) Principle of the gas sensing in our graphene-based microfiber laser cavity. (b) and (c) Measured spectrum and the “concentration–frequency shift” correlation of the dual-laser beat signal, when injecting with concentration from 0.446 to 4464 nmol/L. (d) and (e) Measured spectrum and the “concentration–frequency shift” correlation of the dual-laser beat signal. Horizontal error bars, uncertainty of the gas concentration; vertical error bars, measurement uncertainty limited by the signal linewidth (930 Hz). (f) and (g) Measured spectrum and the ‘concentration–frequency shift’ correlation of the “ and reference” beat signal. Vertical error bars, measurement uncertainty limited by the signal linewidth (2.3 MHz).
When increasing the concentration from 0.446 to 4464 nmol/L in vacuum, we demonstrate the measured spectra in Fig. 4(b). The central frequency of the dual-laser beat blue-shifts from 118.96 to 119.66 MHz. We plot this trend in Fig. 4(c). When the concentration is lower than 200 nmol/L, the correlation of the frequency shift and the concentration approximately increases in the log scale. But when the concentration is too high, gas absorption on graphene would be saturated. This suggests that the measurement range of our microsensor is 0–200 nmol/L. Then we check the optical response when the injected concentration is very low (). When injecting gas with concentrations 2.23 and 4.46 pmol/L, we see the spectral shift of the beat signal is 0.626 and 2.035 kHz. Obviously, the response is nonlinear, as shown in Fig. 4(d). In Fig. 4(e), we plot more cases. In this panel, the horizontal error bars mark the uncertainty of the gas concentration (), while the vertical error bars show the resolution limit due to the linewidth-based frequency noise (). In a nutshell, by measuring the gas induced spectral shift in an RF spectrometer, the detection limit of our laser sensor approaches 2 pmol/L.
In comparison, we test the sensing performance without using the noise canceled mechanism. In the experiment, one can measure the frequency shifts of the “ and reference” beat note, for instance. Figure 4(f) plots the zoomed-in beat spectrum of the “ and reference” beat note when the injecting gas concentration is 0, 44.6, and 89.2 pmol/L. We obtain a result in which the absolute spectral shift of the signal reaches . But limited by the signal linewidth without noise canceling, one cannot resolve the peak position accurately. Figure 4(g) shows the correlation between the concentration and the spectral shift of the “ and reference” beat. Here the vertical error bars show the linewidth-based resolution uncertainty (). In this case, when measuring the frequency shift of a single laser without noise canceling, the detection limit is .
Besides working in vacuum, this laser sensor is also applicable to detect gas in the ambient environments, such as in the air. Figure 5(a) shows the “ and ” beat note in the air, whose central frequency is 85.321 MHz, with a linewidth of 1.7 kHz. Such a linewidth in the air is wider than in vacuum, mainly due to the instability of the airflow, temperature, and atmospheric pressure. Typically, the air does not contain . When injecting into the gas chamber, Fig. 5(b) shows the measured spectra of the “ and ” beat note. Here we increase the concentration from 0 to 1000 ppb (parts per billion). The central frequency of the dual-laser beat blue-shifts from 85.321 to 85.404 MHz. In Fig. 5(c), we demonstrate the concentration–frequency correlation. Similar to the case in vacuum, the beat frequency increases with concentration in the log scale. When the concentration is too high (), the gas–graphene interaction would become unstable. Hence for in-air application, the measurement range of our device is 0–10,000 ppb. Now we consider the detection limit. Figure 5(d) shows the beat note in the spectrum when the laser sensor is exposed to the air, with concentrations 0, 0.1, and 0.3 ppb. The measured central frequency of the beat note is 85.321 MHz, 85.325 MHz, and 85.331 MHz, respectively. In Fig. 5(e), we show more measured results. When the concentration is below 0.01 ppb, the response is not obvious. Besides, since the linewidth of the beat note is 1.7 kHz, to accurately distinguish the spectral shift, at least is essential. Thus, we estimate that the detection limit for sensing in the air reaches 0.01 ppb. In this panel, the horizontal error bars represent the uncertainty of gas concentration (), while the vertical error bars show the linewidth-limited resolution uncertainty ().
Figure 5.Measured results of the gas detection in air. (a) Spectrum of the “ and ” beat note in the air. (b) and (c) Measured spectrum and the “concentration–frequency shift” correlation of the dual-laser beat signal, when increasing the concentration from 0 to 1000 ppb. (d) and (e) Detailed spectrum and the “concentration–frequency shift” correlation. Horizontal error bars, uncertainty of the gas concentration; vertical error bars, measurement uncertainty ().
3. DISCUSSION
Figure 6 discusses the performance of the device in gas detection applications. First, Fig. 6(a) shows the recoverability and response time of the sensor. In this measurement, we inject and bleed gas samples with distinct concentrations, meanwhile monitoring the frequency shifts of the beat note. The speed of the gas charging/discharging is kept at , and the in-chamber temperature is kept at 290 K stably. When the in-chamber concentration of gas periodically changes from 0 to 44.64 nmol/L, the dual-laser beat frequency is modified from 0 to 0.7 MHz, meeting the results shown in Fig. 4. The recoverability of the device approaches . A typical response/recovery time of the laser sensor for detection is , which is largely determined by the gas–graphene interaction velocity. When the injected gas concentration is lower, the response delay will be smaller. When we set the concentration in the chamber (0 nmol/L, 2.23 pmol/L, and 4.46 pmol/L), the response delay (from stable to stable) could be less than 50 s.
Figure 6.Recoverability and capability for tracing gas–graphene interactions. (a) Blue curve, recoverable frequency shift in periodically injected gas, with concentration 0–44.64 nmol/L; red curve, high-resolution frequency shift when increasing the concentration from 0 to 2.23 and 4.46 pmol/L. (b) Lock-in amplified trace and its derivation when keeping the sensor in 4.46 pmol/L environment stably. (c) Histograms of the lock-in intensity change.
Now we explore the device’s potential for tracing the gas–graphene interactions on-line. Referring to the gas kinetic theory [50], the number of gas bonding on graphene per second could be written in , where is the effective area of graphene, is the gas concentration, is the Boltzmann’s constant, is the in-chamber temperature, is the gas molecular mass (for , ), and is the ratio of the bonding efficiency. In our experiment, 4.46 pmol/L gas in the chamber suggests that the total gas molecule number is . Typically, in our experiment, is in the level. On average, there would be 8 molecules bonding on graphene per second. Typically, graphene on silica fiber is naturally -doped (hole dominant) with a Fermi level of about 0.2 eV [39]. Each single gas molecule adsorbed on graphene contributes two electrons to the graphene (or fills two holes) [51]. For the TE and TM orthogonal mode pair, a level group index change enables their FSR difference to increase . Therefore, the beat note of the laser pair would increase in approximation. Such a small frequency shift cannot be well seen in an RF analyzer. We place the microlaser sensor in the gas with a concentration of 4.46 pmol/L and keep it static, and then we monitor the lock-in amplified trace by using a reference frequency of 119.14 MHz. Figure 6(c) demonstrates the amplified heterodyne trace. There are 13 on/off cases inside. Via derivation analysis, we provide a detailed illustration of the steps involved in studying the interactions between gas molecules and graphene. The unit step of the intensity change is 100 a.u/s. The case statistics are shown in Fig. 6(d). The results are basically consistent with the power law distribution.
4. CONCLUSION
In summary, we demonstrate the cogeneration of a laser pair from orthogonally polarized mode families, in a graphene-based D-shaped and erbium-doped fiber DBR microcavity. These two independent laser lines have a frequency offset of 118.96 MHz, and they have distinct sensitivities to the gas–graphene interaction. Self-heterodyne beat of this laser device enables remarkable common noise suppression, showing an electrical linewidth down to 930 Hz (more than three orders smaller than the laser linewidth) in vacuum, with frequency noise density at 1 MHz offset. Since the intracavity graphene enables distinct sensitivity of the two laser modes, our method provides an ingenious way to measure the gas–graphene interaction induced beat frequency shift in high resolution. Via spectral demodulation, it achieves a detection limit for gas down to 2 pmol/L in vacuum and 0.01 ppb in air. By using the heterodyne lock-in scheme, this device also demonstrates the potential for tracing the graphene–gas interactions on-line. Since graphene is sensitive to sorts of polar gases besides , our microlaser sensor is also applicable for detecting other gas components with polar bonds such as , , and . This scheme not only demonstrates a new paradigm for orthogonally polarized dual-laser control in one microcavity, but also paves a way to realize a label-free, low-power-consumption, and simple-operation tool to realize quantitative gas molecule measurement.
References
[1] K. J. Vahala. Optical microcavities. Nature, 424, 839-846(2003).
[2] Y.-F. Xiao, F. Vollmer. Special Issue on the 60th anniversary of the first laser—Series I: Microcavity Photonics—from fundamentals to applications. Light Sci. Appl., 10, 141(2021).
[3] G. Lin, A. Coillet, Y. K. Chembo. Nonlinear photonics with high-Q whispering-gallery-mode resonators. Adv. Opt. Photon., 9, 828(2017).
[4] X. Zhang, Q.-T. Cao, Z. Wang, Y. Liu, C.-W. Qiu, L. Yang, Q. Gong, Y.-F. Xiao. Symmetry-breaking-induced nonlinear optics at a microcavity surface. Nat. Photonics, 13, 21-24(2019).
[5] H. Cao, J. Wiersig. Dielectric microcavities: Model systems for wave chaos and non-Hermitian physics. Rev. Mod. Phys., 87, 61-111(2015).
[6] H. G. Song, M. Choi, K. Y. Woo, C. H. Park, Y.-H. Cho. Room-temperature polaritonic non-Hermitian system with single microcavity. Nat. Photonics, 15, 582-587(2021).
[7] R. Ameling, H. Giessen. Microcavity plasmonics: strong coupling of photonic cavities and plasmons. Laser Photon. Rev., 7, 141-169(2013).
[8] P. Peng, Y.-C. Liu, D. Xu, Q.-T. Cao, G. Lu, Q. Gong, Y.-F. Xiao. Enhancing coherent light-matter interactions through microcavity-engineered plasmonic resonances. Phys. Rev. Lett., 119, 233901(2017).
[9] D. Najer, I. Söllner, P. Sekatski, V. Dolique, M. C. Löbl, D. Riedel, R. Schott, S. Starosielec, S. R. Valentin, A. D. Wieck, N. Sangouard, A. Ludwig, R. J. Warburton. A gated quantum dot strongly coupled to an optical microcavity. Nature, 575, 622-627(2019).
[10] Y.-K. Lu, P. Peng, Q.-T. Cao, D. Xu, J. Wiersig, Q. Gong, Y.-F. Xiao. Spontaneous T-symmetry breaking and exceptional points in cavity quantum electrodynamics systems. Sci. Bull., 63, 1096-1100(2018).
[11] M. Aspelmeyer, T. J. Kippenberg, F. Marquardt. Cavity optomechanics. Rev. Mod. Phys., 86, 1391-1452(2014).
[12] J. Zhang, B. Peng, S. Kim, F. Monifi, X. Jiang, Y. Li, P. Yu, L. Liu, Y. Liu, A. Alù, L. Yang. Optomechanical dissipative solitons. Nature, 600, 75-80(2021).
[13] B. Yao, C. Yu, Y. Wu, S.-W. Huang, H. Wu, Y. Gong, Y. Chen, Y. Li, C. W. Wong, X. Fan, Y. Rao. Graphene-enhanced Brillouin optomechanical microresonator for ultrasensitive gas detection. Nano Lett., 17, 4996-5002(2017).
[14] T. J. Kippenberg, A. L. Gaeta, M. Lipson, M. L. Gorodetsky. Dissipative Kerr solitons in optical microresonators. Science, 361, eaan8083(2018).
[15] L. Chang, S. Liu, J. E. Bowers. Integrated optical frequency comb technologies. Nat. Photonics, 16, 95-108(2022).
[16] C. Qin, J. Du, T. Tan, B. Chang, K. Jia, Y. Liang, W. Wang, Y. Guo, H. Xia, S. Zhu, Y. Rao, Z. Xie, B. Yao. Co-generation of orthogonal soliton pair in a monolithic fiber resonator with mechanical tunability. Laser Photon. Rev., 17, 2200662(2023).
[17] L. He, Ş. K. Özdemir, L. Yang. Whispering gallery microcavity lasers. Laser Photon. Rev., 7, 60-82(2013).
[18] J. Zhang, B. Peng, Ş. K. Özdemir, K. Pichler, D. O. Krimer, G. Zhao, F. Nori, Y. Liu, S. Rotter, L. Yang. A phonon laser operating at an exceptional point. Nat. Photonics, 12, 479-484(2018).
[19] C. Qin, K. Jia, Q. Li, T. Tan, X. Wang, Y. Guo, S.-W. Huang, Y. Liu, S. Zhu, Z. Xie, Y. Rao, B. Yao. Electrically controllable laser frequency combs in graphene-fibre microresonators. Light Sci. Appl., 9, 185(2020).
[20] M. R. Foreman, J. D. Swaim, F. Vollmer. Whispering gallery mode sensors. Adv. Opt. Photonics, 7, 168-204(2015).
[21] Y. Zhi, X.-C. Yu, Q. Gong, L. Yang, Y.-F. Xiao. Single nanoparticle detection using optical microcavities. Adv. Mater., 29, 1604920(2017).
[22] N. Toropov, F. Vollmer. Whispering-gallery microlasers for cell tagging and barcoding: the prospects for in vivo biosensing. Light Sci. Appl., 10, 77(2021).
[23] V. R. Dantham, S. Holler, C. Barbre, D. Keng, V. Kolchenko, S. Arnold. Label-free detection of single protein using a nanoplasmonic-photonic hybrid microcavity. Nano Lett., 13, 3347-3351(2013).
[24] B. B. Li, W. R. Clements, X. C. Yu, K. Shi, Q. Gong, Y. F. Xiao, O. J. Painter. Single nanoparticle detection using split-mode microcavity Raman lasers. Proc. Natl. Acad. Sci. USA, 111, 14657-14662(2014).
[25] Y. Guo, Z. Li, N. An, Y. Guo, Y. Wang, Y. Yuan, H. Zhang, T. Tan, C. Wu, B. Peng, G. Soavi, Y. Rao, B. Yao. A monolithic graphene functionalized microlaser for multispecies gas detection. Adv. Mater., 34, 2207777(2022).
[26] T. Tan, Z. Yuan, H. Zhang, G. Yan, S. Zhou, N. An, B. Peng, G. Soavi, Y. Rao, B. Yao. Multispecies and individual gas molecule detection using Stokes solitons in a graphene over-modal microresonator. Nat. Commun., 12, 6716(2021).
[27] Y. Guo, N. An, K. Guo, Y. Li, Y. Liang, C. Wu, Y. Wang, J. He, Y. Wang, T. Tan, Y. Rao, B. Yao. Gas detection in a graphene based dual-mode fiber laser microcavity. Sens. Actuators B Chem., 348, 130694(2021).
[28] Z. Cao, B. Yao, C. Qin, R. Yang, Y. Guo, Y. Zhang, Y. Wu, L. Bi, Y. Chen, Z. Xie, G. Peng, S. W. Huang, C. W. Wong, Y. Rao. Biochemical sensing in graphene-enhanced microfiber resonators with individual molecule sensitivity and selectivity. Light Sci. Appl., 8, 4(2019).
[29] W. Chen, Ş. Kaya Özdemir, G. Zhao, J. Wiersig, L. Yang. Exceptional points enhance sensing in an optical microcavity. Nature, 548, 192-196(2017).
[30] W. Chen, J. Zhang, B. Peng, Ş. K. Özdemir, X. Fan, L. Yang. Parity-time-symmetric whispering-gallery mode nanoparticle sensor [Invited]. Photon. Res., 6, A23-A30(2018).
[31] J. Liu, F. Bo, L. Chang, C.-H. Dong, X. Ou, B. Regan, X. Shen, Q. Song, B. Yao, W. Zhang, C.-L. Zou, Y.-F. Xiao. Emerging material platforms for integrated microcavity photonics. Sci. China Phys. Mech. Astron., 65, 104201(2022).
[32] T. Tan, X. Jiang, C. Wang, B. Yao, H. Zhang. 2D material optoelectronics for information functional device applications: status and challenges. Adv. Sci., 7, 2000058(2020).
[33] N. An, C. Qin, Y. Li, T. Tan, Z. Yuan, H. Zhang, Y. Wu, B. Yao, Y. Rao. Graphene-fiber biochemical sensors: principles, implementations, and advances. Photon. Sens., 11, 123-139(2021).
[34] M. Jin, S.-J. Tang, J.-H. Chen, X.-C. Yu, H. Shu, Y. Tao, A. K. Chen, Q. Gong, X. Wang, Y.-F. Xiao. 1/f-noise-free optical sensing with an integrated heterodyne interferometer. Nat. Commun., 12, 1973(2021).
[35] L. He, Ş. K. Özdemir, J. Zhu, W. Kim, L. Yang. Detecting single viruses and nanoparticles using whispering gallery microlasers. Nat. Nanotechnol., 6, 428-432(2011).
[36] J. Su, A. F. Goldberg, B. M. Stoltz. Label-free detection of single nanoparticles and biological molecules using microtoroid optical resonators. Light Sci. Appl., 5, e16001(2016).
[37] S. Vincent, S. Subramanian, F. Vollmer. Optoplasmonic characterisation of reversible disulfide interactions at single thiol sites in the attomolar regime. Nat. Commun., 11, 2043(2020).
[38] N. P. Mauranyapin, L. S. Madsen, M. A. Taylor, M. Waleed, W. P. Bowen. Evanescent single-molecule biosensing with quantum-limited precision. Nat. Photonics, 11, 477-481(2017).
[39] N. An, T. Tan, Z. Peng, C. Qin, Z. Yuan, L. Bi, C. Liao, Y. Wang, Y. Rao, G. Soavi, B. Yao. Electrically tunable four-wave-mixing in graphene heterogeneous fiber for individual gas molecule detection. Nano Lett., 20, 6473-6480(2020).
[40] B. Yao, S.-W. Huang, Y. Liu, A. K. Vinod, C. Choi, M. Hoff, Y. Li, M. Yu, Z. Feng, D.-L. Kwong, Y. Huang, Y. Rao, X. Duan, C. W. Wong. Gate-tunable frequency combs in graphene–nitride microresonators. Nature, 558, 410-414(2018).
[41] A. C. Ferrari, D. M. Basko. Raman spectroscopy as a versatile tool for studying the properties of graphene. Nat. Nanotechnol., 8, 235-246(2013).
[42] A. Marini, J. D. Cox, F. J. García De Abajo. Theory of graphene saturable absorption. Phys. Rev. B, 95, 125408(2017).
[43] A. Martinez, Z. Sun. Nanotube and graphene saturable absorbers for fibre lasers. Nat. Photonics, 7, 842-845(2013).
[44] A. A. Balandin. Low-frequency 1/f noise in graphene devices. Nat. Nanotechnol., 8, 549-555(2013).
[45] A. Heidmann, R. J. Horowicz, S. Reynaud, E. Giacobino, C. Fabre, G. Camy. Observation of quantum noise reduction on twin laser beams. Phys. Rev. Lett., 59, 2555-2557(1987).
[46] A. Mazzei, S. Götzinger, D. S. Menezes, G. Zumofen, O. Benson, V. Sandoghdar. Controlled coupling of counterpropagating whispering-gallery modes by a single Rayleigh scatterer: a classical problem in a quantum optical light. Phys. Rev. Lett., 99, 173603(2007).
[47] S. Camatel, V. Ferrero. Narrow linewidth CW laser phase noise characterization methods for coherent transmission system applications. J. Lightwave Technol., 26, 3048-3055(2008).
[48] H. Zhang, T. Tan, H.-J. Chen, Y. Yu, W. Wang, B. Chang, Y. Liang, Y. Guo, H. Zhou, H. Xia, Q. Gong, C. W. Wong, Y. Rao, Y.-F. Xiao, B. Yao. Soliton microcombs multiplexing using intracavity-stimulated Brillouin lasers. Phys. Rev. Lett., 130, 153802(2023).
[49] G. Di Domenico, S. Schilt, P. Thomann. Simple approach to the relation between laser frequency noise and laser line shape. Appl. Opt., 49, 4801-4807(2010).
[50] S. Kumar, Y. Pramudya, K. Müller, A. Chandresh, S. Dehm, S. Heidrich, A. Fediai, D. Parmar, D. Perera, M. Rommel, L. Heinke, W. Wenzel, C. Wöll, R. Krupke. Sensing molecules with metal–organic framework functionalized graphene transistors. Adv. Mater., 33, 2103316(2021).
[51] F. Schedin, A. K. Geim, S. V. Morozov, E. W. Hill, P. Blake, M. I. Katsnelson, K. S. Novoselov. Detection of individual gas molecules adsorbed on graphene. Nat. Mater., 6, 652-655(2007).


