The Cramer–Rao lower bound on range error is modeled for pseudo-random ranging systems using Geiger-mode avalanche photodiodes. The theoretical results are shown to agree with the Monte Carlo simulation, satisfying boundary evaluations. Experimental tests prove that range errors caused by the fluctuation of the number of photon counts in the laser echo pulse leads to the range drift of the time point spread function. The function relationship between the range error and the photon counting ratio is determined by using numerical fitting. Range errors due to a different echo energy is calibrated so that the corrected range root mean square error is improved to 1 cm.
Time-correlated photon counting is an established technique for time of flight (TOF) over distances of several tens of kilometers in remote sensing[1–6]. Combined with sending the pseudo-random code, the maximum absolute range that can be measured and the count rate leading to long exposure or dwell times is not limited by the system[1,4]. Recently, the employed peak finder[1–5] and center mass method[5,7] are the most common methods to determine the range of the time point spread function (TPSF)[8,9] or the correlation function. However, the range uncertainty in the measurement is limited by the jitter of the system, in particular, the range walk error[10,11]. The problem is exacerbated by solar background noise, which reduces the signal-to-noise and broadens the TPSF. Several authors discussed the optical power effect on the pseudo-random spread spectrum photon counting system (PSSPCS)[6,12], and pointed out that the range accuracy[6,12,13] has a finite nonzero value even in the case of vanishing noise due to the random nature of the signal photon detection process, which means that the signal power has a major influence on range error:
However, in both, the presented Eqs. (1) and (2) in Refs. [6,12] prove that the increased signal power obviously minimizes the range error. The energy and waveform of the laser echo pulse will cause degradation in range accuracy, which is called the range walk error or the time walk effect[14,15]. This fact has not been taken into account in the pseudo-random detection theory model. Although some theoretical analysis of performance, such as range error, has been reported over many years[6,12], it lacks the introduction of the time walk effect into the theory model, making them become problematic in the range error evaluation of PSSPCS detection. He et al. discussed the time walk effect in sending periodic pulses to the Ladar system[16]. In the same way, the time walk effect will definitely lead to the successive time-stamp error during the pseudo-random code detection process, leading to the whole time-stamp walk error of TPSF, which has not been investigated in previous studies.
Compared to the continuous wave ladar system, the use of an ultra-short pulse (picosecond or femtosecond) laser and a pseudo-random generator render the PSSPCS system expensive and bulky. In this Letter, the field-programmable gate array (FPGA) is used to generate a 2.5 GHz bit-stream. Two channels’ pseudo-random time stamps are employed to calculate TPSF. One is the reference pattern, while the other is the received pattern. A new method is devised to construct the coaxial optical arrangement. The transmitted beam is focused by the coupler and selectively directed by the circulator, achieving the most efficient use of the low-power source of vertical cavity surface emitting laser (VCSEL). On the theoretical level, the performance of the range error is fully studied, including a numerical model construction of the time walk effect on the range error and Monte Carlo algorithms. This Letter, which utilizes Gaussian envelopes[7] to model the shape of the received laser pulses, extends Johnson’s work to develop lower boundary expressions on a pseudo-random photon counting system for the key receiver metric of the range error represented by the root mean square error (RMSE). The Monte Carlo algorithm and error correction experiments based on the PSSPCS are carried out, which means that the range error caused by the target material or reflection can be minimized. After the numerical curve fitting, the corrected range RMSE is improved to 1 cm.
Sign up for Chinese Optics Letters TOC. Get the latest issue of Chinese Optics Letters delivered right to you!Sign up now
The work performed under this area was to theoretically and experimentally investigate the time walk delay and correction.
In order to fully study the range error of the PSSPCS, a laser pulse is assumed to be the Gaussian-envelope pulse[6],
In this Letter, we assumed that the returned pulse’s FWHM is expressed as[12]
The received signal, represented in general as can be modeled as a unit-amplitude Gaussian-envelope pulse modulated by , which is a pseudo-random sequence of ones and zeros. is the time duration of a code chip. is the code length[6]. The total number of the primary electrons generated by a returned pulse is expressed as[7]where is the photon energy, and is the quantum efficiency.
Assuming that the received signal and noise power are and , respectively, for a pseudo-random code modulated range signal, the received photon counting rate is given by
According to Eq. (7), is the amplitude of the received laser pulse, and is the constant background noise rate. For a pseudo-random code modulated range signal, the received photon flux produced by Geiger-mode avalanche photodiodes (GMAPDs) is given by
The cumulative distribution function (CDF) of the GMAPD signal is expressed as
The probability density function (PDF) of the GMAPD signal is the derivative of the given CDF with respect to time. The PDF is
The joint conditional probability density of photon arrivals in (0, ) is[6]
The range Cramer–Rao lower bound (CRLB) is valid for any unbiased measurement of the range, regardless of the exact algorithm used to make that measurement. Based on the maximum likelihood (ML) estimates to compute the CRLB on range error, the log-likelihood function for the GMAPD signal is
The average of the second derivative of the log-likelihood function with respect to the delay is theoretical :
The CRLB for time delay estimate is given by
In the theoretical part, the Gaussian-envelope model of the received laser pulses is utilized, which illustrates that as the laser pulse energy decreases, the peak of the PDF moves closer to the target position[13]. In this Letter, the drift of the peak is assumed to be the so-called time walk effect, which is smaller than the parameter FWHM. For instance, when the FWHM is 440 ps, the simulated PDF has about a 600 ps’ walk error relative to the actual range. We borrow this model to describe the single-photon avalanche diode (SPAD) walk effect, and introduce it to range accuracy on the PSSPCS.
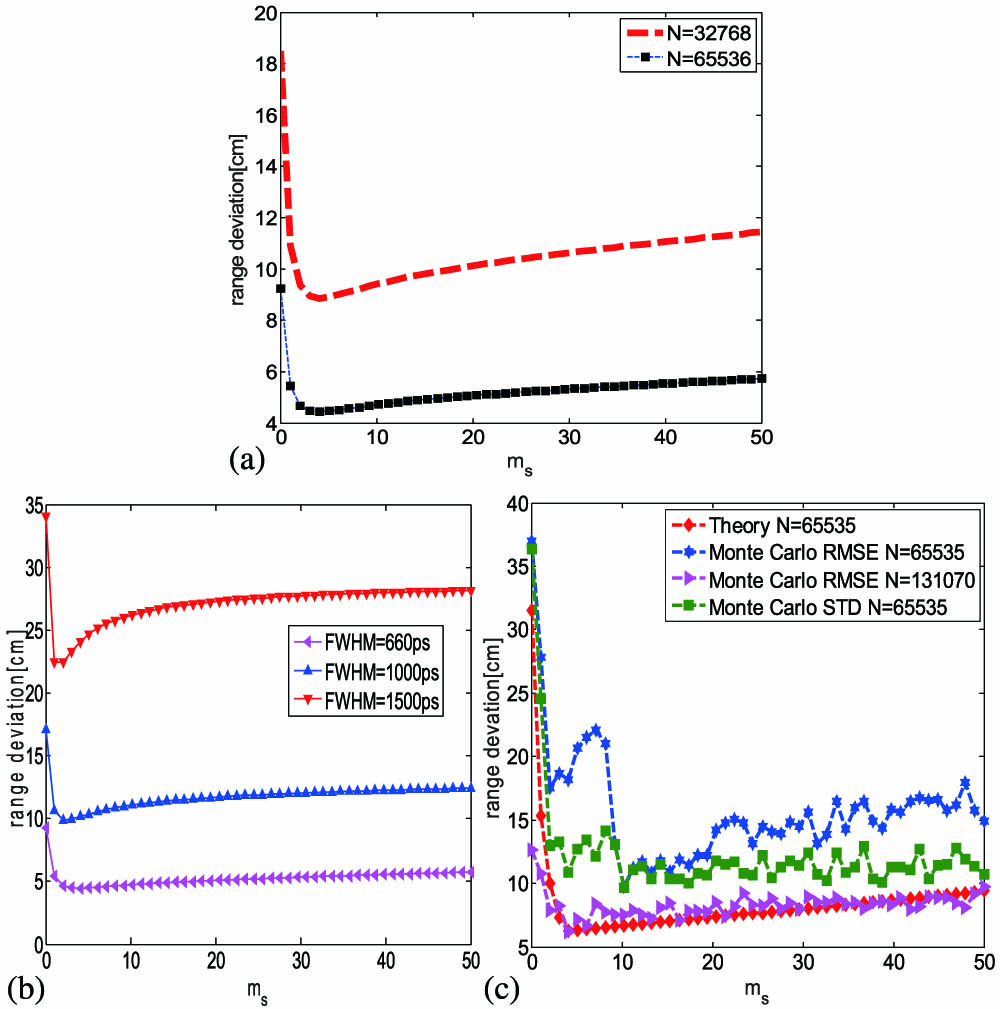
According to Eq. (14), the example plots of the theoretical Cramer–Rao converting to the range versus the total number of the primary electrons generated by returned pulse from 0.01 to 50 are shown in Fig. 1. Figure 1(a) corresponds to the 660 ps FWHM with a target located at 60 m. The noise flux rate is held constant at 10 Mc/s (c/s: counts per second), and the code length is varied. With the same target location and noise flux as in Fig. 1(a), the FWHM of Fig. 1(b) is varied from 660 to 1500 ps. In Fig. 1(b), the code length is 65536. The photon counter’s CRLB first decreases monotonically as the total detected photons increases to 3.4–4.5, then increases slowly, and finally almost saturates to a certain value as the detected photons increase; a minimized CRLB at a finite laser pulse energy is shown in Figs. 1(a) and 1(b). In Fig. 1(b), the PSSPCS CRLB of range is exactly proportional to the FWHM of the received pulse. One theory is shown in Fig. 1(c), corresponding to the 65536 code length (triangle dash line), constant background noise of 50 Mc/s, and FWHM of 660 ps. Compared to the theory plot of Fig. 1(a) (square dash line) under the same condition, noise degrades the CRLB. The range TPSF using the pseudo-random Monte Carlo simulator derived from the methods described in Refs. [13,17] is calculated by cyclic correlation. The range value is extracted by center mass method[7]. Plots of the range estimates are shown in Fig. 1(c). Standard deviation (STD) and RMSE versus are compared to the theory developed in Eq. (14).The CRLB on the range error is a limit on the accuracy of range measurements. The variance of any unbiased range measurement is at least the CRLB. In Fig. 1(c), the Monte Carlo calculated RMSE and STD are higher than the theory given in Eq. (14). Like the PSSPCS CRLB of range, the RMSE has a minimum as a finite pulse energy. At a high laser pulse energy from 4.5 to 50, the range STD almost remains the same, which is different from the range RMSE. For an unbiased range estimator, the STD and RMSE are equal. However, the GMAPD produces a biased estimate of the range. This bias causes the RMSE to be greater than the STD. The variable in Eq. (12) is determined by the settled code length and the proportion of code “1”. If the proportion of binary “1” is constant, a longer code length can bring a better CRLB. The conclusion in Fig. 1(a) is consistent with Fig. 1(c) (triangle dash line and square dash line) and with the statement that range accuracy can be improved by increasing the per pix dwell time in periodic ranging.
Figure 1.(Color online) (a) Theory prediction of range error on different code lengths. (b) Theory prediction of the range error on different FWHMs. (c) Contrast of theory prediction and Monte Carlo simulation with different code lengths.
The output pattern from the FPGA was in the form of a 2.5 GHz return-to-zero bit-stream, which was then combined with a low direct current to VCSEL. The emitted optical pulses were at a wavelength of 850 nm. The 90% output of the splitter was sent through a circulator to a fiber collimator/coupler, which created a free space beam. The light hit a target, which was partially reflecting to the circulator via the fiber coupler/collimator. The output of the circulator was coupled onto the SPAD as the transmitted pattern, whose output was time-stamped by the time digital converter (TDC). To prevent excessive light from damaging the detectors, attenuators were used to attenuate the light. An illustration of the experimental setup used for the PSSPCS-based measurements is shown in Fig. 2.
Figure 2.Systematic schematic diagram showing the key components of the PSSPCS. PC, personal computer.
Calibration results of range error: the rectangular dots are the experimental data, the solid line is the fitting result, regarding the lowest energy as the reference, the star dots are the correction results.
A bit-stream of 2.5 GHz generated by the FPGA is tested by NI 9185 in Ref. [8]. According to Fig. 2, the established system illustrated in Fig. 3(a) is 10 m away from the target. The experiment is carried out in a low light level in order to ignore the background noise. A PerkinElmer commercial single photon counting module is used as a GMAPD with a jitter of 550 ps, dark counts of less than 200 c/s, and dead time of about 80 ns. The time orrelation single photon counting (TCSPC) module is the Pico Harp 300, operating in mode 2 with a time resolution of 8 ps, which is used to record the transmitted pseudo-random time stamp of the laser echo pulse in channel 1 and the reference time stamp in channel 0. The number of code “1” given by generated by Matlab as the sending pattern is about 1.3 Mc/s. In order to set the number of the reference channel’s photons close to 1.3 Mc/s, the attenuator and the voltage of P7 of the VCSEL are employed to adjust the laser power. The variable optical attenuator (VOA) and polarizer are applied to change the number of detected photons arriving in channel 1 due to the combined random polarization and linear polarization light emitted from the VCSEL. The number of detected photons expressed by is between to . Photon counting ratio is defined as the ratio of detected photons to the photons recorded in the reference channel. That is
Figure 3.(a) PSSPCS: (b) photograph of the assembled system.
The photon counting ratios are calculated, and the cyclic correlation function is used to obtain the TPSF in Fig. 4.
Figure 4.One-hundred points intercepted from the correlation TOF histogram at a 99.5%, 50%, 20%, and 12% counting ratio, respectively, using circular correlation with a 0.001 s dwell time and a 400 ps resolution.
The correlation function or TPSF can be regarded as the distribution of correlated photon counts[18]. As the laser pulse energy decreases, the peak of the TPSF moves backward, which is caused by the range walk effect. The principle and the implementation of the correction algorithm are shown in Fig. 5. First, according to the generated bit-stream, the is calculated. Second, the returned pulse energy is adjusted, and is calculated.
Figure 5.Implementation of the correction algorithm.
After acquiring 17 TPSFs. The reference range is subtracted from the calculated range. Forming the original data in Fig. 3(b). At high signal levels, the error curve tends to increase due to the SPAD walk error, which almost agrees with the theoretical simulation. If the number of transmitted photon counts received by channel 1 is below , the TPSF is not obvious, and the peak is almost immersed in the noise. This result corroborates the theory model in Fig. 1 when the total signal energy is below 3.4.
According to the theoretical model and Refs. [10,11,13], when the pulse energy is low, the range is much closer to the true value. Therefore, the range value of the lowest energy expressed as , is regarded as the reference range. Third, the least square method is introduced to fit 17 sets of starred data in Fig. 3(b), corresponding to .
Based on the regression model, the semi-logarithmic fitted regression equation is selected to fit the experimental data for the best performance, and the fitting result is , , shown as the curved part of Fig. 3(b). Finally, the range is corrected by .
In conclusion, the accuracy model CRLB for PSSPCS is derived by considering the range walk error. Simulation and theory both prove the fact that as the echo pulse energy decreases, the range accuracy becomes better, and then it noticeably deteriorates. Experiments show that with different pulse energy, the range drifts. With the growing pulse energy, the range error becomes larger. It means that the range accuracy degrades. The method we apply to correct the range error is based on the fact that the number of the reference bit-stream photon counts is constant and invariable. If it changes, a new range drift will be introduced. The upper limit of the photon number is equal to the reference’s photon counts, assuming 100% detection. The greatest photon c/s that the TCSPC first-in first-out can obtain are 2 Mc/s. Our experiment is not aimed to find the exact error, but to reduce the relative error of different pulse energies caused by different target reflections. We demonstrate the range error correction algorithm based on the time-correlated PSSPCS. Based on a priori modeling of photon counts, the range of the PSSPCS has been corrected, and the range RMSE has been enhanced from 9 to 1 cm.