• Acta Optica Sinica
  • Vol. 44, Issue 8, 0812001 (2024)
Yanjie Wei1、2、* and Yao Xiao1
Author Affiliations
  • 1Department of Engineering Mechanics, Shijiazhuang Tiedao University, Shijiazhuang 050043, Hebei , China
  • 2State Key Laboratory of Mechanical Behavior and System Safety of Traffic Engineering Structures, Shijiazhuang Tiedao University, Shijiazhuang 050043, Hebei , China
  • show less
    DOI: 10.3788/AOS231805 Cite this Article Set citation alerts
    Yanjie Wei, Yao Xiao. Processing Method of Infrared Sequence Images Based on Long Pulse Thermal Excitation[J]. Acta Optica Sinica, 2024, 44(8): 0812001 Copy Citation Text show less
    Acquisition and DFT of infrared image sequence by infrared detector after long pulse thermal wave excitation
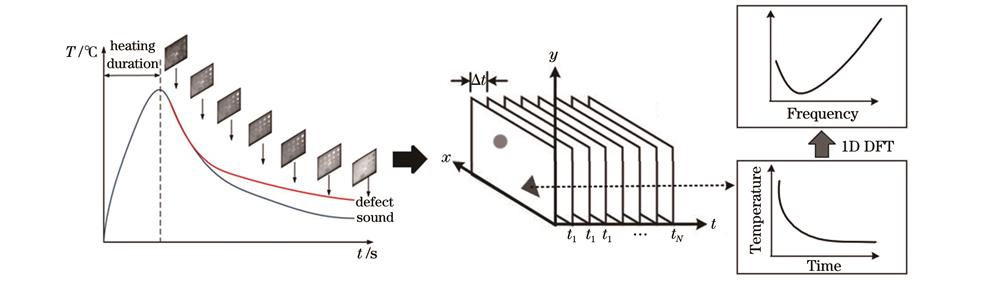
    Fig. 1. Acquisition and DFT of infrared image sequence by infrared detector after long pulse thermal wave excitation
    Schematic of panel with internal defects at different depths
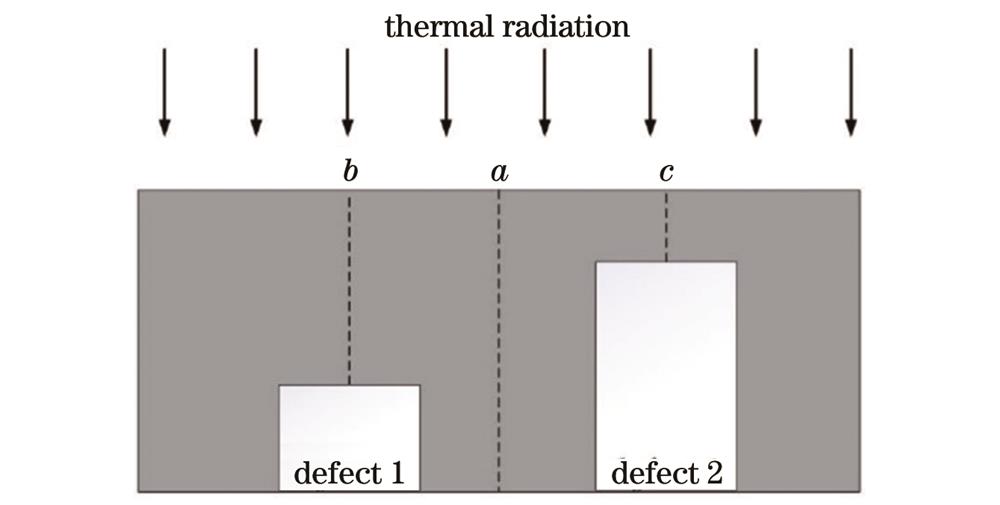
    Fig. 2. Schematic of panel with internal defects at different depths
    Simulation test results. (a) Phase data and reference phase data at corresponding points; (b) curve of phase difference at each point and corresponding integrated regions
    Fig. 3. Simulation test results. (a) Phase data and reference phase data at corresponding points; (b) curve of phase difference at each point and corresponding integrated regions
    Flow chart of image sequence processing method for long pulse thermography
    Fig. 4. Flow chart of image sequence processing method for long pulse thermography
    GFRP sample. (a) Schematic of defect distribution in GFRP panel; (b) front and rear surfaces of sample
    Fig. 5. GFRP sample. (a) Schematic of defect distribution in GFRP panel; (b) front and rear surfaces of sample
    Self-developed infrared non-destructive testing system
    Fig. 6. Self-developed infrared non-destructive testing system
    Raw thermal images captured at different times. (a) 5 s; (b) 15 s; (c) 25 s
    Fig. 7. Raw thermal images captured at different times. (a) 5 s; (b) 15 s; (c) 25 s
    Test results of GFRP sample. (a) Phase curves; (b) phase difference curves
    Fig. 8. Test results of GFRP sample. (a) Phase curves; (b) phase difference curves
    Phase images at different frequencies. (a) 0.019 Hz; (b) 0.039 Hz; (c) 0.078 Hz; (d) phase integrated image
    Fig. 9. Phase images at different frequencies. (a) 0.019 Hz; (b) 0.039 Hz; (c) 0.078 Hz; (d) phase integrated image
    Images for size measurement of defects. (a) Image segmentation; (b) edge extraction
    Fig. 10. Images for size measurement of defects. (a) Image segmentation; (b) edge extraction
    Detection results with different algorithms. (a) ATC; (b) TSR; (c) PCA; (d) proposed method
    Fig. 11. Detection results with different algorithms. (a) ATC; (b) TSR; (c) PCA; (d) proposed method
    Quantitative evaluation of different algorithms. (a) Absolute grayscale difference profiles in horizontal line of defects; (b) SNR
    Fig. 12. Quantitative evaluation of different algorithms. (a) Absolute grayscale difference profiles in horizontal line of defects; (b) SNR
    Test results of defective and sound regions. (a) Variation of temperature difference with time; (b) variation of RSN with sampling frequency
    Fig. 13. Test results of defective and sound regions. (a) Variation of temperature difference with time; (b) variation of RSN with sampling frequency
    Detection results at different sampling frequencies. (a) 1 Hz; (b) 5 Hz; (c) 10 Hz; (d) 30 Hz
    Fig. 14. Detection results at different sampling frequencies. (a) 1 Hz; (b) 5 Hz; (c) 10 Hz; (d) 30 Hz
    DefectMeasured /mmDesigned /mmError /%
    15.254.0
    29.9101.0
    315.2151.3
    420.5202.2
    Average is 2.2%
    Table 1. Measurement results of defect size
    Yanjie Wei, Yao Xiao. Processing Method of Infrared Sequence Images Based on Long Pulse Thermal Excitation[J]. Acta Optica Sinica, 2024, 44(8): 0812001
    Download Citation