• Photonics Research
  • Vol. 12, Issue 5, 1024 (2024)
Hongrui Shan1、†, Xueqian Wang2、†, Qiheng Wei1、†, Hailang Dai1、4、*, and Xianfeng Chen1、3、5、*
Author Affiliations
  • 1State Key Laboratory on Fiber Optic Local Area Communication Networks and Advanced Optical Communication Systems, Department of Physics and Astronomy, Shanghai Jiao Tong University, Shanghai 200240, China
  • 2State Key Laboratory of Metal Matrix Composites, Shanghai Key Laboratory for Molecular Engineering of Chiral Drugs, School of Materials Science and Engineering, Shanghai Jiao Tong University, Shanghai 200240, China
  • 3Collaborative Innovation Center of Light Manipulations and Applications, Shandong Normal University, Jinan 250358, China
  • 4e-mail: hailangdai@sjtu.edu.cn
  • 5e-mail: xfchen@sjtu.edu.cn
  • show less
    DOI: 10.1364/PRJ.515233 Cite this Article Set citation alerts
    Hongrui Shan, Xueqian Wang, Qiheng Wei, Hailang Dai, Xianfeng Chen. Enriched photosensitizer for deep-seated-tumor photodynamic therapy[J]. Photonics Research, 2024, 12(5): 1024 Copy Citation Text show less
    (a) Scheme of synthesis of PPIX-PEI-UCNP@FA NPs. (b) Mechanism of PPIX-PEI-UCNP@FA NPs as the PDT agent for tumor therapy via the 980 nm laser.
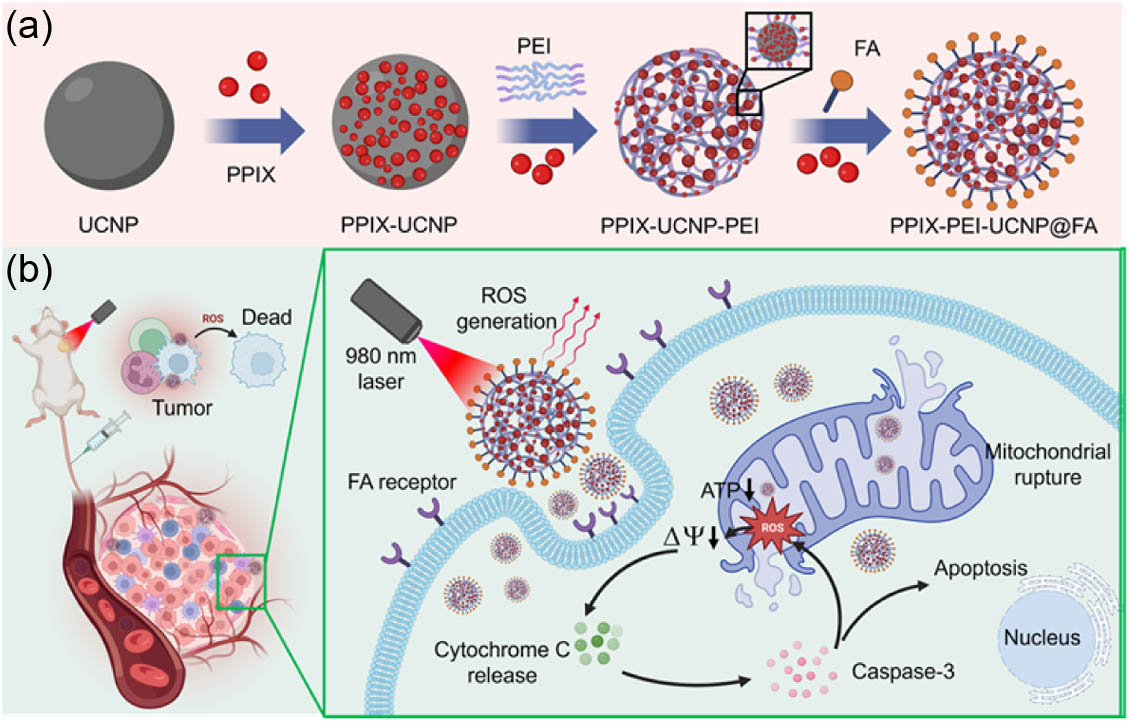
    Fig. 1. (a) Scheme of synthesis of PPIX-PEI-UCNP@FA NPs. (b) Mechanism of PPIX-PEI-UCNP@FA NPs as the PDT agent for tumor therapy via the 980 nm laser.
    Synthesis and characterization of PPIX-PEI-UCNP@FA NPs as an agent of PDT. (a) The transmission electron microscopy (TEM) image of UCNPs (scale bar: 100 μm). (b) The Fourier-transform infrared spectroscopy (FTIR) analysis of the UCNPs and of PPIX-PEI-UCNP@FA NPs. (c) UV-visible absorption spectrum of PPIX and photoluminescence spectrum of UCNPs and PPIX-UCNPs with the 980 nm laser. (d) High angle annular dark field (HAADF) image of PPIX-UCNPs from TEM (scale bar: 100 μm). (e) An overlap of scanning TEM (STEM) mapping image of O and F elements. (f) Time-dependent UV–visible absorption spectra of the PPIX-PEI-UCNP@FA NPs and ABDA mixture solution upon 980 nm laser irradiation at 1 W/cm2 (scale bar: 100 μm). (g) Penetration depth of 980 nm and 635 nm lasers in different thicknesses of porcine tissue. (h) Spot profiles of 980 nm and 635 nm laser beams after passing through 10 mm porcine tissue. (i) ROS generation after 30 min of 980 nm and 635 nm laser irradiation through different thicknesses of porcine tissue.
    Fig. 2. Synthesis and characterization of PPIX-PEI-UCNP@FA NPs as an agent of PDT. (a) The transmission electron microscopy (TEM) image of UCNPs (scale bar: 100 μm). (b) The Fourier-transform infrared spectroscopy (FTIR) analysis of the UCNPs and of PPIX-PEI-UCNP@FA NPs. (c) UV-visible absorption spectrum of PPIX and photoluminescence spectrum of UCNPs and PPIX-UCNPs with the 980 nm laser. (d) High angle annular dark field (HAADF) image of PPIX-UCNPs from TEM (scale bar: 100 μm). (e) An overlap of scanning TEM (STEM) mapping image of O and F elements. (f) Time-dependent UV–visible absorption spectra of the PPIX-PEI-UCNP@FA NPs and ABDA mixture solution upon 980 nm laser irradiation at 1  W/cm2 (scale bar: 100 μm). (g) Penetration depth of 980 nm and 635 nm lasers in different thicknesses of porcine tissue. (h) Spot profiles of 980 nm and 635 nm laser beams after passing through 10 mm porcine tissue. (i) ROS generation after 30 min of 980 nm and 635 nm laser irradiation through different thicknesses of porcine tissue.
    Cell viability of (a) 4T1 cells and (b) L929 cells after incubation 48 h with different concentrations of PPIX-PEI-UCNP@FA NPs in the presence or absence of laser (980 nm, 1 W cm−2). (c) Live/dead staining images of 4T1 cells with various treatments (scale bar: 250 μm). (d) Flow cytometry results of 4T1 cells co-stained by Annexin V-FITC and PI after different treatments and (e) the corresponding statistics of apoptosis cells. (f) Intracellular reactive oxygen species generation (ROS) evaluated by flow cytometry after different treatments (negative control: without any treatment; positive control: treated with H2O2 only). (g) Mean fluorescence intensity statistics of 4T1 cells corresponding to (h). (h) Fluorescence images of intracellular ROS after various treatments using DCFH-DA as the probe (scale bar: 100 μm). (i) TUNEL-stained images of 4T1 cells after different treatments (scale bar: 100 μm).
    Fig. 3. Cell viability of (a) 4T1 cells and (b) L929 cells after incubation 48 h with different concentrations of PPIX-PEI-UCNP@FA NPs in the presence or absence of laser (980 nm, 1  Wcm2). (c) Live/dead staining images of 4T1 cells with various treatments (scale bar: 250 μm). (d) Flow cytometry results of 4T1 cells co-stained by Annexin V-FITC and PI after different treatments and (e) the corresponding statistics of apoptosis cells. (f) Intracellular reactive oxygen species generation (ROS) evaluated by flow cytometry after different treatments (negative control: without any treatment; positive control: treated with H2O2 only). (g) Mean fluorescence intensity statistics of 4T1 cells corresponding to (h). (h) Fluorescence images of intracellular ROS after various treatments using DCFH-DA as the probe (scale bar: 100 μm). (i) TUNEL-stained images of 4T1 cells after different treatments (scale bar: 100 μm).
    Cellular uptake of PPIX-PEI-UCNP@FA NPs in 4T1 cells determined by (a) confocal laser scanning microscopy (CLSM, scale bar: 25 μm) and (b) flow cytometry at different times. (c) Colocalization analysis of PPIX-PEI-UCNP@FA NPs and mitochondria using CLSM and the corresponding fluorescent line profile (red line representing PPIX-UCNP NPs and green line representing Mito-Tracker, scale bar: 25 μm). (d) Fluorescent images of mitochondrial ROS production after various treatments (scale bar: 25 μm). (e) Western blot (WB) results of caspase-3, cytochrome c, Bcl-2, and Bax after different treatments. (f) The relative protein expression levels of WB in (e). (g) Fluorescence images of mitochondrial membrane potential in 4T1 cells after different treatments using JC-1 (scale bar: 100 μm). (h) Flow cytometry of mitochondrial membrane potential (MMP) of 4T1 cells after different treatments using JC-1 and (i) the corresponding statistics of MMP loss. (j) BioTEM images of 4T1 cells after incubation with PPIX-PEI-UCNP@FA NPs with or without the laser (980 nm, 1 W cm−2) for 48 h (scale bars: 1 and 0.2 μm).
    Fig. 4. Cellular uptake of PPIX-PEI-UCNP@FA NPs in 4T1 cells determined by (a) confocal laser scanning microscopy (CLSM, scale bar: 25 μm) and (b) flow cytometry at different times. (c) Colocalization analysis of PPIX-PEI-UCNP@FA NPs and mitochondria using CLSM and the corresponding fluorescent line profile (red line representing PPIX-UCNP NPs and green line representing Mito-Tracker, scale bar: 25 μm). (d) Fluorescent images of mitochondrial ROS production after various treatments (scale bar: 25 μm). (e) Western blot (WB) results of caspase-3, cytochrome c, Bcl-2, and Bax after different treatments. (f) The relative protein expression levels of WB in (e). (g) Fluorescence images of mitochondrial membrane potential in 4T1 cells after different treatments using JC-1 (scale bar: 100 μm). (h) Flow cytometry of mitochondrial membrane potential (MMP) of 4T1 cells after different treatments using JC-1 and (i) the corresponding statistics of MMP loss. (j) BioTEM images of 4T1 cells after incubation with PPIX-PEI-UCNP@FA NPs with or without the laser (980 nm, 1  Wcm2) for 48 h (scale bars: 1 and 0.2 μm).
    (a) Treatment protocol for normal BALB/c mice intravenously injected with PBS and PPIX-PEI-UCNP@FA NPs. (b) Representing H&E staining images of major organs (heart, liver, spleen, lung, and kidney) treated with PPIX-PEI-UCNP@FA NPs in the presence of the laser (980 nm, 1 W cm−2) after 28 days (scale bar: 50 μm). (c) Routine blood assay with various treatments at 28 days.
    Fig. 5. (a) Treatment protocol for normal BALB/c mice intravenously injected with PBS and PPIX-PEI-UCNP@FA NPs. (b) Representing H&E staining images of major organs (heart, liver, spleen, lung, and kidney) treated with PPIX-PEI-UCNP@FA NPs in the presence of the laser (980 nm, 1  Wcm2) after 28 days (scale bar: 50 μm). (c) Routine blood assay with various treatments at 28 days.
    (a) Schematic diagram of the establishment of a 4T1 tumor model and treatment process. (b) Distribution of PPIX-PEI-UCNP@FA NPs in vivo at the scheduled time by an IVIS system. (c) Ex vivo imaging of major organs (heart, liver, spleen, lung, and kidney) and tumors at 24 h. (d) Representative photographs of 4T1 tumor mice in different treatment groups on day 0, 2, 4, 6, 8, 10, 12, and 14. (e) Tumor change curve in each treatment group (n=5 for each group). (f) Photographs of tumors after various treatments on day 14. (g) The average tumor volume variation of each group. (h) H&E staining and (i) TUNEL staining images of tumors after different treatments (scale bar: 50 μm).
    Fig. 6. (a) Schematic diagram of the establishment of a 4T1 tumor model and treatment process. (b) Distribution of PPIX-PEI-UCNP@FA NPs in vivo at the scheduled time by an IVIS system. (c) Ex vivo imaging of major organs (heart, liver, spleen, lung, and kidney) and tumors at 24 h. (d) Representative photographs of 4T1 tumor mice in different treatment groups on day 0, 2, 4, 6, 8, 10, 12, and 14. (e) Tumor change curve in each treatment group (n=5 for each group). (f) Photographs of tumors after various treatments on day 14. (g) The average tumor volume variation of each group. (h) H&E staining and (i) TUNEL staining images of tumors after different treatments (scale bar: 50 μm).
    Hongrui Shan, Xueqian Wang, Qiheng Wei, Hailang Dai, Xianfeng Chen. Enriched photosensitizer for deep-seated-tumor photodynamic therapy[J]. Photonics Research, 2024, 12(5): 1024
    Download Citation