
Lu He, Xijie Li, Jie Yang, Longjie Jiang, Qian Liu, Ling Fu. Super-simplified fiber scanner for cellular-resolution endoscopic imaging[J]. Photonics Research, 2023, 11(12): 2020
- Photonics Research
- Vol. 11, Issue 12, 2020 (2023)
Abstract
1. INTRODUCTION
Fiber scanners take advantages of compact size, mechanical flexibility, and geometry diversity, when compared with conventional commercially available scanning devices such as galvo mirrors. Hence, fiber scanners have promising applications in endoscopic imaging [1–13], microdisplays [14], and other laser scanning technologies. A typical fiber scanner includes an optical fiber and a miniaturized actuator. A single fiber allows the transmission of excitation light and the collection of signals at a single point. Two-dimensional (2D) spatial information can be obtained by scanning the fiber cantilever in two dimensions. To achieve 2D scanning, two independent transverse vibrations of the fiber cantilever are usually excited in orthogonal directions using piezoelectric [1–7,13–17], electromagnetic [8,9,11], and electrothermal [10,18] actuators. In particular, when the frequencies of the excitations from the actuator are near or equal to the natural frequencies of the fiber cantilever, the resonance of the fiber cantilever in both directions can be excited simultaneously. As a result, the scanning range can be amplified tens of times.
To be applied to endoscopic imaging for in vivo optical biopsy, available fiber scanners have hurdles to concurrently meet the following requirements: (1) small diameter, e.g., less than 2.6 mm allowing passage through the working channel of a conventional gastrointestinal endoscope; (2) low driving voltage of less than , meeting international standards for the basic safety and essential performance of medical electrical equipment (IEC 60601-1); (3) imaging frame rate of no less than 5 fps (frames per second), avoiding motion artifacts under human physiological conditions; and (4) simplified and stable mechanical structures, guaranteeing the success rate of manufacture and the repeatability of scanning trajectories. Moreover, it will be a conceptual change for optical endoscopy systems if optical fiber scanning probes could be manufactured as disposable devices, eliminating the need to sterilize the part of the endoscope that enters the body after each inspection.
The arrangement of a fiber scanner plays a crucial role in determining both the compactness and stability of the fiber scanner, as well as its driving voltage. To actuate a circularly symmetrical fiber cantilever that has identical natural frequencies for resonance in orthogonal directions, a dual-axis actuating structure is usually required [1–4,7–11,15,18–21]. In this configuration, the actuator has two perpendicular actuating axes that are controlled by two electrical signals, which can provide excitations along both axes independently. Consequently, complex structures are necessary for implementing the dual axis of the actuator for 2D actuation. For example, one or two pairs of piezoelectric plates or electromagnetic coils should be arranged in a perpendicular manner [3,4,8–11,15,21], or the outer surface of a piezoelectric tube should be divided into quadrant electrodes [1,2,7,19,20] to offer dual-axis excitations. However, the complex structure of the scanner may lead to the following problems. First, the energy dissipation of the fiber scanner increases due to internal friction, resistance, and relative motion among the actuator components [3,22]. Because of this, the scanners are typically driven at high voltages () [3,23,24], which may not comply with standard requirements for medical electrical equipment (IEC 60601-1). Second, since the mentioned structures of fiber scanners contain a number of components, miniaturization is challenging as it becomes increasingly difficult to accurately align the components at smaller scales. Therefore, the fiber scanners may have large diameters () [8,20,21] and are incompatible with clinical gastrointestinal endoscope working channels. Moreover, slight misalignment of the orientation or position of the components may well introduce undesirable mechanical coupling, which can deteriorate the scanning trajectory of the fiber scanner and make it difficult to reconstruct the image. Finally, the delicate arrangement of the various tiny components makes the fiber scanner extremely sensitive to disturbances in the environment, resulting in poor repeatability of the scan trajectory.
Sign up for Photonics Research TOC. Get the latest issue of Photonics Research delivered right to you!Sign up now
Alternatively, by modifying the fiber cantilever structure to produce a difference in its bending stiffness in the orthogonal directions, the resonance of the fiber cantilever in the two directions can be excited at different natural frequencies. As a result, a single-axis actuating structure, which applies excitation to the fiber cantilever along a single actuating axis, can be used for 2D actuation. When the excitation contains two frequency components equal to the two resonant frequencies, it is possible to simultaneously excite the resonances of the fiber cantilever in orthogonal directions. By employing the single-axis actuating structure, the problems induced by the complicated structure of the dual-axis actuating structure can be eliminated. However, additional and attaching structures are required in the fiber cantilever to produce a difference in the bending stiffness for 2D vibrations. For example, a micro stiffener (such as a rod [5,6,13], a spring [19], or a thin film [7]) is attached to the circularly symmetrical single-mode fiber cantilever to alter the bending stiffness along one axis. However, processing and precision assembly tend to be difficult since these micro stiffeners are typically only a few tens to hundreds of microns in size. An alternative approach is to bond two fibers together to form a non-symmetrical cantilever [25]. Nevertheless, a complex and time-consuming fabrication process is required to guarantee a tight and parallel joining of the two fibers. Hence, while the single-axis actuating method permits simpler actuator structures, the construction of the non-symmetrical cantilevers requires additional structures as well as precise, complex, and customized fabrication processes, resulting in reduced simplicity and stability of the fiber scanners.
Since existing fiber scanners necessitate the delicate alignment of fine elements to achieve 2D actuation or different resonant frequencies, they are complex either in the actuating mechanism or in the cantilever structure, leading to challenges in the standardization of the manufacturing process and further applications of those fiber scanners. To tackle this problem, exploiting the intrinsic difference in bending stiffness of the non-symmetrical fibers, we developed the most simplified fiber scanner to date by combining the single-axis actuating structure with these fibers. As the natural frequencies of a fiber cantilever are related to its bending stiffness, the difference in bending stiffness results in different resonant frequencies when the fiber cantilever resonates in two orthogonal directions. This allows the super-simplified fiber scanner to include only a single piezoelectric bimorph and a single fiber for 2D scanning. The fiber scanner was 1 mm in width and 0.5 mm in thickness. A uniform Lissajous scanning was achieved with a frame rate of 5 fps, a scanning range of , and a driving voltage of . We then used the fiber scanner to manufacture an endomicroscopic probe with a diameter of 1.9 mm. Confocal imaging of
2. RESULTS
A. Analysis of Fiber Cantilever Vibration Characteristics
When an electrical signal with a certain frequency is applied to the fiber scanner, the actuator transforms the electrical signal into periodic excitation on the fiber cantilever, causing it to vibrate at the same frequency as the excitation frequency. To achieve sufficient deflection at the fiber tip, the excitation frequency is often selected to be close to or equal to the first-order natural frequency of the fiber cantilever to excite the fiber cantilever to resonate. This frequency is also called the fundamental resonant frequency.
For a circularly symmetrical fiber cantilever with a homogeneous cross section, the theoretical first-order natural frequency can be calculated using Eq. (A3) in Appendix A. Equation (A3) is valid when the fiber cantilever vibrates in either direction since it is orientation-independent. This means the fiber cantilever has the same fundamental resonant frequencies when resonating in orthogonal directions. However, resonating at the same resonant frequencies makes the fiber cantilever susceptible to mechanical cross-coupling forces. Any tiny coupling force could be amplified at the resonance and interfere with the other direction [1].
This problem can be avoided if the vibrations of the fiber cantilever in the orthogonal directions have different first-order natural frequencies. According to a more general expression of the natural frequency of the fiber cantilever [Eq. (A2)], an effective approach for achieving this goal is to make the bending stiffness of the fiber cantilever different in the two directions. This can be accomplished by breaking the material or geometric circular symmetry of the cross section of the fiber cantilever along orthogonal directions since depends on the material and geometry characteristics of its cross section. Moreover, the easiest and most straightforward way to accomplish this is to use a fiber with a non-symmetrical cross section and two orthogonal axes of symmetry. This strategy inspired the structural design of our fiber scanner.
A panda polarization maintaining fiber (PMF) [Fig. 1(a)] and a bow-tie PMF [Fig. 1(b)] are the two most common commercially available non-symmetrical fibers. A PMF contains two stress-applied parts (SAPs) in the cladding that are symmetric about the fiber core, and the material characteristics (Young’s modulus and density) of the SAPs are different from those of the fiber cladding and the fiber core. Therefore, the material circular symmetry of the PMF’s cross section is broken by the SAPs while the material distribution of the cross section is still symmetric along two orthogonal axes. The two axes of symmetry are called the fast and slow axes due to their optical characteristics. By giving excitations to the PMF cantilever along its fast and slow axes, resonance can be generated at different resonant frequencies in the two directions.
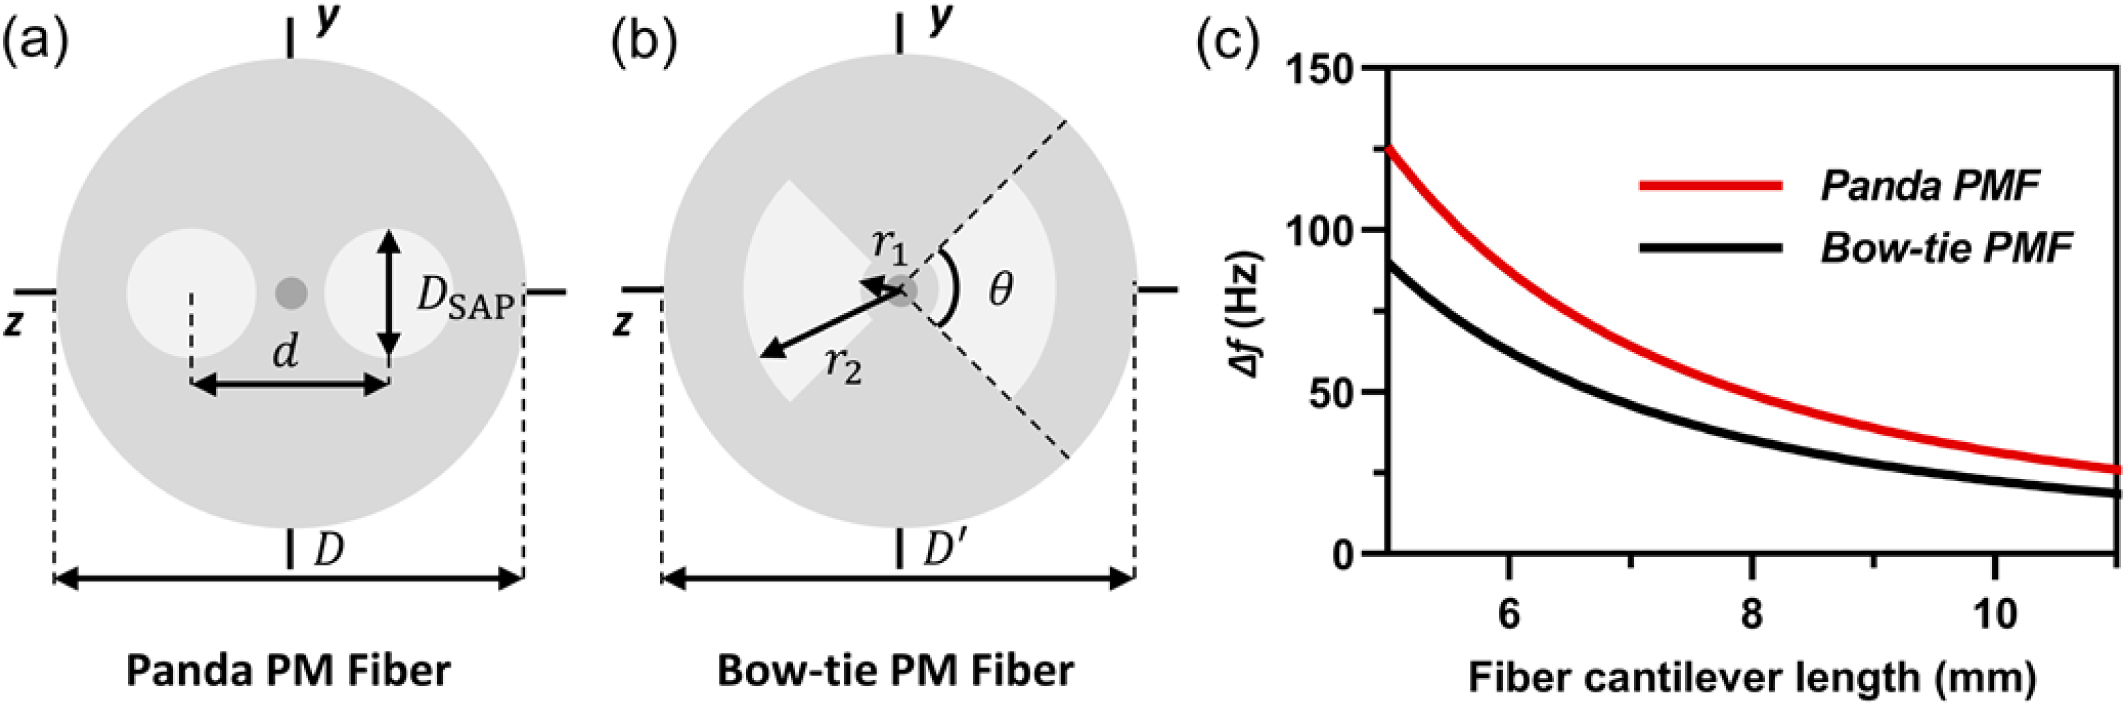
Figure 1.Diagrams of the cross sections of the panda and bow-tie PMFs and their first-order natural frequency differences. (a) Cross section of panda PMF, where
We theoretically derived expressions for the natural frequencies of a panda PMF cantilever and a bow-tie PMF cantilever. We also compared the degree of the frequency difference between the vibrations in the two axes of the cantilevers. The two types of fiber cantilevers still followed the general expressions for the natural frequencies given in Eq. (A2) in Appendix A. We used the -axis and -axis to define the vibration directions of a PMF cantilever, and they coincide with the fast and slow axes of the PMF. The expressions for the bending stiffness and mass per unit length of the fiber with a cross section composed of several materials are provided in Appendix A [Eqs. (A4) and (A5)]. Based on this, the first-order natural frequencies of the vibrations in the -axis and the -axis of the above two types of PMFs could be derived [Eqs. (A9), (A10), (A14), and (A15)].
We further calculated the difference between the natural frequencies of the vibrations in the -axis and -axis of the panda and bow-tie PMF cantilevers at different cantilever lengths. and present the frequency difference of the panda and bow-tie PMF cantilevers. The results are shown in Fig. 1(c). The frequency difference of the panda PMF () was more significant than that of the bow-tie PMF () for the same fiber cantilever length . This indicated that the frequency separation of the panda PMF was more effective and thus more likely to reduce the crosstalk between the two axes, making it more suitable for Lissajous scanning.
B. Fiber Scanner Design
The schematic diagram of the fiber scanner is shown in Fig. 2(a), and a photograph of the scanner is shown in Fig. 2(b). The panda PMF suited for the confocal imaging wavelength (PM460-HP, Nufern) was chosen for the structure. The photograph of the fiber cross section taken in the microscope is displayed in Fig. 2(c). The fiber was driven by a single parallel-type piezoelectric bimorph. The piezoelectric bimorph had a compact structure and large bending displacement, allowing it to offer a sufficient strain to force the fiber cantilever for scanning despite its limited size and low driving voltage. The piezoelectric bimorph was fixed at one end. The fiber was placed at the center of the upper surface of the piezoelectric bimorph, and the -axis (or -axis) of the fiber was angled to the upper surface of the bimorph under a microscope. The fiber was then attached to the piezoelectric bimorph. The piezoelectric bimorph applied a force perpendicular to the upper surface of the bimorph when a driving voltage was applied. The direction and magnitude of the force are related to the polarity and amplitude of the applied voltage. Along the two symmetry axes of the fiber, the force can be divided into and , where and .
![]()
Figure 2.Design of the fiber scanner structure and realization of the Lissajous scan. (a) Schematic diagram of the structure of the scanner and the force analysis of the fiber cantilever. (b) A photograph of the scanner, which was captured from the oblique top of the scanner. The black circular holes in the background of the photo are the thread mounting holes on the optical platform. (c) A microscopic photograph of the cross section of the panda PMF. (d) First-order natural frequencies
The driving voltage applied to the piezoelectric bimorph is as follows:
The structure consisted of only a single piezoelectric bimorph and a single optical fiber, which could be assembled in a simple way without an additional structure or special processing. Only a single-channel driving signal was required to make the fiber resonate at different frequencies in two orthogonal directions simultaneously. With this simple mechanical and electrical structure, it was easier to achieve standardized production and improved adaptability for many application scenarios.
The mechanical-electrical coupling model of this fiber scanner [Fig. 6(a)] was established using the finite element analysis method, and its first 20th-order vibration modes were analyzed. The results are shown in Fig. 6(b). The results showed that the vibration modes of the fiber scanner included not only fiber cantilever vibration but also piezoelectric bimorph vibration and torsion. The first two vibration modes corresponded to the first-order transverse vibrations of the fiber cantilever along the -direction and -direction. In addition, the resonant frequencies of these two vibration modes were much lower compared to the other modes, as shown in Fig. 6(c), so there was no interference from other vibration modes.
Further, we experimentally measured the first-order and second-order resonant frequencies and of the fiber scanner at different fiber cantilever lengths and compared them with the calculated theoretical natural frequencies and of the panda PMF calculated according to Eqs. (A9) and (A10), as shown in Fig. 1(d). The experimental values substantially matched the theoretical values. The main errors might have come from: (1) the measurement error of the actual fiber cantilever length, (2) the deviation of the actual geometric and material parameters of the fiber cantilever from those used in the theoretical calculation, and (3) the assembly method for the fiber cantilever and the piezoelectric bimorph as well as the fixation method of the piezoelectric bimorph could cause the resonant frequencies to vary to some extent.
The above experimental results demonstrated that our proposed structure could leverage the resonant modes of the fiber cantilever along the -axis and -axis to realize the Lissajous scan without interference from higher-order vibration modes. In addition, we could make precise predictions of the resonant frequencies using Eqs. (A9) and (A10), which was helpful when designing the fiber scanner.
C. Realization of Multi-Frame, High-Density Lissajous Scan
Frame rate and density are two crucial characteristic factors of a Lissajous scan. The frame rate (FR) indicates the total number of Lissajous pattern repeats per unit of time. When the ratio of the two frequencies is a rational number, it satisfies , where and are prime integers. The FR can then be expressed as
This value also corresponds to the greatest common divisor (GCD) of the two frequencies. In accordance with this premise, the experimental operating frequencies could be tuned around the resonant frequencies to attain a desired FR. This strategy has been previously validated [26].
and are related to the density of the Lissajous pattern, which can be measured using the fill factor (FF). By dividing the scanned area into subregions, the FF can be calculated using the following equation:
A driving voltage, as stated in Eq. (1), was applied to the scanner using and as the operating frequencies to produce a 5-fps Lissajous scan. The trajectory recorded with CMOS is shown in Fig. 2(g). The FFs of the trajectory at the corresponding moments () were 57.8%, 84.7%, 93.2%, 96.8%, and 98.1%.
D. Confocal Endoscopic Imaging System and Imaging Performance
We developed a microprobe for confocal endoscopic imaging based on the fiber scanner, as shown in Fig. 3(a). The key components are indicated in the figure. A detailed description of each component can be found in Appendix E. The photographs of the probe are shown in Figs. 3(b) and 3(c). The probe had a total length of 25 mm and a diameter of 1.9 mm, and its housing was made of a biocompatible material that allowed access to the inside of the biological tissues. We designed and constructed the confocal imaging system, as depicted in Fig. 3(d). The system had the following features: trajectory pre-detection, scanning control, excitation light transmission, and fluorescence signal collection. Each system component is discussed in detail in Appendix F.
![]()
Figure 3.Configuration and test of the endoscopic probe and confocal imaging system. (a) Schematic diagram of the endoscopic probe. (b),(c) Photographs of the probe. (d) Schematic illustration of the confocal imaging system. ND: neutral filter; DM: dichroic mirror; PMT: photomultiplier tube. (e) Image of the USAF 1951 resolution target. The line pairs of groups 7, 8, and 9 are visible, where elements 1–6 of group 7 are shown from top to bottom on the right. (f) The enlarged view of the area circled by the red rectangular box in (e). (g) Intensity curve of the line pairs in element 5 of group 8 [marked by the red straight line in (f)]. (h) Image of 10-μm fluorescent beads. (i) Image of fluorescent lens wiping paper. FOV: approximately
We then tested the system’s imaging capabilities. Since the light spot at the tip of the fiber cantilever was not an ideal spot but had a certain size, the lateral resolution of the system was limited by the ratio of the fiber’s mode field diameter to the magnification of the imaging objective rather than the diffraction limit. If the magnification of an imaging objective is and the fiber’s mode field diameter is MFD, then the spot at the fiber tip is imaged in the focal plane of the objective with a diameter as follows
The minimum distance that can be resolved in the focal plane is the radius of this imaging spot, which is
The MFD of the panda PMF used in the system was approximately 3.3 μm, and the magnification of the imaging gradient-index (GRIN) lens was , which gave according to Eq. (7). The equation also suggested that either increasing the imaging objective’s magnification or decreasing the fiber’s mode field diameter would be helpful for further improving the lateral resolution.
A standard USAF 1951 resolution target (#55-622, Edmund) was imaged to test the experimental lateral resolution. The result is shown in Fig. 3(e), and an enlarged view of the group 8 elements is shown in Fig. 3(f). The intensity curve of the line pairs in element 5 of group 8 [marked by the red line in Fig. 3(f)] is shown in Fig. 3(g). The intensity ratios of the two minimal values to the three maximal values in the curve were less than 74%. According to Rayleigh’s criterion, the result demonstrated that this line pair was resolvable, corresponding to a resolution of approximately 1.23 μm, which was larger than the theoretical resolution due to the aberration of the imaging objective.
Following that, we imaged 10-μm fluorescent beads with regular and single shapes and fluorescent lens wiping paper with irregular shapes and complex structures. The results are shown in Figs. 3(h) and 3(i). Figure 3(h) shows multiple fluorescent beads of the sphere shape in the FOV with no distortion, and Fig. 3(i) shows multi-layered fiber structures with clear fiber edges. The imaging results demonstrated that the system was capable of resolving microstructures and could image both regular and irregular shapes without distortion.
E. Mouse Tissue Section Imaging
To investigate the cellular morphology of the tissue sections on the slides, we imaged a 16-μm-thick tissue section of a mouse kidney stained with Alexa Fluor 488 wheat germ agglutinin (F-24630, Invitrogen), as shown in Figs. 4(a)–4(c). The frame rate was 5 fps, and the FOV was approximately . Additionally, the same structures were imaged using a commercial confocal microscopy system (LSM 780, ZEISS) as a reference. The results are shown in Figs. 4(d)–4(f). The commercial imaging system used an objective of . The proximal tubules [Figs. 4(a) and 4(d)], distal tubules [Figs. 4(b) and 4(e)], and collecting ducts [Figs. 4(c) and 4(f)] were visible in both systems. The lumen of the proximal convoluted tubule [marked with the red arrows in Figs. 4(a) and 4(d)] was small, with a brush border on the inner wall and a blurred boundary. The lumen of the distal convoluted tubule [marked with the yellow arrows in Figs. 4(b) and 4(e)] was large and had a clear boundary. Several collecting ducts [marked with the blue arrows in Figs. 4(c) and 4(f)] were visible, and unlabeled nuclei could be seen in the ducts. The results demonstrated the ability of this system to discriminate between cellular and subcellular structures in mouse tissue slices.
![]()
Figure 4.Confocal images of mouse kidney section with a cover slip. (a)–(c) Images obtained from the fiber scanning confocal imaging system. Laser power at the tissue surface: 0.1–0.2 mW. (d)–(f) Images obtained from a commercial confocal imaging system. (a), (d) Proximal convoluted tubules (marked with red arrows). (b), (e) Distal convoluted tubules (marked with yellow arrows). (c), (f) Collecting ducts (marked with blue arrows). The circular structures in the collecting ducts that are not labeled with fluorescence are the nuclei. FOV: approximately
F. Ex vivo Mouse Tissue Imaging
We then imaged the
![]()
Figure 5.Confocal images of
3. CONCLUSION AND DISCUSSION
In summary, we have designed and fabricated a super-simplified fiber scanner that consists of a minimal number of components and enables 2D laser scanning with single-axis actuation. A non-symmetrical fiber was employed to provide an intrinsic difference in bending stiffness, resulting in different natural frequencies for the vibration modes of the cantilever in orthogonal directions. The difference in natural frequencies allowed us to excite the resonance of the fiber cantilever in two orthogonal directions using a single piezoelectric bimorph. The ultra-simplified structure and actuating mechanism of the fiber scanner have led to reduced power dissipation, enhanced stability, and easier manufacturing processes, which enables a miniaturized 1.9-mm-diameter optical probe capable of acquiring confocal images at 5 fps with a low driving voltage of . Confocal imaging in
The use of flexible optical fibers allows the imaging probe to be separated from the light source and the detector, making the probe portable and significantly reduced in size when compared to traditional benchtop microscopes. Optical fibers have been widely employed in different endoscopic techniques, such as confocal endoscopy, multi-photon endoscopy, optical coherence tomography (OCT), and photoacoustic endoscopy (PAE). OCT and PAE can achieve a FOV and up to 62.5 fps frame rate [27–32], but they have relatively low resolution (typically ) with non-specificity [33]. In contrast, confocal endoscopy and multi-photon endoscopy allow sub-micron resolution and specific labeling with a typical FOV of hundreds of microns [1,3,4,34,35]. Multi-photon endoscopy has been applied as head-mounted microscopes for freely moving animals but is currently not available for clinical use. Therefore, confocal endoscopy is the only endoscopic approach that can achieve cellular resolution in clinical practice at present, which can provide
In previous research, fiber bundles have been more commonly used for confocal endoscopy. Instead of fiber bundles, we used a single fiber for confocal endoscopy for the following benefits. First, the lateral resolution of a fiber-bundle-based confocal endoscope is restricted by the fiber bundle’s core spacing (the lateral resolution can be estimated by , where is the diameter of the fiber core, is the magnification of the imaging objective, or 2, which depends on the arrangement of the fiber bundle), making it difficult to achieve a resolution of . In contrast, the lateral resolution of a single-fiber-based confocal endoscope is related to the diameter of the fiber core and the magnification of the imaging objective lens (), which can be approximately 3–4 times better than fiber-bundle-based confocal endoscopes. By designing proper parameters for the imaging objectives, it will be easier for a single-fiber-based confocal endoscope to achieve a resolution of . Second, the FOV of fiber-bundle-based confocal endoscopes is limited by the diameter of the fiber bundles, usually in the range of 240–300 μm for high resolution applications [37]. However, the FOV of a single-fiber-based confocal endoscope is mainly dependent on the scanning range of the fiber cantilever, which can be increased through various ways, such as increasing the length of the fiber cantilever or the piezoelectric bimorph or using a piezoelectric bimorph with higher piezoelectric coefficients. The scanning range of the fiber can also be adjusted by tuning the amplitude of the drive voltage. With the above methods, it is hoped that our probe can achieve a large FOV of in the future. Finally, a single-fiber-based confocal system can also avoid the problems caused by fiber bundles such as pixilation and optical crosstalk during imaging.
Furthermore, since all the components of our probe are low-cost and easy to manufacture, the probe can be made into a disposable consumable for clinical use. The disposable probe will not only improve the time efficiency of endoscopy inspection but will also reduce the risk of cross infection of patients, as the endoscopic probes currently used in clinics need to be cleaned and sterilized for reuse due to their high cost. The concept of the disposable endoscopic probe will contribute to the construction of a more efficient and more affordable medical instrument for minimally invasive
Acknowledgment
Acknowledgment. The authors thank the Optical Bioimaging Core Facility of WNLO-HUST for its support in data acquisition.
APPENDIX A: NATURAL FREQUENCIES OF THE NON-SYMMETRICAL FIBERS
According to Euler–Bernoulli beam theory, the equation for the free vibration of the fiber cantilever can be expressed as [
From Eq. (
Particularly, for a circularly symmetrical fiber cantilever with a homogeneous cross section, the Young’s modulus is a constant, and can be expressed as [
Therefore, the first-order natural frequency of a circularly symmetrical fiber cantilever with a homogeneous cross section can be written as
For a cross section consisting of materials, the bending stiffness and the mass per unit length are given by [
Following Eq. (
The first-order natural frequencies of the vibrations along the -direction and -direction of the panda PMF cantilever can be obtained by substituting Eqs. (
The bow-tie PMF has two bow-tie type SAPs, as shown in Fig.
According to Eq. (
The first-order natural frequencies of the vibrations along the -direction and -direction of the bow-tie PMF cantilever could then be obtained by integrating Eqs. (
The parameters used for the data in Fig.
APPENDIX B: FIBER SCANNER FABRICATION
The main components of the scanner were a piezoelectric bimorph, a panda PMF, and wires. The three-layer piezoelectric bimorph, which contained a carbon fiber layer in the center, had a total thickness of 0.38 mm and dimensions of 1 mm in width by 10 mm in length. The bimorph adopted a parallel structure, and the upper and lower surfaces were coated with conductive layers, which were connected to the positive electrode, and the carbon fiber layer was connected to the negative electrode. The panda PMF was first stripped of its coating layer and placed under a microscope to ensure its end face and two SAPs were visible, as shown in Fig.
![]()
Figure 6.3D model and the engineering drawing of the fiber scanner assembly. (a) 3D model of the fiber scanner assembly. (b) Engineering drawing with dimensions.
APPENDIX C: FINITE ELEMENT ANALYSIS OF VIBRATION MODES OF THE FIBER SCANNER
We numerically simulated the vibration modes of the fiber scanner using the finite element (FE) analysis software ANSYS (Workbench 2020 R1).
The simulation model of the fiber scanner [Fig.
![]()
Figure 7.FE model and modal analysis results. (a) Mesh division of the finite element model of the fiber scanner. (b) The first 20 orders of the vibration modes, in which the first two vibration modes correspond to the transverse vibrations of the fiber cantilever along the
Figures Material Parameters Used in FE AnalysisMaterial Density ( Young’s Modulus ( Poisson’s Ratio Piezoelectric Coefficient ( Relative Permittivity PZT 7750 c Carbon fiber 1750 23 0.307 SAP of fiber 2110 4.22 0.205 Fiber cladding 2200 7.2 0.16 Adhesive 8960 1.3 0.343
APPENDIX D: ANALYSIS OF THE CORRELATION BETWEEN FF AND Nz
We set the fiber cantilever length from 2 to 50 mm in increments of 0.1 mm and calculated the theoretical natural frequencies and at the relevant fiber cantilever lengths using Eqs. (
Taking and as an example, we obtained from Eq. (
![]()
Figure 8.Calculated FF as a function of
APPENDIX E: COMPOSITIONS OF THE ENDOSCOPIC PROBE
The length of the fiber cantilever was 6 mm. A gradient refractive index lens (NEM-100-25-10-860-DS-ST, GRINTECH GmbH) with a diameter of 1.2 mm and a length of 8.09 mm was selected for the imaging objective lens at the tip of the probe. The numerical aperture of the lens on the objective side was 0.5, and the working distance was 250 μm in water. The scanner holder was made of a high-temperature resistant resin material processed with high-precision 3D printing. The probe housing was made of biocompatible 304 stainless steel with machining. The probe housing consists of two pieces: one for the GRIN lens housing and the other for the fiber scanner housing. Each of the two parts of the housing is first assembled with the GRIN lens and the fiber scanner before they were combined together. The fiber scanner and the holder are assembled and fixed by glue during the fabrication of the fiber scanner. The holder is then placed in the probe housing with the fiber centered laterally. The axial distance between the GRIN lens and the fiber scanner is adjusted during imaging. Then, the two parts of the housing are bonded together by glue.
APPENDIX F: CONFOCAL IMAGING SYSTEM SETUP
As shown in Fig.
APPENDIX G: IMAGE RECONSTRUCTION
Before imaging, the position coordinates of the Lissajous trajectory in 30 cycles was predetected using the trajectory detection system and averaged, where to , and is the number of sampling points per cycle. The position coordinates provided an LUT for the image reconstruction. During imaging, the fluorescence intensity at each position was measured using the PMT. To reconstruct images, triangulation-based linear interpolation was performed on the 3D scattered data to obtain the intensity values at the coordinates of the uniform grid points , where correspond to the pixel coordinates.
APPENDIX H: SAMPLE PREPARATION
For the 10-μm fluorescent beads, a polystyrene microsphere solution (F8836, Invitrogen) was taken and diluted 1000 times with anhydrous ethanol. After mixing, a small amount of the solution was dropped onto the slide, and the coverslip was added after the anhydrous ethanol was volatilized. For the
APPENDIX I: FREQUENCY RESPONSE TEST AT DIFFERENT FIBER CANTILEVER LENGTHS
The frequency response curves of the fiber scanner with different fiber cantilever lengths are depicted in Fig.
![]()
Figure 9.Frequency response curves with different fiber cantilever lengths. (a)
References
[38] A. A. Shabana. Theory of Vibration: An Introduction(1996).
[39] W. T. Thomson, M. D. Dahleh. Theory of Vibration with Applications(1997).
[40] O. A. Bauchau, J. I. Craig. Structural Analysis: With Applications to Aerospace Structures(2009).
[41] T. H. G. Megson. Structural and Stress Analysis(2019).
[42] N. P. Bansal, R. H. Doremus. Handbook of Glass Properties(1986).

Set citation alerts for the article
Please enter your email address
© Copyright 2018-2021 | Chinese Laser Press. All Rights Reserved 沪ICP备15018463号-20