
Kexin Wang, Wenhui Yu, Junle Qu, Changrui Liao, Yiping Wang, Jun He, Liwei Liu. Iterative multi-photon adaptive compensation technique for deep tissue two-photon fluorescence lifetime imaging[J]. Chinese Optics Letters, 2024, 22(4): 041702
- Chinese Optics Letters
- Vol. 22, Issue 4, 041702 (2024)
Abstract
Keywords
1. Introduction
Fluorescence lifetime refers to the average amount of time of fluorophores spent on the excited state before falling back to the ground state[1–4]. It can be a useful quantitative sensor of a variety of biophysical and chemical parameters of a microenvironment, including pH, refractive index, and concentration of ion or dissolved gas; therefore, fluorescence lifetime is widely applied in high-throughput drug screening, clinical diagnosis, biochemical reaction research, and other fields[5–9]. One of the challenges is, as with other optical imaging modes, the shallow imaging depth in biological tissues due to the distortion of wavefront and even multiscattering of photons within media having nonuniform refractive index distribution[10,11]. Recently booming techniques of adaptive optics (AO) show great power to overtake the above-mentioned challenge. The AO technique uses active equipment of wavefront modulation to compensate for the wavefront distortion induced by the biological tissues[12–14]. The key role to perform AO is to measure the distorted wavefront, which can be categorized into two main methods[15–17]. The first method is using wavefront sensors, such as the Shack–Hartmann sensor, to directly measure the wavefront[18,19]. Since no additional algorithms should be applied, and because of the fast measurement speed of wavefront sensors, this method can reach high speed and is widely applied in applications where the wavefront is rapidly changed, such as in in vivo imaging. However, because wavefront sensors are composed of arrays of microlenses, the spatial resolution is relatively low, leading to the fact that the method can only be used to sense low aberration modes. For higher aberration mode sensing, another method, using indirect measurement of aberration, can be used. It works, in general, by recording the change in a merit function, usually the intensity of fluorescence light, during wavefront modulation, and finds the best wavefront corresponding to the highest merit function. This indirect wavefront sensing method can not only detect a large number of high-order correction modes, but also possesses an important attribute compared to the direct wavefront measurement, i.e., it can detect the wavefront distortion without the need of penetrating the light wave through tissues, thus opening opportunities to image thick tissues[20].
According to the modulation methods, differences in indirect AO have been proposed. It was not until 2000 that the introduction of AO into microscopy imaging systems to correct for aberrations was first reported. In order to achieve adaptive correction, in 2001, Kam et al.[21] proposed a computational microscopy imaging technique that requires aberrations to be obtained by calculation; however, this method requires high computational power and cannot suppress the diffusion of the focused spot and improve the signal intensity of the sample. In 2002, Sherman et al.[22] implemented adaptive correction using the genetic algorithm (GA), an optimization algorithm based on local search. It starts with an initial solution and gradually improves the quality of the solution by selecting the best solution among the adjacent solutions. In 2012, Tang et al.[23] invented the iterative multi-photon adaptive compensation technique (IMPACT) by using the coherent optical adaptive technique (COAT) developed in AO in the 1970s, which realized the adaptive correction of two-photon fluorescence. IMPACT technology is used to modulate different spatial light modulator (SLM) pixel blocks at different frequencies and uses Fourier transform to extract phases with different modulation frequencies from fluorescence intensity. This phase is then assigned (negative value) to pixel blocks with corresponding frequency for adaptive correction. By iterative approximation, the measurement accuracy of imaging quality and fluorescence lifetime can be continuously optimized. In 2017, Papadopoulos et al.[24] reported a focal scanning aberration probe (F-SHARP) using a focal scanning method for aberration detection. SHARP is a method with large correction mode (an order of magnitude in 1000 modes) and high speed thanks to a modulation mechanism where phase slope is generated by mirror scanning. Another interesting aspect of F-SHARP is that it can perceive amplitude point spread function (APSF, complex value). However, when obtaining a complex light field of a defocus aberration field, it is necessary to use phase shift interference measurement of ultrashort (femtosecond level) pulsed laser, which makes the system very complex and unstable. In 2021, May et al.[25] examined IMPACT and F-SHARP, as well as GA[26], partitioning algorithm (PA), and continuous sequential algorithm (CSA) from a brand-new perspective of mode control optimization process and believed that IMPACT and F-SHARP had the same correction mode but differences in physical implementation[27].
In this paper, we present an AO two-photon fluorescence lifetime imaging microscopy (AO-TP-FLIM) system by using IMPACT adaptive correction technology in a TP-FLIM system to achieve a higher signal-to-noise ratio (SNR) and faster photon accumulation speed. We first introduce the working principle of AO-TP-FLIM, followed by presenting the performance of the proposed method. The imaging results of fluorescent beads embedded in mice brain slices (450 µm thick), different regions of plaques in the complete AD mice brain, and blood vessels in live zebrafish are shown. The results show that after AO correction, the photon accumulation rate and fluorescence lifetime accuracy of two-photon fluorescence lifetime are improved.
2. Results
2.1. Optical setup of AO-TP-FLIM
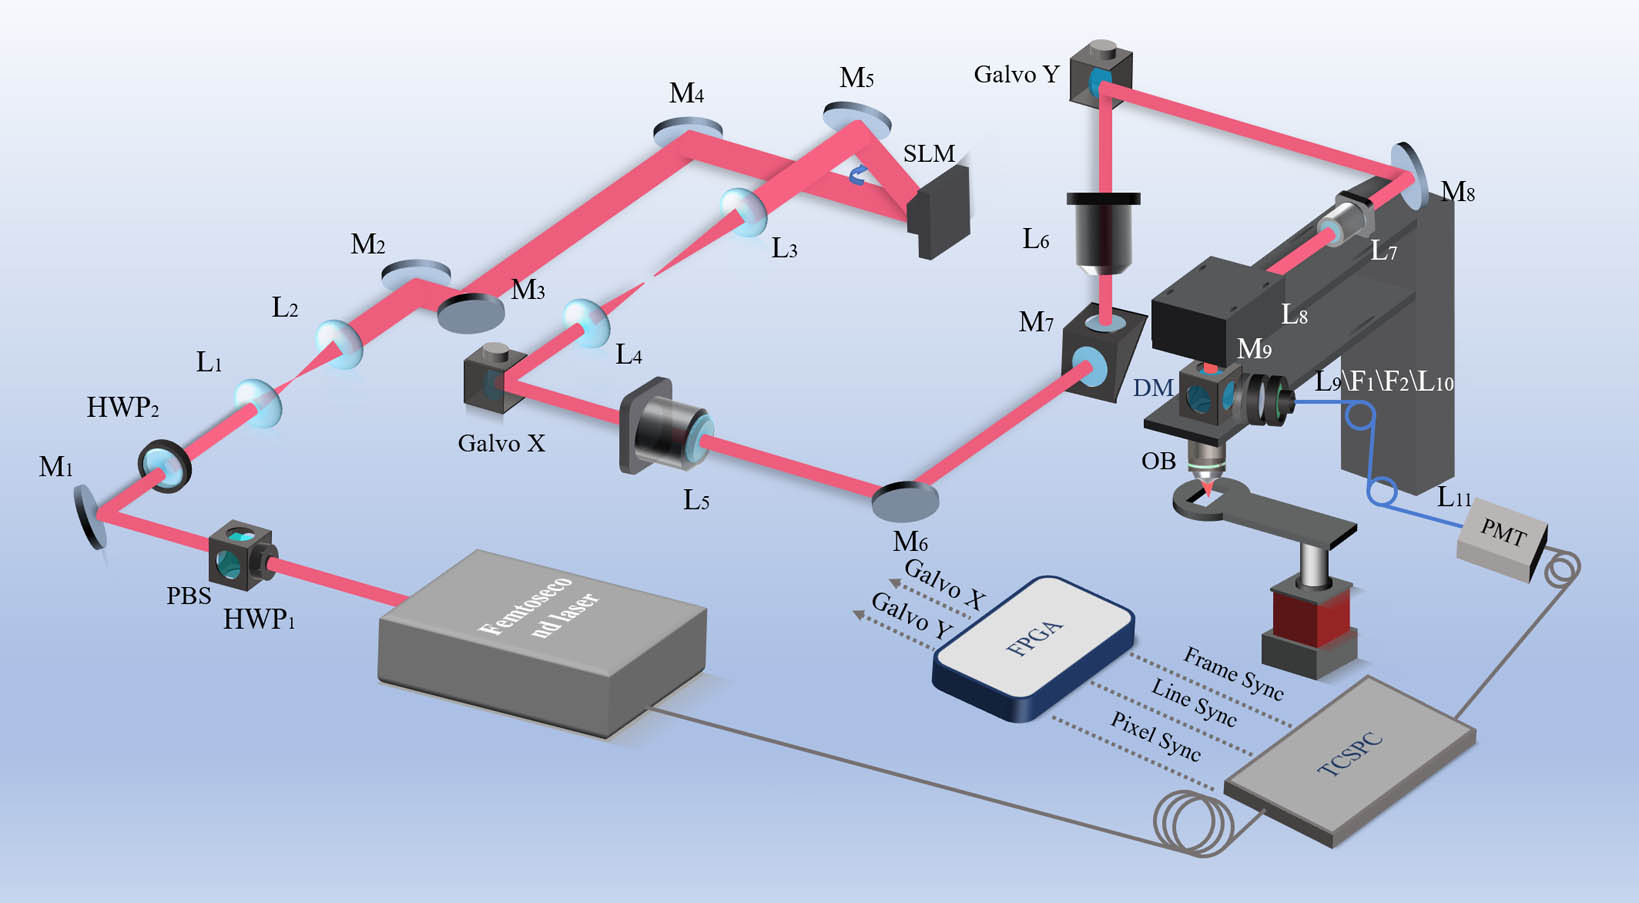
The AO-TP-FLIM system designed and built in this paper is shown in Fig. 1. A femtosecond pulsed laser (Anyang) centered at 920 nm with an average power (1 W) and narrow pulse width (180 fs) was selected for two-photon fluorescence excitation. The repetition rate of the femtosecond pulsed laser is 80 MHz. Femtosecond pulsed light is power-regulated using a half-wave plate (HWP) and a polarization beam splitter (PBS). A telescope composed of lenses () and () was introduced to perform a 5.5-fold beam expansion collimation of incident light, resulting in the spot diameter of the femtosecond laser after beam expansion being close to 10 mm (e−2).
![]()
Figure 1.(a) Schematic of AO-TP-FLIM. HWP, half-wave plate; PBS, polarization beam splitter; M, mirror; L, lens; SLM, spatial light modulator; DM, dichroic mirror; OB, object lens; F, bandpass filter; PMT, photomultiplier tube; FPGA, field programmable gate array; TCSPC, time-correlated single-photon counting.
The expanded beam is reflected to the SLM by a set of mirrors. The purpose of beam expansion is to ensure that the incident laser is as wide as possible on the working surface of the SLM. In order to ensure that the polarization of the incident light is linear, an HWP is placed in front of the SLM, and the polarization state direction is adjusted by rotating the HWP so that it is incident on the SLM according to a certain linear polarization state. Subsequently, a set of systems consisting of lenses () and () is placed after the SLM to conjugate the SLM to the X galvo scanning mirror with a shrink rate of 2 of the beam diameter. Another system consisting of f-theta lenses (effective focal length 110 mm, Thorlabs) and (effective focal length 110 mm, Thorlabs) further conjugates the X galvo mirror to the Y galvo mirror. The outgoing light after passing through the Y scope enters the telecentric system—the scanning lens (dichromatic lens, 75 mm focal length) and tube lens (dichromatic lens, focal length 250 mm, Thorlabs) reach the objective and focus to the sample surface through the objective, which has a numerical aperture (NA) of 0.75. In the detection optical path part, the two-photon fluorescence signal reflected after passing through the sample surface returns to the original path, is collected backward by the excitation objective, and is spectroscopic through the dichroic mirror (DM) in the scanner to filter out the fluorescence outside the focal plane; a combination of short throw lens and bandpass filter (F) is added before the photomultiplier tube (PMT) for nonlinear signal separation. In order to design the system accurately, it is important to ensure that the fluorescence generated by excitation on the sample plane can be accurately measured on the detector plane and fill the field of view (FOV). Fluorescence lifetime imaging is achieved by simultaneously connecting the scan head to the PMT, time-correlated single-photon counting (TCSPC) module, and laser source. Because the trigger signal of the TCSPC acquisition card is based on the excitation light pulse signal, the synchronous trigger signal of the laser needs to be connected to the TCSPC module. During the imaging process, the scanner’s scanning position information and detector’s detection signal need to be synchronously collected and fed back to the TCSPC module for photon counting and fluorescence lifetime image reconstruction.
After the system was built, in order to evaluate the lateral resolution of the system, we chose to use 200 nm fluorescent beads (488/560 nm, f8888, Thermo Fisher Scientific), which is much smaller than the resolution of the microscope system 458 nm (0.383 × 920 nm/0.750.91) for calibration. The results are shown in Figures 2(a) and 2(b). The intensity distribution and Gaussian fitting results of 30 fluorescent beads were statistically analyzed. It can be seen that the resolution of the system was improved from to , which confirms the feasibility of this correction method and is consistent with the expected imaging resolution of the system. We chose commercial fluorescent dye fluorescein sodium solution as a standard sample for measuring fluorescence lifetime. By using the TP-FLIM module for repeated measurements, the results shown in Figures 2(c)–2(f) were obtained. Figure 2(c) shows the phasor plots before and after AO correction, with orange and green representing the lifetime distribution of sodium fluorescein before and after AO correction, respectively. Figure 2(d) shows a comparison of the histograms of the fluorescence lifetime of sodium fluorescein before and after AO correction, with orange and green representing the distribution of fluorescence lifetime histograms before and after AO correction, respectively. Figures 2(e) and 2(f) show the fluorescence lifetime imaging results of sodium fluorescein before and after correction, respectively. As shown in the figure, the fluorescence lifetime of sodium fluorescein solution before and after adaptive correction is about 4 ns, close to its typical value. However, the fluorescence signal intensity after correction has been enhanced compared to before, and a longer SNR fluorescence lifetime result can be obtained after correction.
![]()
Figure 2.Calibration of system resolution. (a) The pink box is the imaging of fluorescent beads before AO correction, and the blue box is the imaging of fluorescent beads after AO correction. (b) System resolution before and after correction (normalized); (c) calibration of fluorescence lifetime and time resolution of AO-TP-FLIM microscopic imaging system. The yellow box (e) is the fluorescence lifetime imaging of sodium fluorescein before AO correction, and the green box (f) is the fluorescence lifetime imaging of sodium fluorescein after AO correction. (d) Comparison of fluorescence lifetime histograms of sodium fluorescein before and after AO correction. The scale is 0.2 µm.
2.2. Application of AO-TP-FLIM in biological samples
To evaluate the imaging performance of the AO-TP-FLIM system, we imaged fluorescent beads under 450 µm thick mice brain tissue slices. The image of the fluorescent beads was obtained using conventional two-photon fluorescence lifetime microscopy. Due to the problem of refractive index mismatch introduced by the brain tissue slice placed between the fluorescent beads and the objective lens, the fluorescence intensity was reduced during two-photon fluorescence lifetime imaging and the full width at half-maximum (FWHM) of the FLIM histogram was enlarged.
During TP-FLIM imaging, it is almost impossible to collect enough photons for fitting in a short time due to the increased thickness of the tissue [Fig. 3(a)]. However, after adaptive correction, it is possible to quickly and accurately locate a single fluorescent bead on the object plane in a shorter time, and the photon accumulation also increases at the same time, as shown in Fig. 3(b). Figures 3(c) and 3(d) show the phasor plots of the fluorescent beads before and after calibration. In two-photon fluorescence imaging, after adaptive correction, the intensity of the fluorescence signal increased by 144% [Fig. 3(e)]. The signal strength of FLIM has increased by about 13 times [Fig. 3(f)], which means that the stability of the measured lifetime has also been improved.
![]()
Figure 3.Fluorescent bead imaging data analysis under 450 µm mice brain tissue. (a) Fluorescence lifetime imaging before AO correction; (b) fluorescence lifetime imaging after AO correction; (c) phase vector map before AO correction; (d) phase vector map after AO correction; (e) fluorescence intensity before and after AO correction (the inset is the phase diagram). (f) Fluorescence lifetime histogram before and after AO correction. The scale is 2 µm.
Further study was carried out to demonstrate the ability of AO-TP-FLIM system to detect and correct aberrations in thick biological samples. The performance of the system was evaluated by comparing the signal differences before and after the correction of the plaques in different regions of the AD mice. First, different regions of plaques inside and outside blood vessels were imaged using the traditional two-photon fluorescence lifetime microscopy system. Since only a ballistic light component is used for excitation in two-photon fluorescence lifetime imaging, the uncorrected plaque signal follows simple exponential decay. Figure 4(a) shows that the lifetime values of plaques inside and outside blood vessels seem to be different. However, due to a low SNR, it is impossible to obtain accurate differences in lifetime between plaques inside and outside blood vessels through traditional fluorescence lifetime measurement. To solve this problem, the AO correction program is used to optimize the image, and the corrected image aberration is compensated, so that more optical power is transmitted to the focus. As shown in Fig. 4(b), after AO correction, the information difference between intravascular and extravascular plaques can be accurately distinguished by fluorescence lifetime under the photon accumulation time of 99 s. The cumulative number of photons is increased to 706 compared with 358 before correction. The fluorescence lifetime data are converted into phasor space, and the changes of fluorescence lifetime before and after correction are analyzed by phasor diagram. As shown in Figs. 4(a) and 4(b), the phasor center coordinates move to the long-life method after correction. The average fluorescence lifetime of extravascular plaque is about 1100 ps [Fig. 4(e)], while the average fluorescence lifetime of intravascular plaque is about 1300 ps [Fig. 4(f)]. Outside the blood vessel, the FWHM of fluorescence lifetime distribution histogram was shortened from 200 to 150 ps. Compared with the uncorrected image, the image obtained by AO correction has improved in signal strength and measurement accuracy.
![]()
Figure 4.Imaging of Aβ plaques in different areas of AD mice. (a) Fluorescence lifetime imaging and phase vector imaging before AO correction, with orange and blue box positions representing plaque areas outside and inside blood vessels, respectively; (b) fluorescence lifetime imaging and phase vector map after AO correction, with pink and green box positions representing the plaque areas outside and inside the blood vessels, respectively; (c) fluorescence intensity of extravascular Aβ plaques before and after AO correction (the inset is the phase diagram); (d) fluorescence intensity of intravascular Aβ plaques before and after AO correction; (e) fluorescence lifetime histogram of extravascular plaques before and after AO correction; (f) fluorescence lifetime histogram of intravascular plaques before and after AO correction. The scale is 10 µm.
The results showed that after AO correction, signal intensity of plaques outside blood vessels was increased by 2 times [Fig. 4(c)], average fluorescence lifetime at this position was about 1300 ps [Fig. 4(e)], signal intensity inside blood vessels was increased by 1 time [Fig. 4(d)], and fluorescence lifetime at this position was about 1100 ps [Fig. 4(f)]. After AO correction, the FWHM of fluorescence lifetime distribution histogram of plaques outside blood vessels was shortened from 200 to 150 ps. Compared with images obtained without correction, images obtained through AO correction showed significant improvement in signal intensity and image quality.
To further explore the advantages of the AO-TP-FLIM system in high aberration media for fine structures, the system was applied to in vivo imaging of zebrafish larvae to test its ability to correct aberrations and scattering in live tissue. In this experiment, the AO-TP-FLIM system was used to obtain the living images of zebrafish larvae 18 days after fertilization. The zebrafish larvae expressing blood vessel s843Tg/+(AB) were selected as samples, which is a gene-coded fluorescent calcium indicator and can mark the blood vessel structure. Subsequently, the area about 200 µm below the surface of the sample was selected for observation. When observed under a traditional two-photon microscope, aberrations and scattering in high-aberration media can affect the clarity of images and the resolution of fine structures. To solve this problem, the image was corrected using the AO-TP-FLIM system. By correcting the image, it was found that weak blood flow signals could also be detected, and the signal intensity increased by 6 times [Fig. 5(e)], which means that the corrected image has significantly improved in displaying vascular structures. In addition to improving the image, fluorescence lifetime information in the corrected image became more accurate. As shown in Fig. 5(f), compared with before correction, the photon accumulation time of fluorescence lifetime in the corrected image was shortened, making the FWHM of the FLIM histogram narrower, from 1184 to 650 ps. This indicates that the corrected image has higher accuracy in fluorescence lifetime measurement.
![]()
Figure 5.In vivo imaging of transgenic zebrafish larvae. (a) Fluorescence lifetime imaging before AO correction; (b) fluorescence lifetime imaging after AO correction; (c) phase vector map before AO correction; (d) phase vector map after AO correction; (e) fluorescence intensity before and after AO correction (the inset is the phase diagram); (f) fluorescence lifetime histogram before and after AO correction. The scale is 10 µm.
3. Conclusion
In this paper, IMPACT was introduced to TP-FLIM for improving the SNR and imaging speed at depth. The advantages of the AO-TP-FLIM system for revealing the fine structures with high aberration modes are obvious. IMPACT can determine the wavefront information by the signal intensity and achieve the compensation of high-order aberrations caused by random scattering. First, by correcting aberrations and scattering in live tissue, not only clear and accurate images can be obtained, but also more information such as blood flow signals and fluorescence lifetime information can be acquired. This is of great significance for biomedical research, which can help to better understand the internal processes of organisms, understand the occurrence and progression of diseases, and provide new ideas and methods for treatment and diagnosis.
In the future, by using fast aberration correction devices, such as high-speed SLM, the speed of the AO-TP-FLIM system can be improved and its application in living animal models can be expanded. By continuously improving and optimizing the AO-TP-FLIM system, it can be applied to more research fields and make greater contributions to biomedical research.
References

Set citation alerts for the article
Please enter your email address
© Copyright 2018-2021 | Chinese Laser Press. All Rights Reserved 沪ICP备15018463号-20