• Photonics Research
  • Vol. 11, Issue 8, A10 (2023)
Kewei Liu1、†, Zihao Wang1、†, Shunyu Yao1, Yanan Guo2、3, Jianchang Yan2、3, Junxi Wang2、3, Changxi Yang1, and Chengying Bao1、*
Author Affiliations
  • 1State Key Laboratory of Precision Measurement Technology and Instruments, Department of Precision Instruments, Tsinghua University, Beijing 100084, China
  • 2Center for Materials Science and Optoelectronics Engineering, University of Chinese Academy of Sciences, Beijing 100049, China
  • 3Research and Development Center for Solid State Lighting, Institute of Semiconductors, Chinese Academy of Sciences, Beijing 100083, China
  • show less
    DOI: 10.1364/PRJ.489942 Cite this Article Set citation alerts
    Kewei Liu, Zihao Wang, Shunyu Yao, Yanan Guo, Jianchang Yan, Junxi Wang, Changxi Yang, Chengying Bao. Mitigating fast thermal instability by engineered laser sweep in AlN soliton microcomb generation[J]. Photonics Research, 2023, 11(8): A10 Copy Citation Text show less
    Fast laser sweep system and thermal characterization of the AlN microcavity. (a) Schematic of the experimental setup. ECDL, external cavity diode laser; SSBM, single-sideband modulator; VCO, voltage controlled oscillator; AFG, arbitrary function generator; PC, polarization controller; MZI, Mach–Zehnder interferometer; FBG, fiber Bragg grating; PD, photodiode; OSA, optical spectrum analyzer; OSC, oscilloscope. (b) Measured frequency noise of the carrier-suppression single-sideband signals with different VCO drive voltages and the original laser. The inset shows their white noise, which increases nearly quadratically with the voltage-to-frequency slope of the VCO. (c) Thermal triangle (blue dots) and corresponding fit (red line) of the AlN microcavity with 19.2 mW on-chip pump power. The gray dashed line represents the cold resonance, and the MZI fringes were used to calibrate the frequency axis. (d) Thermal and Kerr induced resonance shift increases nearly linearly with the on-chip pump power. (e) Experimental scheme for the thermal relaxation time measurement of our AlN microcavity. IM, intensity modulator; VOA, variable optical attenuator; OC, optical coupler. (f) Measured probe laser transmission with a 200 kHz square wave applied on the IM. (g) Extracted probe transmission within the shaded box in panel (f). The two-term exponential fit (red line) gives two dominated thermal relaxation times of 96 ns and 708 ns.
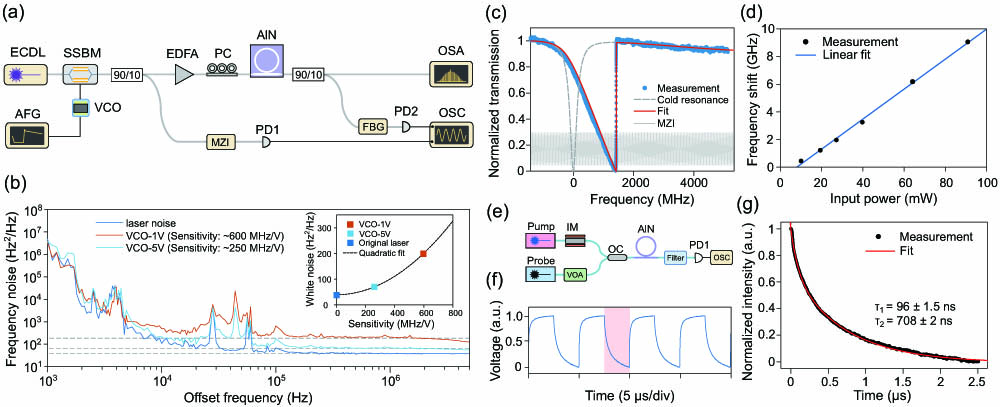
    Fig. 1. Fast laser sweep system and thermal characterization of the AlN microcavity. (a) Schematic of the experimental setup. ECDL, external cavity diode laser; SSBM, single-sideband modulator; VCO, voltage controlled oscillator; AFG, arbitrary function generator; PC, polarization controller; MZI, Mach–Zehnder interferometer; FBG, fiber Bragg grating; PD, photodiode; OSA, optical spectrum analyzer; OSC, oscilloscope. (b) Measured frequency noise of the carrier-suppression single-sideband signals with different VCO drive voltages and the original laser. The inset shows their white noise, which increases nearly quadratically with the voltage-to-frequency slope of the VCO. (c) Thermal triangle (blue dots) and corresponding fit (red line) of the AlN microcavity with 19.2 mW on-chip pump power. The gray dashed line represents the cold resonance, and the MZI fringes were used to calibrate the frequency axis. (d) Thermal and Kerr induced resonance shift increases nearly linearly with the on-chip pump power. (e) Experimental scheme for the thermal relaxation time measurement of our AlN microcavity. IM, intensity modulator; VOA, variable optical attenuator; OC, optical coupler. (f) Measured probe laser transmission with a 200 kHz square wave applied on the IM. (g) Extracted probe transmission within the shaded box in panel (f). The two-term exponential fit (red line) gives two dominated thermal relaxation times of 96 ns and 708 ns.
    Soliton generation using engineered laser sweep methods. (a) Measured comb power change when using the conventional forward only laser sweep. (b) Schematic of the laser sweep waveforms of method-1 and method-2. (c) Measured comb power change when using method-1. When including the additional stage-ii, the soliton step can be elongated but still annihilated in the end. By adding stage-iii, the solitons can be stabilized. (d) Measured comb power change for method-2. When adding stage-ii, the soliton step can be extended to millisecond scale but cannot be fully stabilized. By adding another backward tuning step, the soliton can be stabilized. (e) Soliton spectra for a two-soliton and a two-FSR soliton crystal states generated by method-1 (upper and middle panels) and a single soliton state generated by method-2 (bottom panel). The dashed lines are sech2 fits. DW, dispersive wave. (f) Soliton self-starting test using (i) method-1 and (ii), (iii) method-2. Successful soliton generation and corresponding soliton number are indicated by blue boxes and text. (g) Zoom-in of comb power change for successful generation in (f). The insets show the detailed power change within the soliton step.
    Fig. 2. Soliton generation using engineered laser sweep methods. (a) Measured comb power change when using the conventional forward only laser sweep. (b) Schematic of the laser sweep waveforms of method-1 and method-2. (c) Measured comb power change when using method-1. When including the additional stage-ii, the soliton step can be elongated but still annihilated in the end. By adding stage-iii, the solitons can be stabilized. (d) Measured comb power change for method-2. When adding stage-ii, the soliton step can be extended to millisecond scale but cannot be fully stabilized. By adding another backward tuning step, the soliton can be stabilized. (e) Soliton spectra for a two-soliton and a two-FSR soliton crystal states generated by method-1 (upper and middle panels) and a single soliton state generated by method-2 (bottom panel). The dashed lines are sech2 fits. DW, dispersive wave. (f) Soliton self-starting test using (i) method-1 and (ii), (iii) method-2. Successful soliton generation and corresponding soliton number are indicated by blue boxes and text. (g) Zoom-in of comb power change for successful generation in (f). The insets show the detailed power change within the soliton step.
    Simulations of soliton generation dynamics with two thermal relaxation processes. (a) Intracavity field dynamics when sweeping the laser in a conventional way. (b) Corresponding changes of intracavity power and effective detuning δωeff. (c) Analysis of the resonance shift induced by two thermal relaxation processes shows that the thermal recoil is induced by the second thermal process. (d) Intracavity field dynamics when using method-1 for laser sweep. (e) Simulated change of intracavity power and δωeff. (f) Change of the thermally induced resonance shift in laser sweep. (g) Intracavity field dynamics when using method-2 for laser sweep. (h) Simulated change of intracavity power and δωeff for method-2. (i) Thermally induced resonance shift in generation for method-2.
    Fig. 3. Simulations of soliton generation dynamics with two thermal relaxation processes. (a) Intracavity field dynamics when sweeping the laser in a conventional way. (b) Corresponding changes of intracavity power and effective detuning δωeff. (c) Analysis of the resonance shift induced by two thermal relaxation processes shows that the thermal recoil is induced by the second thermal process. (d) Intracavity field dynamics when using method-1 for laser sweep. (e) Simulated change of intracavity power and δωeff. (f) Change of the thermally induced resonance shift in laser sweep. (g) Intracavity field dynamics when using method-2 for laser sweep. (h) Simulated change of intracavity power and δωeff for method-2. (i) Thermally induced resonance shift in generation for method-2.
    Requirement of laser sweep speed for mitigating thermal instability. (a) Simulated upper and lower limits of laser end detuning versus the stage-i scan time. The shaded region is the SER without considering thermal effects. (b) Minimum laser scan speed for stage-i and backward tuning stage-ii versus the stage-i scan time. The intersect can be regarded as the minimum scan speed. (c) Calculated minimum laser scan speed versus thermal relaxation time with different thermal strengths.
    Fig. 4. Requirement of laser sweep speed for mitigating thermal instability. (a) Simulated upper and lower limits of laser end detuning versus the stage-i scan time. The shaded region is the SER without considering thermal effects. (b) Minimum laser scan speed for stage-i and backward tuning stage-ii versus the stage-i scan time. The intersect can be regarded as the minimum scan speed. (c) Calculated minimum laser scan speed versus thermal relaxation time with different thermal strengths.
    Kewei Liu, Zihao Wang, Shunyu Yao, Yanan Guo, Jianchang Yan, Junxi Wang, Changxi Yang, Chengying Bao. Mitigating fast thermal instability by engineered laser sweep in AlN soliton microcomb generation[J]. Photonics Research, 2023, 11(8): A10
    Download Citation