• Chinese Optics Letters
  • Vol. 22, Issue 4, 043401 (2024)
De Wang1、2, Hong Yu1、2、3、*, Zhijie Tan1, Ronghua Lu1, and Shensheng Han1、2、3
Author Affiliations
  • 1Key Laboratory of Quantum Optics, Shanghai Institute of Optics and Fine Mechanics, Chinese Academy of Sciences, Shanghai 201800, China
  • 2Center of Materials Science and Optoelectronics Engineering, University of Chinese Academy of Sciences, Beijing 100049, China
  • 3Hangzhou Institute for Advanced Study, University of Chinese Academy of Sciences, Hangzhou 310024, China
  • show less
    DOI: 10.3788/COL202422.043401 Cite this Article Set citation alerts
    De Wang, Hong Yu, Zhijie Tan, Ronghua Lu, Shensheng Han. Angle measurement of pulsars based on spatially modulated X-ray intensity correlation[J]. Chinese Optics Letters, 2024, 22(4): 043401 Copy Citation Text show less
    Illustration for the method of measuring the observing angle of a pulsar based on SMXIC.
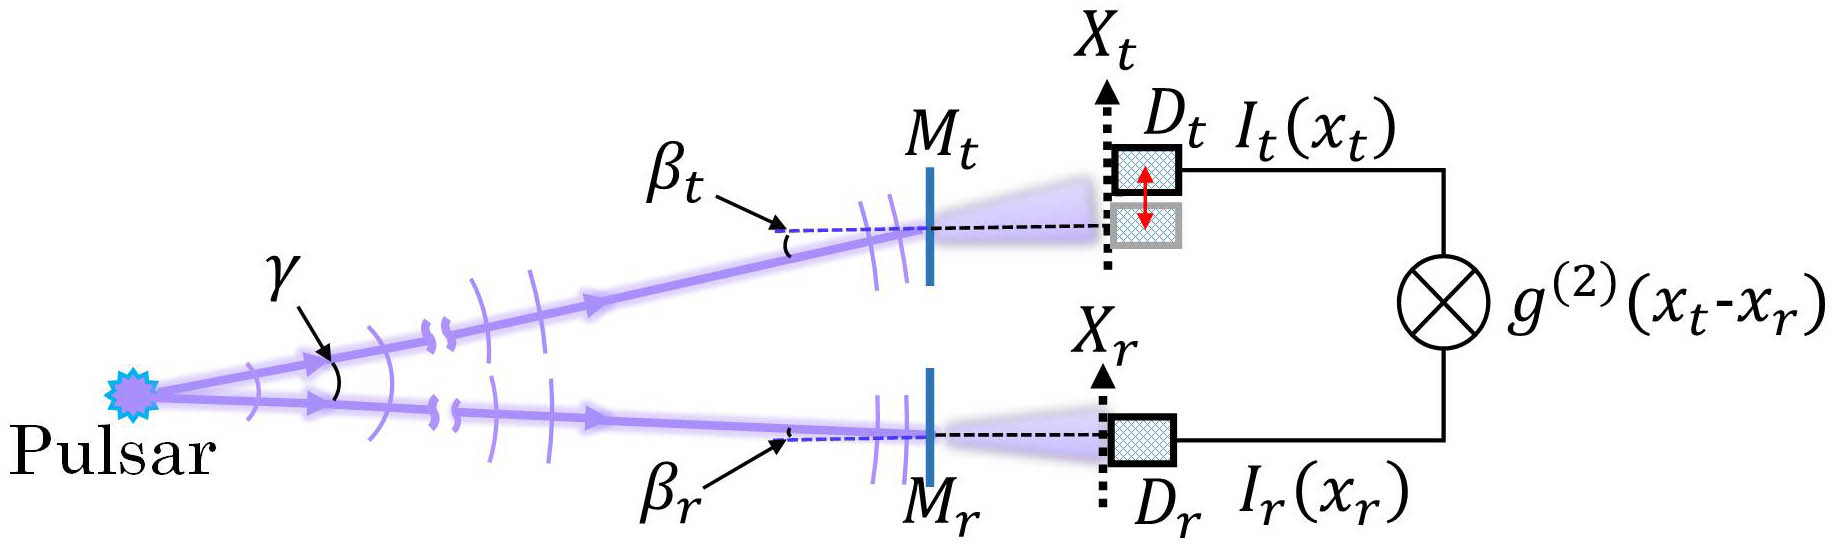
    Fig. 1. Illustration for the method of measuring the observing angle of a pulsar based on SMXIC.
    Experimental scheme for the angle measurement based on SMXIC. (a) Schematic setup for the X-ray experiment. (b) Example of the intensity distribution pair Ir(xr) and It(xt) recorded in the experiment. (c) Process of the scanning measurement.
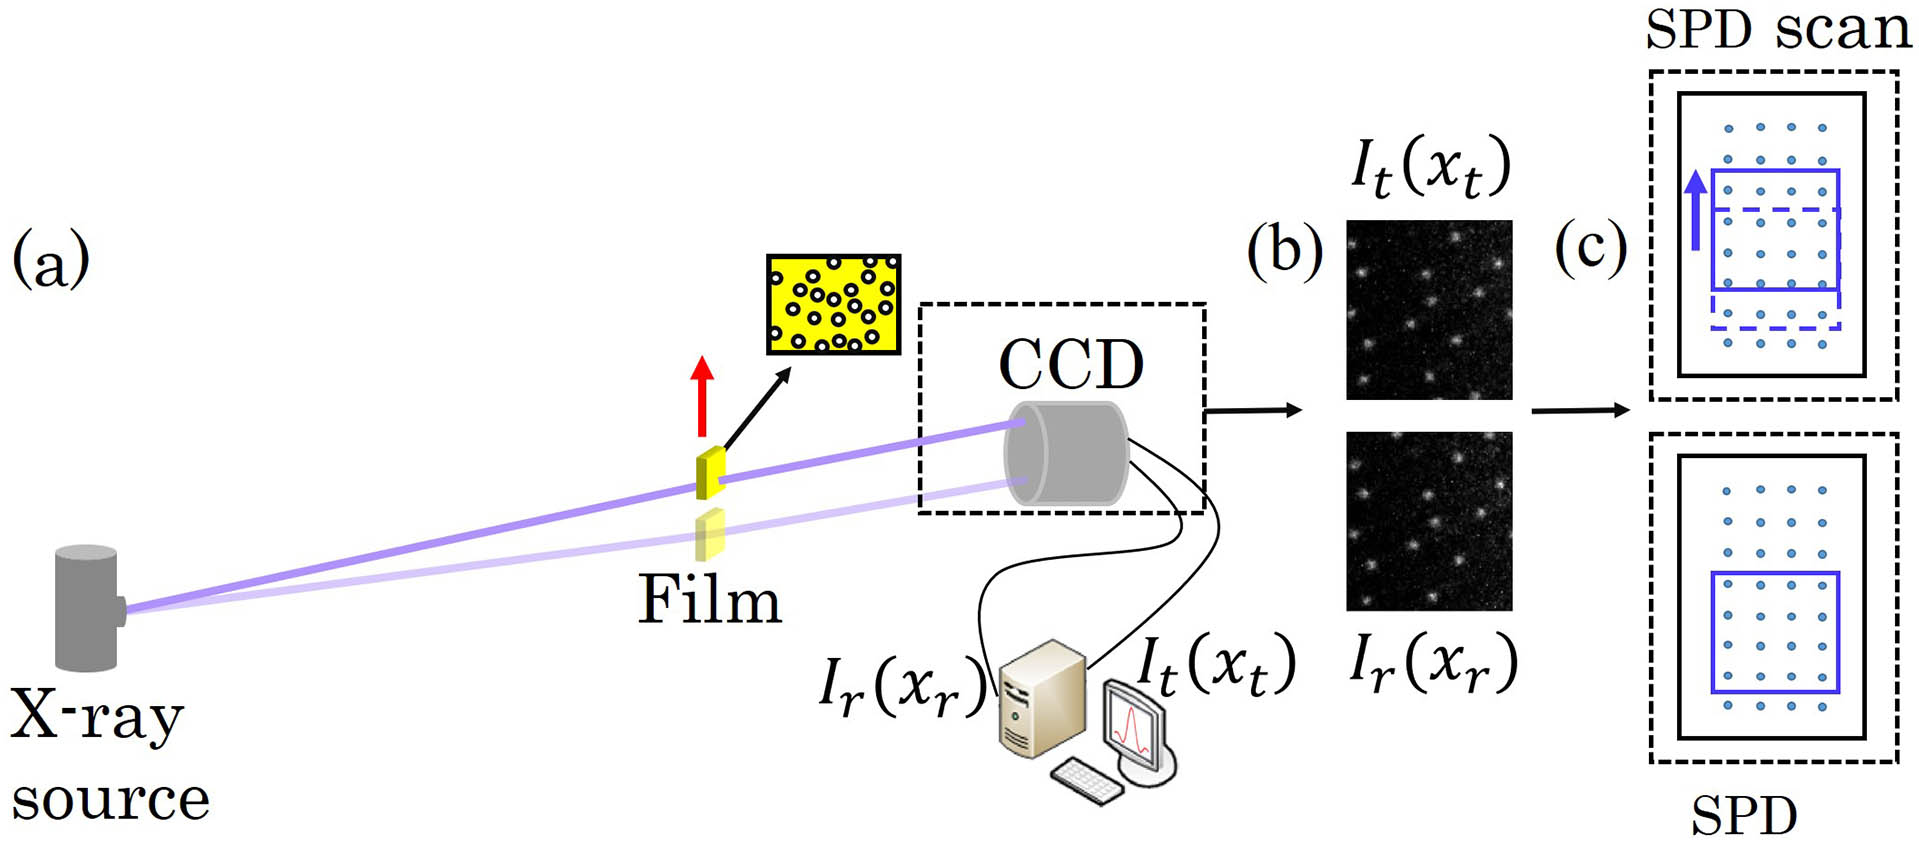
    Fig. 2. Experimental scheme for the angle measurement based on SMXIC. (a) Schematic setup for the X-ray experiment. (b) Example of the intensity distribution pair Ir(xr) and It(xt) recorded in the experiment. (c) Process of the scanning measurement.
    Experimental results for γ = 0. The dots are the intensity correlation data obtained in the experiment. The solid and dashed lines are the experimental fitting curve and the theoretical curve, respectively. The peak position of the experimental fitting curve is marked by Δxp.
    Fig. 3. Experimental results for γ = 0. The dots are the intensity correlation data obtained in the experiment. The solid and dashed lines are the experimental fitting curve and the theoretical curve, respectively. The peak position of the experimental fitting curve is marked by Δxp.
    Experimental results of six different observing angles. The asterisks and solid lines are the experimental data and the corresponding fitting curves obtained at different angles. The dashed lines mark the peak positions of the curves.
    Fig. 4. Experimental results of six different observing angles. The asterisks and solid lines are the experimental data and the corresponding fitting curves obtained at different angles. The dashed lines mark the peak positions of the curves.
    Measurement accuracy of different angles. The solid line with error bars shows the measuring results of six angles, and the dashed line is the theoretical value.
    Fig. 5. Measurement accuracy of different angles. The solid line with error bars shows the measuring results of six angles, and the dashed line is the theoretical value.
    Influence of the position shift error and the distance measurement error on the angle measurement accuracy.
    Fig. 6. Influence of the position shift error and the distance measurement error on the angle measurement accuracy.
    Measured Angle (arcsec)
    Angle (arcsec)Measurement 1Measurement 2Measurement 3Measurement 4Measurement 5
    γ1 = 1.51.421.461.551.421.42
    γ2 = 3.02.903.252.962.972.82
    γ3 = 4.54.384.984.514.434.35
    γ4 = 6.05.886.265.975.905.72
    γ5 = 7.57.267.897.167.357.35
    γ6 = 9.08.509.418.588.858.53
    Table 1. Results of Five Repeated Measurements for Six Angles
    De Wang, Hong Yu, Zhijie Tan, Ronghua Lu, Shensheng Han. Angle measurement of pulsars based on spatially modulated X-ray intensity correlation[J]. Chinese Optics Letters, 2024, 22(4): 043401
    Download Citation