
Yanlei SHI, Niefeng SUN, Chengyan XU, Shujie WANG, Peng LIN, Chunlei MA, Senfeng XU, Wei WANG, Chunmei CHEN, Lijie FU, Huimin SHAO, Xiaolan LI, Yang WANG, Jingkai QIN. Thermal Field of 6-inch Indium Phosphide Single Crystal Growth by Semi-sealed Czochralski Method [J]. Journal of Inorganic Materials, 2023, 38(3): 335
- Journal of Inorganic Materials
- Vol. 38, Issue 3, 335 (2023)
Abstract
In recent years, InP single crystal substrates have found important applications in optoelectronic devices (communication lasers, detectors, high-efficiency solar cells, etc.) and electronic devices (high electron mobility transistor and heterojunction bipolar transistors, etc.)[1⇓⇓⇓-5]. However, the low yield and high price of InP single crystal substrate have severely limited its application and promotion. Reducing the cost of materials by increasing the crystal size is the dominant pathway in the development of semiconductor materials. The main preparation methods for commercial InP substrates are Liquid Encapsulated Czochralski (LEC) and Vertical Gradient Freeze (VGF), and each method has its advantages and disadvantages[6]. In InP crystal growth, the main cause of dislocation formation is excessive thermal stress inside the crystal, which leads to lattice slip. Therefore, there are two main methods to reduce or even eliminate dislocations: 1) sharp decrease of the temperature gradient within the crystal; 2) impurity hardening of the lattice to increase the critical shear stress in the crystal[7].
The LEC method provides a high yield of InP single crystals. However, due to the high temperature gradients in the melt and crystals during growth and cooling, the thermal stress and defect density of the crystals are high.
The VGF method has not succeed in preparing InP crystals with a diameter of 6 inches and above. The LEC method has intrinsic advantage in preparing large-diameter crystals. Improving the LEC method to reduce its thermal stress and dislocation density is the main way for many practitioners to prepare large size indium phosphide. 6-inch indium phosphide single crystals were prepared by Iwasaki, et al[8]. using a modified LEC method (hot-wall method). Shao, et al.[9] prepared 6-inch Fe doped indium phosphide single crystals by adjusting the thermal field structure using the LEC method. The main improvement direction of the conventional CZ and LEC methods is to increase the temperature around the crystal. This is usually done by adding insulation or heating devices around the crystal, thus increasing the surface temperature of the crystal, reducing the temperature gradient inside the crystal and reducing the thermal stress. However, unlike elemental semiconductor crystals, indium phosphide crystals are prone to dissociation at high temperatures. Therefore, the temperature around the crystal cannot be increased indefinitely. In the 1990s, Kohiro conducted a study on the growth of single crystals of indium phosphide by the VCZ method. They mainly focused on Fe doped crystals and prepared 3-inch Fe-doped indium phosphide crystals with dislocation density between 4×10³-8×103 cm-2. The dislocation density was reduced by one order of magnitude compared to the conventional LEC method[10⇓⇓-13].
Noda, et al[14] grew 4-inch Fe doped and S doped InP crystals using the PC-LEC method. By controlling the solid/liquid (S-L) interface shape, the dislocation density of 4-inch S-doped InP crystals was reduced to less than 2.5×103 cm-2 at the shoulder and less than 7×102 cm-2 at the tail. 3-inch Fe doped indium phosphide dislocation density was less than 5×102 cm-2, and 4-inch Fe doped InP crystals dislocation density was less than 5×103 cm-2.
The axial temperature gradient above the melt is less than 35 K/cm in the PC-LEC method, which is much lower than that in the conventional LEC method (100- 130 K/cm). However, the structure of the conventional VCZ and PC-LEC methods is complicated and always displays a lower yield compared with LEC.
Semi Sealed Czochralski (SSC) is a new crystal growth method with simple structure and flexible operation. It enables different insulation and gas pressure retention measures for crystals at different crystal growth stages. The SSC method was invented by our group and reported for the first time in this paper. The influence of SSC method on thermal field mode is not well understood before. In this study, the SSC method and the LEC method were simulated and compared using simulation techniques. The advantages of the SSC method in growing large diameter indium phosphide crystals were investigated in terms of temperature distribution and temperature gradients around the melt, crystal and atmosphere.
1 Experimental
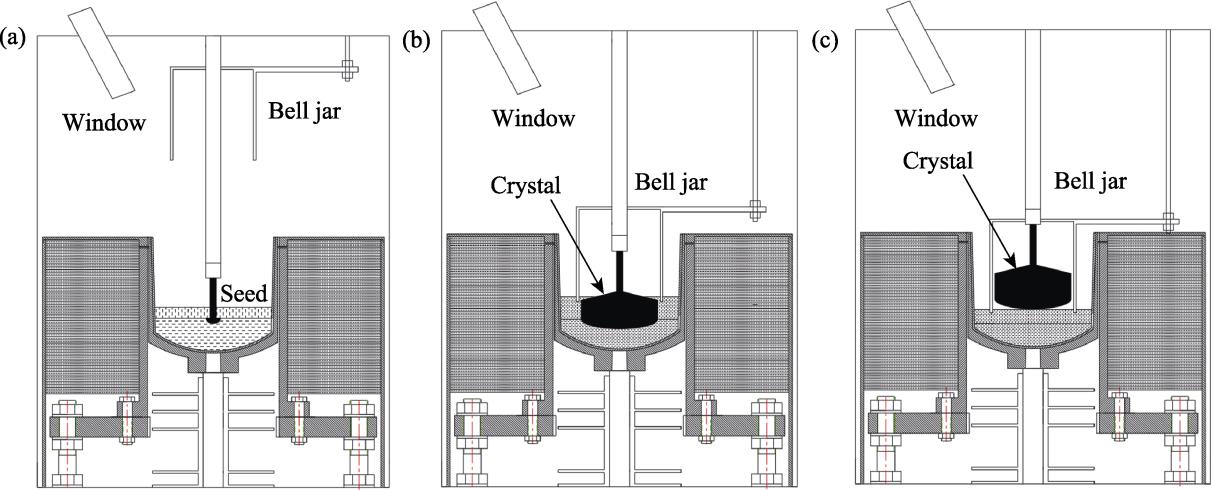
SSC method is a new crystal growth method. By flexible operation, the aim of reducing thermal stress is achieved in the case of high InP crystal yield and no dissociation. The difference between SSC and LEC is that in the SSC method there is a bell jar that can be moved up and down above the crucible and the seed, preventing heat dissipation and dissociation of the crystal(Fig. 1). The holding bell jar is driven by a manipulator. During the seeding and shoulder stage, the bell jar is positioned higher above the thermal field. When the seeding and shoulder stages finish and the crystal shoulder is pulling out of the B2O3, the bell jar is gradually lowered so that the bell jar is in contact with the B2O3. During the diameter control stage, the bell jar is moved down to ensure the contact between the bell jar and B2O3. When crystal growth is complete, the crystal is lifted and a slow cool down is performed inside the holding bell jar.
![]()
Figure 1.Schematic of the processes of semi-sealed Czochralski method(a) Seeding and shoulder stage; (b) Diameter-controlling stage; (c) Crystal raised from the melt
The thermal fields of the SSC, VCZ and LEC were simulated using STR's CGSim software. The boundary conditions of the furnace, the thermal conductivity models at the solid/gas and liquid/gas interfaces, the structure and materials of the main heater, the lower heater, the seed rods and the crucible rods were kept consistent in the simulations of the three methods. The thermal fields in the seeding stage were simulated with software, and the melt temperature distributions at the solid-liquid interface front for crystals grown by the three methods were compared. The temperature distributions in the crystal, in the melt around the crystal, in the B2O3 and in the atmosphere were simulated for both SSC and LEC methods during the diameter control stage. The identical growth conditions were set in different methods with crystal diameter of 160 mm, pulling rate of 5 mm/h, a crystal length of 80 mm, crystal rotation of 10 r/min, and a crucible rotation of -15 r/min. The 6-inch InP single crystals were prepared by the LEC and SSC methods using a homemade InP crystal furnace apparatus, respectively, and the experimental conditions were consistent with the simulated conditions.
2 Results and Discussion
2.1 Temperature distribution at the front of solid-liquid interface during the seeding stage
Indium phosphide is a sphalerite structural material with {111} low-energy facets. According to the position and characteristics of twins, it is known that the growth mode of indium phosphide is mainly a two- dimensional nucleation mechanism. According to the two-dimensional nucleation theory, the microscopic growth direction of the crystal is perpendicular to the dense row surface {111}. According to the destabilization criterion of crystal growth, it is known that when the crystal growth rate is certain, the temperature gradient Gl situation at the front of the solid-liquid interface is the main factor to determine whether the crystal can grow smoothly. Therefore, for direct pull crystal growth, the temperature distribution and temperature gradient around the crystal has very strong influence on the stability of crystal growth during the induced crystal phase. Therefore, we focused on simulating 3 cases, as shown in Fig. 2. Fig. 2(a-c) show the thermal field cases of the seeding stages in SCC, VCZ and LEC methods, respectively.
![]()
Figure 2.Thermal field distributions in the seeding stages with different methods(a) SSC method; (b) VCZ method; (c) LEC method
Fig. 2(a) shows the isotherm distribution around the crystal during the seeding stage in the SSC method, which is similar to the isotherm distribution around the crystal in the LEC method shown in Fig. 2(c). Fig. 2(b) shows the isotherm distribution around the crystal introduction phase in the VCZ method, which is abnormal, and negative temperature gradients may appear in the melt around the early cone crystal.
Along the normal to the low-energy facets of the crystal and pointing in the direction of the melt, 100 points are selected uniformly in a 10 mm range (as shown in Fig. 3(a)). The distance from the crystal is used as the horizontal axis and the temperature value is used as the vertical axis for plotting, as shown in Fig. 3(b). The SSC curve (dashed blue) in Fig. 3(b) shows that the temperature distribution of the induced crystal phase with the bell jar over the furnace in the SSC method almost coincides with the temperature distribution curve of the LEC method (red) in the presence of a positive temperature gradient at the front of solid-liquid interface. As shown in the black curve in Fig. 3(b), the melt temperature gradient at the front of solid-liquid interface is negative in the VCZ method. For single crystal growth, a large positive temperature gradient in the melt is expected. Negative temperature gradients can lead to melt subcooling, twining and polycrystallization. This is consistent with the actual process, and the VCZ method is more prone to twinning and even polycrystallization at the seeding stage. In VCZ method, the bell jar always covers the melt during the whole crystal growth stage, which fundamentally reduces the heat exchange in the seeding and shoulder stages. Moreover, the seed, seed rod and seed chuck are kept at a high temperature in the bell jar. As a result, the speed of heat conduction of the seed is significantly lower than that of the LEC method due to the reduced temperature difference. The seed can’t conduct away the latent heat of crystallization generated at the solid-liquid interface quickly. The heat dissipation from the melt surface around the crystals is stronger than that of the seed and small crystal, as is shown in Fig. 3(c).
![]()
Figure 3.Temperature distribution in the melt at the front of the solid-liquid interface(a) Sampling position in the melt; (b) Temperature distribution in the melt at the front of solid-liquid interface; (c) Schematic of heat flow in VCZ method
So there is a negative temperature gradient, at the front of the solid-liquid interface.
2.2 Temperature distribution in crystals during diameter control growth stage
The temperature gradient in the axial direction in the crystal is the most important factor affecting the defect removal in the crystal. The larger the temperature gradient in the crystal is, the higher the defect density is. Usually the internal temperature distribution during crystal growth cannot be measured precisely, while the temperature distribution inside the crystal can be easily obtained by simulation. As shown in Fig. 4(a), 100 points are uniformly selected along the central axis of the crystal from the front end of the solid-liquid interface to the intersection of the crystal and the seed crystal, and the temperature values are plotted as the vertical axis to obtain Fig. 4(b).
![]()
Figure 4.Temperature distribution in the crystal(a) Schematic diagram of the temperature sampling points in the crystal; (b) Temperature distribution in the crystal from the solid-liquid interface to the seed-crystal interface
As shown in Fig. 4(b), the temperature gradient of the crystals in the SSC method is about 17.4 K/cm, while the absolute value of the temperature gradient of the conventional LEC method is significantly larger, about 27.8 K/cm. These results indicate that both the SSC methods are effective in reducing the temperature gradient in the crystal compared to the conventional LEC method.
2.3 Temperature of the melt, B2O3 and atmosphere in the diameter control stage
For the pulling method, the temperature distribution of the melt, the B2O3 and the atmosphere around the crystal directly affects the temperature of the crystal. Encapsulation of B2O3 is used in the growth of InP single crystals to prevent the dissociation of the indium phosphide melt and the dissipation of heat from the crystal. Temperature gradients in VCZ, PC-LEC and LEC methods have been investigated in the studies by Oda and Noda, et al[10⇓⇓⇓-14]. Their study concluded that the axial temperature gradient in the melt, boron oxide and atmosphere is the key factor that most affects the stress and crystalline quality of the crystal, so the axial temperature distribution is the focus of the study. The temperature gradient inside the crystal can be informed by the results of numerical simulations. In the simulation results of this study, the temperatures of 100 points were taken uniformly at a distance of 2 mm from the crystal surface starting 10 mm below the melt level and 80 mm upward along the vertical length (the sampling locations are shown in Fig. 5(a)). The results were shown in Fig. 5(b), and the overall trend of temperature was decreasing, so the temperature gradient was negative.
![]()
Figure 5.Temperature distribution in the melt, B2O3 and atmosphere around the crystal(a) Location of sampling points; (b) Comparison of temperature distributions by using different methods
As shown in Fig. 5(b), in the melt, the temperatures in the LEC and SSC methods are close to each other. In the B2O3 and atmosphere, the temperature profile of SSC is above, and the temperature at each position is higher than the temperature profile of the LEC method. Both curves have several distinct nodes, and most lines between the nodes are approximately straight. Based on these characteristics of the temperature distribution curves, the temperature curves can be divided into several sections that are close to a straight line and approximated as a straight line, so that the temperature gradients of several methods at several locations can be compared more intuitively and quantitatively. The locations of the fold points in Fig. 5(b) are, from left to right, node 1, node 2, node 3, and node 4.
Based on the correlation between the locations of the simulated graph and the nodes, it can be easily known that node 1 is the intersection of the melt and the B2O3, while node 2 is the intersection of the B2O3 and the atmosphere. The reason for node 3 is the high temperature gradient of the sharp drop in temperature within 3 mm on the B2O3, followed by a flatter temperature gradient beyond 3 mm, is due to the more pronounced gradient difference. The reason for node 4 is due to the fact that the temperature sampling line in this section is higher than the crystal. The temperature points are farther away from the crystal, which is the "heat source", so the temperature drops sharply. The temperature curve is divided into several sections by 4 nodes: melt section, B2O3 section, gas 1 section, gas 2 section and gas 3 section.
Based on the node temperatures and spacing of the curves, the temperature gradient of the section can be calculated relatively easily. The two curves, with node locations, temperatures and temperature gradients for each section, are shown in Table 1.
| Method | Item | Melt | B2O3 | Gas 1 | Gas 2 | Gas 3 | |
|---|---|---|---|---|---|---|---|
| Node | Start point | Node 1 | Node 2 | Node 3 | Node 4 | End point | |
| Distance/mm | 0.0 | 11.0 | 52.0 | 55.0 | 70.0 | 76.0 | |
| SSC | Temperature/K | 1340.0 | 1338.1 | 1221.4 | 1190.7 | 1185.8 | 1148.4 |
| Temperature gradient/(K·mm-1) | -0.2 | -2.8 | -10.2 | -0.3 | -6.2 | ||
| LEC | Temperature/K | 1344.5 | 1340.3 | 1127.6 | 877.7 | 808.7 | 644.4 |
| Temperature gradient/(K·mm-1) | -0.4 | -5.2 | -62.5 | -6.9 | -16.4 | ||
Table 1.
Location, temperature and temperature gradient of each section
In general, in the melt section, the temperature gradient is low for both methods, mainly because of the strong convection in the high temperature melt tends to homogenize the temperature.
The temperature gradient in the melt is about -0.2 K/mm in the SSC method and -0.4 K/mm in the LEC method.
In the B2O3 section, the temperature gradient is -2.8 K/mm in the SSC method and -5.2 K/mm in the LEC method, where the temperature gradient of B2O3 is significantly higher in the LEC method. In both methods, the temperature of node 2 is 1221.4 and 1127.6 K, respectively, and the temperature of node 2 in the LEC method is significantly lower than that in the SSC method.
In the gas 1 section, the temperature gradient was -10.2 K/mm in the SSC method, and -62.5 K/mm in the LEC method.
In the gas 2 section, the temperature gradient is -0.3 K/mm for the SSC method and -6.9 K/mm for the LEC method. Temperatures of node 3 are 1190.7 and 877.7 K for the SSC method and the LEC method, respectively. The atmospheric temperature of node 3 in the SSC method is 313 K higher than that of the LEC method, respectively.
The decompression effect of SSC is mainly in the atmospheric region. In the SSC method, the atmospheric temperature around the crystal is higher, mainly because the quartz shield forms a relatively closed space around the crystal, which reduces the convection between the atmosphere and the outside, and thus retains heat. And, in the SSC method, the size of the heat shield is usually determined by the diameter of the crystal, with the shield and the B2O3 forming a smaller, closed area. Within this limited area, the main "heat source" crystal can heat the atmosphere in the smaller area to a higher temperature.
In the gas 3 section, the temperature gradient is -10.2 K/mm in the SSC method and -62.5 K/mm in the LEC method. The temperature at the end of the gas 3 section (about 10 mm above the crystal) is 1148.4 and 644.4 K for two methods, respectively, and is 504 K higher in the SSC method than in the conventional LEC method.
2.4 Quality analysis of 6-inch indium phosphide single crystals
The 6-inch indium phosphide single crystals were grown by the same process using the LEC and SSC methods for comparison. The indium phosphide single crystals grown by LEC method showed cracking, as shown in Fig. 6(a). The surface of the indium phosphide single crystal grown by SSC method is bright, and there is no cracking, as shown in Fig. 6(b). The indium phosphide single crystal grown by the LEC method was cut and a 6-inch cut sheet was taken, as shown in Fig. 6(c), and the crack extension direction was found to be roughly along the <011> crystallographic direction.
![]()
Figure 6.Digital photographs of 6-inch InP crystal and cutting wafer(a) LEC-grown InP crystal; (b) SSC-grown InP crystal; (c) Cracked cutting wafer of LEC-grown crystal
The wafers prepared by both methods were polished, etched using Huber etching solution, and observed under a microscope. The dislocation densities of the crystal tails were determined to be 4×10⁴and 1×104 cm-2 for the LEC and SSC methods, respectively (Fig. 7).
![]()
Figure 7.Dislocation densities of crystal tails by LEC and SSC methods(a) Crystal dislocation density by LEC method; (b) Crystal dislocation density by SSC method
3 Conclusions
The characteristics of SSC method and LEC method were analyzed by means of simulation. And the simulation results were verified by experiments and summarized as follows:
1) The SSC and LEC methods have similar positive melt temperature gradients in the crystal-introduction stage, so they have higher growth stability.
2) The crystal temperature gradient in the SSC method is significantly lower than that in the LEC method during the diameter control growth stage.
3) The temperature distributions in the melt, B2O3 and atmosphere in the two methods were compared. The temperature of the atmosphere near the crystal shoulder in the SSC method is 504 K higher than that in the LEC method.
4) The 6-inch N-type InP single crystal prepared by the SSC method is free of dissociation and cracks and has a lower dislocation density compared to the LEC method.
References
[1] H HAMADA, T TSUTSUMI, H SUGIYAMA et al. Millimeter- wave InP Device technologies for ultra-high speed wireless communications toward beyond 5G. Proceedings of IEEE International Electron Devices Meeting (IEDM), San Francisco(2019).
[4] S WANG. Recent research progress of THz InP HEMT and HBT technologies. Micronanoelectronic Technology, 381(2018).
[9] H SHAO, N SUN, X ZHANG et al. High quality 6-inch InP single crystal grown by LEC method. Semiconductor Technology, 617(2020).
[13] Y HOSOKAWA, Y YABUHARA, R NAKAI et al. Development of 4-inch diameter InP single crystal with low dislocation density using VCZ method. 10th Intern. Conf. on Indium Phosphide and Related Materials, Tsukuba(1998).
[14] A NODA, K SUZUKI, A ARAKAWA et al. 4-inch InP crystals grown by phosphorous vapor controlled LEC method. 14th Indium Phosphide and Related Materials Conference, Stockholm(2002).

Set citation alerts for the article
Please enter your email address
© Copyright 2018-2021 | Chinese Laser Press. All Rights Reserved 沪ICP备15018463号-20