
A. Garhwal, A. E. Arumona, P. Youplao, K. Ray, I. S. Amiri, P. Yupapin. Human-like stereo sensors using plasmonic antenna embedded MZI with space–time modulation control [Invited][J]. Chinese Optics Letters, 2021, 19(10): 101301
- Chinese Optics Letters
- Vol. 19, Issue 10, 101301 (2021)
Abstract
1. Introduction
Stereo sensors are three-dimensional (3D) sensors. The basic principle of a stereo sensor is that, when two inputs are applied in the sensor system, the final output is the multiplexing of both signals. On this principle, a stereo sensor model was presented using two microring resonators along the center ring, which are mirror images[
The 3D sensors found in the literature are as follows. One of them is for applications in human body gesture recognition. This uses biometric recognition based on the user adaption learning method. The experiment was performed in a laboratory with seven different gestures. This technique was found to be superior to the conventional recognition method. The traditional method is based on the fixed body skeleton without user adaption[
Another 3D printed strain-gauge sensor was presented for application in micro force sensors. Two sensors were designed, one for the range of 0 to 2.5 nmol/L and another for the range of 0 to 120 nmol/L. The force sensors were designed and tested[
Sign up for Chinese Optics Letters TOC. Get the latest issue of Chinese Optics Letters delivered right to you!Sign up now
The micro stereo sensor was presented using a chalcogenide ring resonator. The communication between cells and the brain was confirmed by Rabi oscillation[
Mach–Zehnder interferometer (MZI)-based devices were presented for different applications such as quantum communication, where the spin wave was produced, and quantum security was confirmed by the spin-up and spin-down projections. The triple mode transmission using wireless fidelity (WiFi), light fidelity (LiFi), and cable was also presented[
The basic principle of plasmonics is that the electric charge oscillates on a metal surface. A review on plasmonics was presented for manipulating optical information. Surface plasmon and plasmonic waveguide circuits were explained in detail for the application in optical computing and optical information processing[
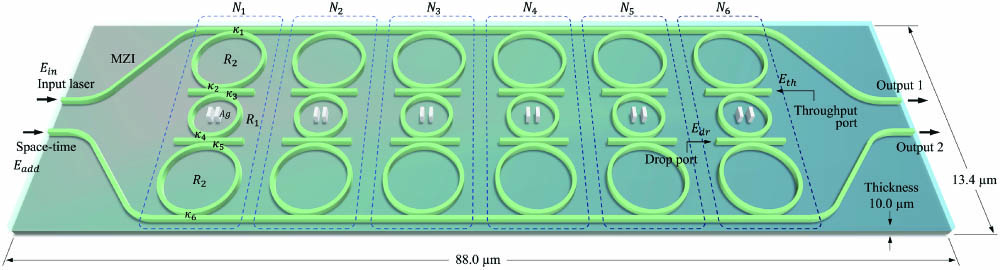
Principally, human sensors can be configured as eyes for vision, ears for hearing, tongue for taste, nose for breathing (smelling), body for the sense of touching, and brain for neural sensors and signal processing. In this work, stereo sensors similar to the human ones are presented by the six stereo sensors. There are six panda rings embedded into MZI, where the center ring is applied to the Ag bars for electric dipole oscillation. Each of the panda rings is manipulated as the eye, ear, tongue, body, nose, and brain. There are two input sources into the MZI, one is the laser pulse, and the second is space–time modulation control function. The WGM output confirms the stereo phenomena, while the required signals are obtained by the space–time control at the MZI outputs. The micro stereo system is designed by Optiwave software. Then, the results are plotted in MATLAB. The theoretical background is given, and the results and discussion are presented for human quantum sensors.
2. Theoretical Background
In Figs. 1 and 2, the equivalent circuits of the six human stereo sensors for the body, tongue, nose, ears, eyes, and brain are formed by the six panda rings embedded in the MZI, where the combined output signals are at the MZI outputs. The stereo sensor output of each node is at the center, which is in the form of a WGM. The space–time modulation control is applied to the MZI input. When the six stereo sensors are at resonance, the space–time distortion of all sensor nodes has vanished, which is the required sensing output signal. The space–time projection can be applied, where the changes in the environment around the sensor nodes change the stereo sensing outputs.
![]()
Figure 1.Proposed design of the human-like micro stereo sensors system, where N1 to N6 are node 1 to node 6 for eye, ear, tongue, body, nose, and brain. R1 and R2 are radii of microring resonators. κ1 to κ4 are coupling coefficients. The optical fields for input, throughput, add, and drop ports are given by Ein, Eth, Eadd, and Edr, respectively.
![]()
Figure 2.Equivalent sensor node circuit. The center microring is embedded with a silver (Ag) nano bar.
The quantum signals of the electron cloud spin up and down can be obtained at the MZI outputs, which can be applied for quantum code applications.
The input source is the polarized laser, which is input into the MZI via the upper branch, while the space–time modulation is input into the MZI lower branch. The device materials and parameters are given in the figures and captions.
The input polarized laser is given as[
When light propagates into the device, the refractive index () of the material changes, which is given as[
Sensing nodes are formed by the panda ring resonator embedded Ag bars on the center ring. In manipulation, using the iteration method, the resonant WGMs can be obtained when the optical path differences of the space–time modulation along the side rings are balanced, which are known as stereo sensor nodes. The WGM outputs couple into the silicon and sliver bars, where the Ag bar surface electrons are excited by the plasmonic waves. Here, the trapped electron cloud is oscillated by the plasma frequency (), which is described by the Drude model[
The space–time modulation circuits can be described by using the standard MZI and modulation function. The space–time modulation is applied at the lower branch of the MZI. The space–time signal is given by Eq. (5)[
The excited electrons are trapped inside the six microring resonators, where the formation of six WGMs has taken place. The outputs at throughput () and drop ports () are given by[
Each plasmonic stereo sensor circuit is formed by a silicon microring resonator embedded with a Ag grating. The electric field is input via the MZI and a panda ring input port, while the add port is input by the modulated energy–time function fed by the MZI signals. The MZI output ()[
The circuit operates under successive filtering and pumping mechanisms. The resonant output signals can be obtained by the resonant condition. The required output is in the form of the WGM, which can be obtained by adjusting the optical path difference of the two side phase modulators. The required signals can be received at throughput and drop ports and the MZI output. When light propagates into the different device lengths, the optical path difference is formed, from which the material refractive index is the key parameter. The WGM is generated by the plasma oscillation of the trapped electrons (plasmons), where light behavior becomes a quantum phenomenon. The wave-particle behaviors can be applied and described by the energy–time function, where the general wave-particle propagation in the system is given by[
In this case, the system is configured by the two-level system. From Eq. (11), when , the system becomes a two-level system known as a harmonic oscillator. The required oscillation frequency called Rabi oscillation can occur, where there are two different frequencies (energy states). Space and time distortions are compensated and matched by the resonant optical path differences within the circuit, in which both space and time distortions have vanished[
3. Simulation Results and Discussion
The finite-difference time-domain (FDTD) method is applied to obtain the resonant results, where successive filtering is performed by the iteration, in which the maximum iteration of 20,000 roundtrips was applied. The optimum parameters are extracted and verified by MATLAB program results. In the case of the human stereo sensors, the energy–time function is applied, which is formed by the occurrence of the Rabi oscillation. The quantum signals are obtained by the space–time modulation projection, where the electron cloud spins can be obtained and used for quantum code applications. The micro distributed plasma stereo sensors are shown in Figs. 1 and 2, which consist of six nodes embedded into the MZI. The nodes basically represent the panda ring. Each node consists of one small ring at the center of radius R1 and two side rings of radius R2. The side ring radii are larger than the center ring radius. The nodes are distinguished by the arrangement of Ag bars. Ag nano bars are applied because Ag is a metamaterial, which provides wider antenna bandwidth[
| Parameters | Symbol | Values | Units |
|---|---|---|---|
| Input source wavelength | 1.50 | µm | |
| Input power | P | 10–20 | mW |
| Center ring radius | R1 | 1.50 | µm |
| Side ring radius | R2 | 2.00 | µm |
| Coupling coefficient | 0.60–0.70 | ||
| Silver refractive index | nAg | 0.14 | |
| Si refractive index | nSi | 3.47 | |
| Metallic film area | A | ||
| Mass of electron | m | kg | |
| Waveguide loss | 0.5 | ||
| Electron charge | e | Coulomb | |
| Effective core area | Aeff | 0.30 | |
| Free space permittivity | F/m | ||
| Sensing device volume | L × W × H |
Table 1. The Optimized Parameters Used in Simulation[19
Figure 3 shows the simulated intensity distribution and electric field results, where WGMs are formed at the six nodes. Input light with a wavelength of 1.50 µm is applied at the upper arm of the MZI. This is given by Eq. (1). The light propagates through node 1 to node 6. The space–time function is applied at the lower arm of the MZI, which is given by Eq. (5). The light got trapped inside the center ring. The Ag nano bars got excited, and WGM formation takes place. At the endpoint of the MZI, two outputs, 1 and 2, are achieved. These WGMs form the antenna. Each node has four ports: input port, drop port, add port, and throughput port. Figure 4 shows the sensor sensitivity plot of six different nodes. Sensor sensitivity is calculated by using the obtained intensity value at the throughput ports. The sensitivity is plotted by varying the input power from 10 mW to 20 mW in steps of 2 mW. Figure 5 shows the antenna profiles, where Figs. 5(a)–5(f) show the antenna directivities of antennas 1 to 6. Antenna directivity is plotted by using the concept of ratio of power radiated in all directions from WGM to the power radiated at a point. The directivity is dimensionless. Calculated directivities are 2.91, 5.78, 4.92, 4.97, 3.54, and 8.51. In Fig. 5(b), antenna gain is plotted by varying the input power from 10 mW to 20 mW. Gain is calculated by using the concept of a power radiated antenna to the input power[
![]()
Figure 3.Illustration of OptiFDTD simulation results: (a) light intensity distribution and (b) electric field (plasmon) distribution. The input source is a polarized laser with a wavelength of 1.50 µm. The used parameters are given in Table
![]()
Figure 4.Plot of six sensor sensitivities with input power variation from 10 mW to 20 mW. The calculated sensor sensitivities obtained are 1.019 µm-2, 0.722 µm-2, 1.073 µm-2, 0.239 µm-2, 0.439 µm-2, and 0.193 µm-2, respectively.
![]()
Figure 5.Plots of antenna parameters, where (a)–(f) are the directivities of antenna 1 to antenna 6. The obtained directivities are 2.91 dBm, 5.78 dBm, 4.92 dBm, 4.27 dBm, 3.51 dBm, and 8.14 dBm for antenna 1 to antenna 6, respectively, and (g) the gains of the antennas are 8.50 dB, 7.29 dB, 6.88 dB, 4.49 dB, 2.36 dB, and 3.30 dB of antenna 1 to antenna 6, respectively.
Figure 6 shows the frequency domain plots of different WGMs. The graphs are plotted using the six different powers and intensities. The center frequencies are 209.15 THz, 199.93 THz, 201.98 THz, 198.80 THz, 198.90 THz, and 193.77 THz for WGMs 1 to 6, respectively. The wavelength and time domain plots are shown in Figs. 7 and 8. The wavelength where the maximum intensity is obtained is 1.43 µm, 1.49 µm, 1.48 µm, 1.50 µm, 1.50 µm, and 1.54 µm, respectively, for WGMs 1 to 6.
![]()
Figure 6.WGM results of the sensor nodes in the frequency domain, where (a) to (f) are for node 1 to node 6, respectively.
![]()
Figure 7.WGM results of the sensor nodes in the wavelength domain, where (a) to (f) are for node 1 to node 6, respectively.
![]()
Figure 8.WGM results of the sensor nodes in the time domain, where (a) to (f) are for node 1 to node 6, respectively.
Figure 8 shows the time taken by light propagation, which increases from node 1 to node 6. At node 1, the signal starts early, while at node 6, it starts after 200 fs. For node 1, signal propagation starts at 40 fs, node 2 at 90 fs, node 3 at 140 fs, node 4 at 180 fs, node 5 at 220 fs, and node 6 at 360 fs. The maximum amplitude for node 1 in the time domain is obtained at 270 fs, node 2 at 170 fs, node 3 at 320 fs, node 4 at 520 fs, node 5 at 380 fs, and node 6 at 450 fs. Figures 6–8 show the WGM results of six nodes in the frequency, wavelength, and time domains, respectively. It is clear from Figs. 6–8 that the intensity values are changing in accordance with the input power in the frequency and wavelength domains. In the time domain, the amplitude value varies according to input power.
Figure 9 shows the calculation results of the two side rings for six nodes. At node 1, the maximum values of intensities are and obtained at 1.43 µm for the upper ring and lower ring, respectively. The obtained maximum intensities at the upper ring and lower ring are at 1.50 µm and at 1.47 µm. Similarly, for node 3, the intensities are at 1.52 µm and at 1.50 µm for the upper and lower rings, respectively. For node 4, the intensities are at 1.53 µm and at 1.52 µm for the upper and lower ring, respectively. At node 5, the maximum intensities are and obtained at 1.50 µm and 1.49 µm for the upper and lower rings, respectively. At node 6, the obtained intensity values are and at 1.55 µm and 1.52 µm for the upper and lower rings, respectively, where it is observed that the upper and lower rings follow the same pattern for intensity distribution at all nodes. The upper ring intensities are higher as the power propagates first in the upper branch. Then, the power goes to the small center ring and then to the lower (side) ring, so intensity decreases with distance. In Fig. 10, the output MZI signals are plotted for both the upper and lower branches. The maximum intensity obtained is at 1.57 µm and at 1.55 µm for the upper and lower branches, respectively, which shows the stereo sensors. The output of the MZI upper branch is the summation of all upper rings for nodes 1 to 6. Similarly, the output of the MZI lower branch is the combination of all lower rings for nodes 1 to 6. The MZI output describes the stereo phenomena.
![]()
Figure 9.Plots of the output signals of the six stereo sensor nodes (two-side ring results) with the optimum value from Fig.
![]()
Figure 10.MZI output signals that describe the stereo sensors.
Figure 11 shows the electron density output with space–time control. The space–time control is applied at the lower branch of the MZI input port. Figure 11(a) is plotted by changing the input power in steps of 5 mW to 15 mW. The electron density is directly proportional to input power. Figure 11(b) shows the plot of electron density and phase shift. From Fig. 9, the stereo sensor resonant outputs can be applied to the space–time distortion control, from which human consciousness forms before the Rabi oscillation has collapsed. Successive filtering (iteration) is applied until the space–time distortion has vanished. The electron spin projections in this time interval (1.4 fs) can be configured as the quantum signals that communicate with brain signals, which can be used as quantum consciousness sensors. One of the spin projection results is shown in Fig. 12 for one node. Other nodes also have the same projection pattern. The electron spin up and down, which is the time entanglement, is plotted with the input phase and normalized electron density. The MZI outputs can form the antenna and link to the brain cells by the six different antenna propagations, where any change related to the six sensor sensitivities can be obtained and used for quantum codes (bits), especially for quantum device applications[
![]()
Figure 11.Plots of electron density (ED) outputs with space–time control application: (a) ED and input power and (b) ED and time (phase).
![]()
Figure 12.Two-level system results, where (a) one of the electron spin projection results, the quantum bit rate of 28 Pbit/s, is achieved, and (b) the Rabi oscillation gives the quantum behavior before collapsing at ∼1.4 fs.
This device is a modified optical add–drop filter known as a panda ring, which has been applied in various applications[
4. Conclusion
In this paper, six panda ring resonators are embedded into an MZI to form a human-like stereo system. These six sensors are related to human sensors known as a stereo formed by two side organs. The electromagnetic wave transmission output obtained at the center (WGM) can be manipulated for six human sensors. Such a system can offer brain-device interfacing, in which human sensor investigation can be applied. The input light is a polarized laser and is an entangled source applied at the MZI upper branch. The space–time function is applied at the lower branch of MZI to form the two-level system behavior known as Rabi oscillation. The antenna directivity and gain are calculated and obtained. The human sensor is obtained at the MZI output, which can be applied for sensing applications. By using the space–time modulation control at the MZI input, the electron distributions and spins are obtained. The quantum bits were plotted, where the obtained bit rate was . The designed system can be applied for brain-device interfacing applications based on optical pumping and successive filtering applications such as quantum consciousness, deep learning, and machine learning.
References
[1] P. Youplao, N. Pornsuwancharoen, I. S. Amiri, M. A. Jalil, M. S. Aziz, J. Ali, G. Singh, P. Yupapin, K. T. V. Grattan. Microring stereo sensor model using Kerr–Vernier effect for bio-cell sensor communication. Nano Commun. Networks, 17, 30(2018).
[2] M. Bunruangses, P. Youplao, I. S. Amiri, N. Pornsuwancharoen, P. Yupapin. Double vision model using space-time function control within silicon microring system. Silicon, 12, 2635(2020).
[3] I.-J. Ding, Z.-G. Wu. Two user adaption-derived features for biometrical classifications of user identity in 3D-sensor-based body gesture recognition applications. IEEE Sens. J., 19, 8432(2019).
[4] N. Hendrich, F. Wasserfall, J. Zhang. 3D printed low-cost force-torque sensors. IEEE Access, 8, 140569(2020).
[5] M. Schouten, G. Wolterink, A. Dijkshoorn, D. Kosmas, S. Stramigioli, G. Krijnen. A review of extrusion-based 3D printing for fabrication of electro- and biomechanical sensors. IEEE Sens. J., 20, 14218(2020).
[6] M. R. Khosravani, T. Reinicke. “3D-printed sensors: current progress and future challenges. Sens. Actuat. A: Phys., 305, 111916(2020).
[7] J. Qu, Q. Wu, T. Clancy, Q. Fan, X. Wang, X. Liu. 3D-printed strain-gauge micro force sensors. IEEE Sens. J., 20, 6971(2020).
[8] Z. Zhu, H. S. Park, M. C. McAlpine. 3D printed deformable sensors. Appl. Sci. Eng., 6, 25(2020).
[9] S. Tsuji, T. Kohama. A layered 3D touch screen using capacitance measurement. IEEE Sens. J., 14, 3040(2014).
[10] P. P. Yupapin, N. Sarapat. Novel micro-scale sensors using WGMS within the modified add-drop filter circuits. Microwave Opt. Technol. Lett., 56, 14(2013).
[11] A. Shafiee, M. Bahadoran, P. Yupapin. Analytical microring stereo system using coupled mode theory and application. Appl. Opt., 58, 8167(2019).
[12] A. Garhwal, K. Ray, A. E. Arumona, G. K. Bharti, I. S. Amiri, P. Yupapin. Spin-wave generation using MZI embedded plasmonic antennas for quantum communications. Opt. Quantum Electron., 52, 241(2020).
[13] A. Garhwal, A. E. Arumona, K. Ray, P. Youplao, S. Suwandee, P. Yuppain. Microplasma source circuit using microring space-time distortion control. IEEE Trans. Plasma Sci., 48, 3600(2020).
[14] D. Yuan, Y. Dong, Y. Liu, T. Li. Mach–Zehnder interferometer biochemical sensor based on silicon-on-insulator rib waveguide with large cross section. Sensors, 15, 21500(2015).
[15] T. J. Davis, D. E. Gomez, A. Roberts. Plasmonic circuits for manipulating optical information. Nanophotonics, 6, 543(2016).
[16] V. Giannini, A. I. F. Dominguez, S. C. Heck, S. A. Maier. Plasmonic nanoantennas: fundamentals and their use in controlling the radiative properties of nanoemitters. Chem. Rev., 111, 3888(2011).
[17] A. Habib, X. Zhu, S. Fong, A. A. Yanik. Active plasmonic nanoantenna: an emerging toolbox from photonics to neuroscience. Nanophotonics, 9, 3805(2020).
[18] A. E. Arumona, I. S. Amiri, P. Yupapin. Plasmonic micro-antenna characteristics using gold grating embedded in a panda-ring circuit. Plasmonics, 15, 279(2020).
[19] K. Uomwech, K. Sarapat, P. P. Yupapin. Dynamic modulated Gaussian pulse propagation within the double PANDA ring resonator system. Microwave Opt. Technol. Lett., 52, 1818(2010).
[20] P. Yooplao, P. Pongwongtragull, S. Mitatha, P. P. Yupapin. Crosstalk effects of quantum key distribution via a quantum router. Microwave Opt. Technol. Lett., 53, 1094(2011).
[21] A. E. Arumona, A. Garhwal, P. Youplao, I. S. Amiri, K. Ray, S. Punthawanunt, P. Yupapin. Hall effect sensors using polarized electron cloud spin orientation control. Microsc. Res. Tech., 84, 563(2020).
[22] A. Garhwal, M. Bunruangses, A. E. Arumona, P. Youplao, K. Ray, S. Suwandee, P. Yupapin. Integrating metamaterial antenna node and LiFi for privacy preserving intelligent COVID-19 hospital patient management. Cognit. Comput.(2021).
[23] A. E. Arumona, I. S. Amiri, S. Punthawanunt, K. Ray, G. Singh, G. K. Bharti, P. Yupapin. 3D-quantum interferometer using silicon microring-embedded gold grating circuit. Microsc. Res. Tech., 83, 1217(2020).
[24] A. E. Arumona, A. Garhwal, M. Bunruangses, K. Ray, P. Youplao, S. Punthawanunt, P. Yupapin. Plasmonic antenna embedded chalcogenide MZI circuit for ultra-high density up-and down link transmission. Plasmonics, 16, 947(2021).
[25] A. E. Arumona, I. S. Amiri, G. Singh, P. Yupapin. Full-time slot teleportation using unified space-time function control. Microwave Opt. Technol. Lett., 62, 2183(2020).
[26] S. Suwandee, A. E. Arumona, K. Ray, P. Youplao, P. Yupapin. Mindfulness model using polariton oscillation in plasmonic circuit for human performance management. Axioms, 9, 76(2020).
[27] A. E. Arumona, A. Garhal, S. Punthawanunt, K. Ray, P. Youplao, P. Yupapin. Micro-metamaterial antenna characteristics using microring embedded silver bars. Microsyst. Technol., 26, 3927(2020).
[28] L. E. Valenti, C. E. Giacomelli. Stability of silver nanoparticles: agglomeration and oxidation in biological relevant conditions. J. Nanopart. Res., 19, 156(2017).
[29] C. A. Balanis. Antenna Theory Analysis and Design(2005).
[30] M. Bunruangses, P. Youplao, I. S. Amiri, N. Pornsuwancharoen, P. Yupapin. Brain sensor and communication model using plasmonic microring antenna model. Opt. Quantum Electron., 51, 349(2019).
[31] B. Admas, F. Petruccione. Quantum effects in the brain: a review. AVS Quantum Sci., 2, 022901(2020).
[32] C. Grau, R. Ginhoux, A. Riera, T. L. Nguyen, H. Chauvat, M. Berg, J. L. Amengual, A. P. Leone, G. Ruffini. Conscious brain-to-brain communication in humans using non-invasive technologies. PLoS ONE, 9, 8(2014).

Set citation alerts for the article
Please enter your email address
© Copyright 2018-2021 | Chinese Laser Press. All Rights Reserved 沪ICP备15018463号-20