
Zhaoyang Zhang, Yuan Feng, Shaohuan Ning, G. Malpuech, D. D. Solnyshkov, Zhongfeng Xu, Yanpeng Zhang, Min Xiao. Imaging lattice switching with Talbot effect in reconfigurable non-Hermitian photonic graphene[J]. Photonics Research, 2022, 10(4): 958
- Photonics Research
- Vol. 10, Issue 4, 958 (2022)
Abstract
1. INTRODUCTION
Non-Hermitian physics is a rapidly developing field combining interesting fundamental concepts with important potential applications [1,2]. The research is particularly well advanced in photonics [3], thanks to the well-developed optical techniques of controlling the effective (both real and imaginary) potentials and of the measurements of the wave functions. The key step was the discovery of the parity-time (PT)-symmetry-breaking transition for the eigenstates occurring at exceptional points of non-Hermitian Hamiltonians [4]. Such a transition makes the system chiral, allowing the nonreciprocal optical transport without external magnetic field [5,6] useful for realizing optical isolation [7,8]. The PT-symmetric transition occurs at an exceptional point, where the matrix representing the non-Hermitian Hamiltonian becomes defective, and its eigenvectors coalesce. The most well-known example of such a transition is the damped harmonic oscillator, whose frequency becomes strictly zero above critical damping (overdamped regime).
After several initial attempts [9–11], a lattice with a non-Hermitian PT-symmetric potential was considered in a seminal work [12] that has demonstrated the modification of the dispersion of the lattice modes, with the formation of nondispersive (flat) regions bounded by exceptional points, for a sufficiently large degree of non-Hermiticity. This work has spawned an important activity focused on the studies of various lattices in both one- (1D) and two-dimensional (2D) cases, mostly within the tight-binding approximation (with non-Hermitian on-site potentials or coupling terms), in photonics [13] and other systems [14]. These studies often analyzed the interplay of non-Hermiticity with topology [15–18] or interactions [19,20]. In those works, the consideration was usually restricted to a single band (or a pair of branches, as in the case of the Dirac Hamiltonian), and thus usually a single region with PT-symmetry breaking was observed. However, it turns out that such a restricted consideration is not always correct, so going beyond the tight-binding limit (as in the original case of Ref. [12]) or considering several branches becomes sometimes necessary.
One of the tools for the experimental studies of periodic potentials is the Talbot effect [21,22], known as a self-imaging process. To date, the non-Hermitian Talbot effect was considered only theoretically in 1D photonic lattices [23–25]. As to 2D photonic lattices, such as hexagonal lattices, the Talbot effect was mostly accomplished based on the real part of the index [26,27], that is, in a Hermitian configuration.
Sign up for Photonics Research TOC. Get the latest issue of Photonics Research delivered right to you!Sign up now
In this work, we experimentally demonstrate the dynamic behaviors of a wave packet in a non-Hermitian photonic graphene structure realized in a three-level -type atomic vapor configuration. The observed PT-symmetry-like phase transition in the current 2D honeycomb optical lattice is achieved with uniform imaginary part on lattice sites, which is extremely different from previously demonstrated non-Hermitian dynamic behaviors in 1D optical lattices relying on gain and loss in atomic systems [28,29]. Also, we observed the Talbot effect of the discretized probe field at certain propagation distances outside the cell. Different from previous works, here we demonstrate the Talbot effect of a 2D hexagonal lattice resulting from a non-Hermitian configuration with both and modulated into honeycomb profiles. We show that the non-Hermitian character of the lattice allows switching the lattice symmetry between the honeycomb and simple hexagonal (“inverted-honeycomb”) lattices. This occurs thanks to the PT-symmetry breaking in the -band, giving rise to the lowest decay of the corresponding modes. Thus, the degree of non-Hermiticity of the established complex honeycomb photonic lattice becomes a new “control knob.” This can be promisingly exploited to develop an all-optical-controllable Talbot–Lau interferometer [30] and improve the related applications, such as imaging cold atoms [31,32] and atom lithography [33].
2. EXPERIMENTAL SCHEME
Figure 1 shows the scheme for experimentally demonstrating the evolution dynamics of the probe wave packet passing through the laser-induced complex photonic lattice. The probe field (wavelength , frequency , Rabi frequency ) and the coupling field with a spatially periodic intensity profile propagate along the same direction to drive a three-level -type atomic system [Fig. 1(b)]. Three coupling beams , , and (, , , , and , respectively) from the same single-mode tunable external cavity diode laser (ECDL2) are symmetrically arranged with respect to the axis [see Fig. 1(c)]. They intersect at the center of the atomic vapor cell (with a temperature of 120°C) to construct a hexagonal lattice with a period of in the plane. Here is the detuning between the resonant transition frequency and the frequency of field , and Rabi frequency is defined as , where (, ) is the dipole momentum between transition and is the amplitude of the electric field corresponding to . A near-parallel probe beam with a Gaussian intensity profile from another ECDL1 is injected into the medium to cover the induced 2D lattice. With the laser frequencies tuned close to the two-photon resonance condition , an electromagnetically induced transparency (EIT) window can be effectively generated to “write” a spatially periodic refractive index felt by the probe field. EIT refers to a phenomenon in which the resonant absorption of the atomic gas experienced by the probe field is significantly suppressed within a certain frequency width under the action of a strong coupling field [34]. When the probe detuning is set as , a discretized probe pattern can be observed at the output plane of cell around the EIT window. The output probe beam is imaged onto a charge-coupled device (CCD) camera [Fig. 1(a)] via an imaging lens.
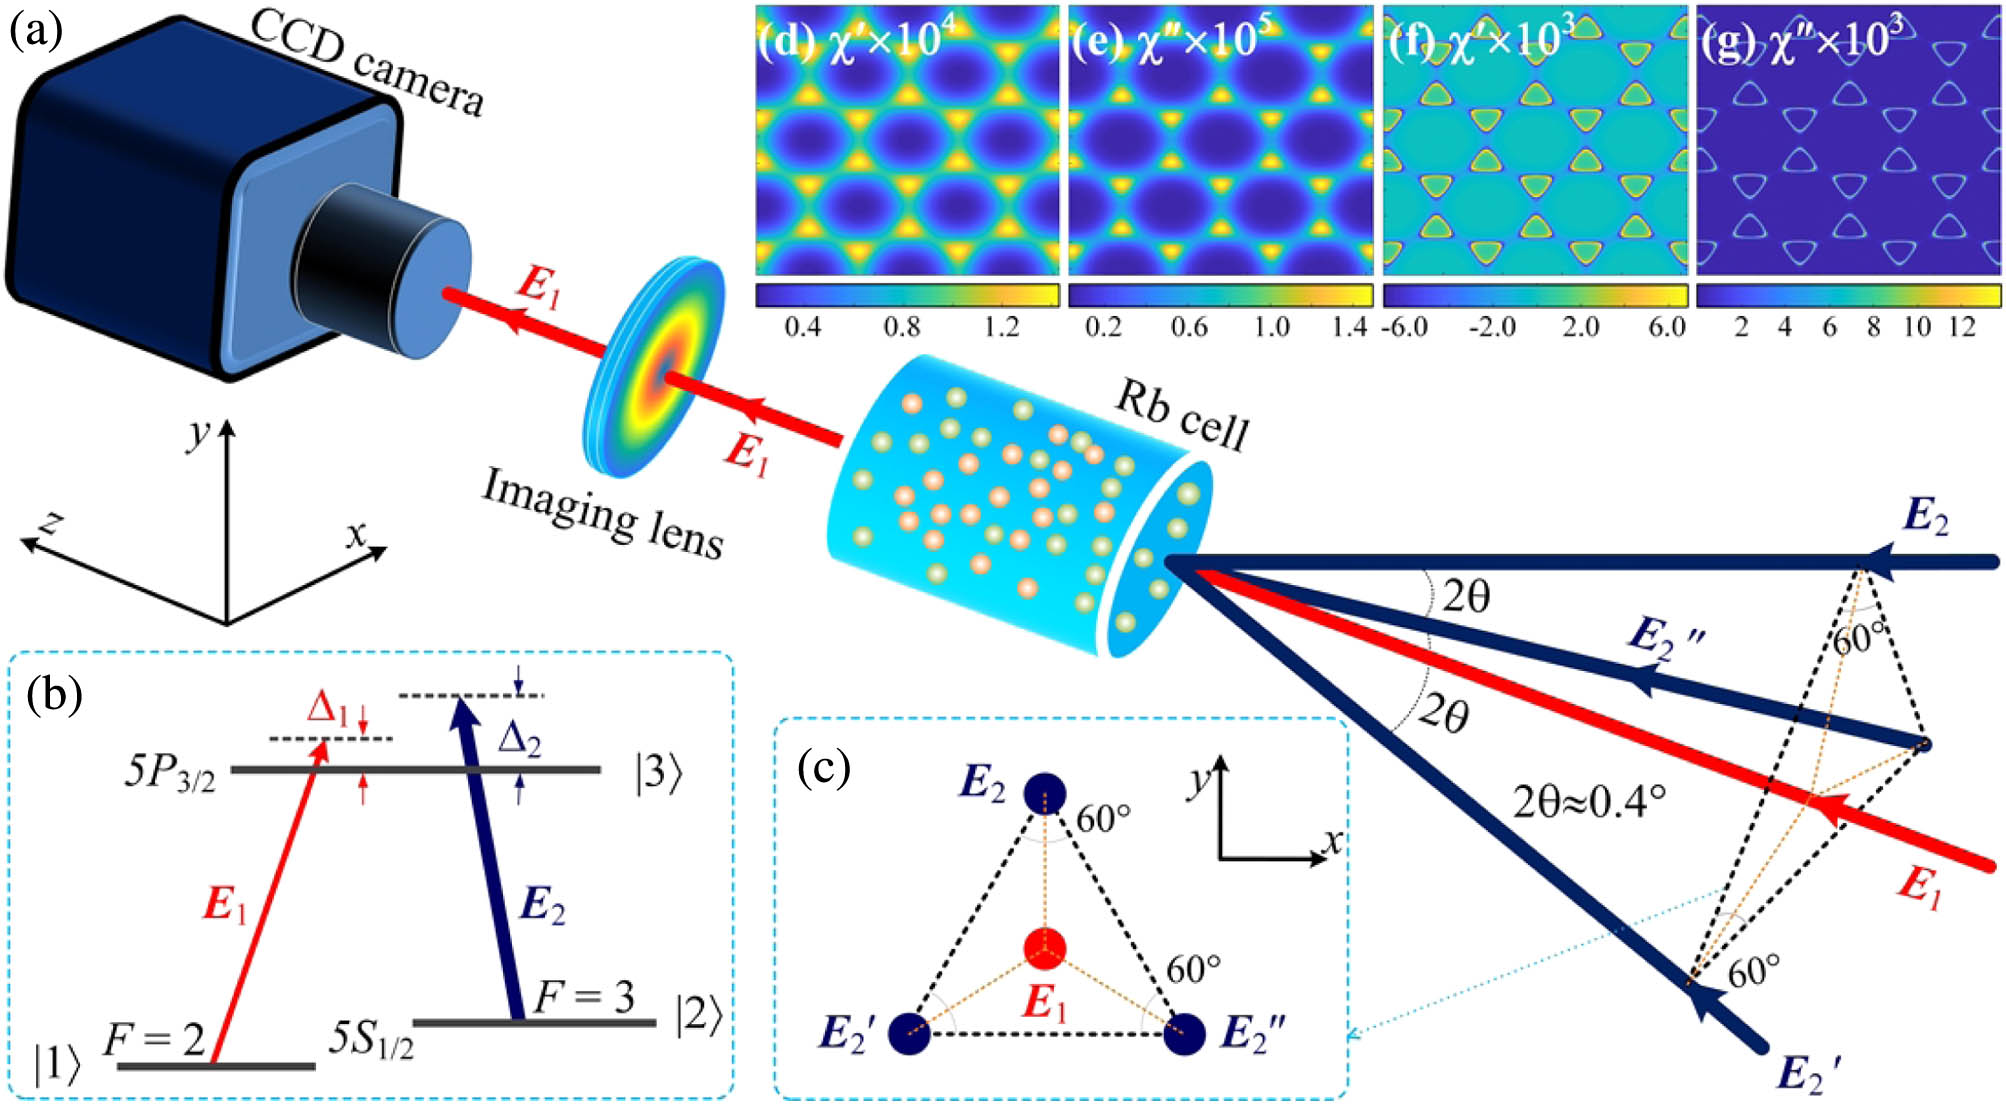
Figure 1.(a) Experimental setup. Three coupling beams,
The complex refractive index in an atomic EIT configuration is expressed as , where is the susceptibility for describing the optical response of the probe field. The susceptibility of the system at probe frequency is [35]
In the above expressions, is the decay rate between states and related to the longitudinal and reversible transverse relaxation times of each state, represents the Rabi frequency for the transition | driven by the hexagonal coupling field, and is the atomic density. The calculated is shown as in Figs. 1(d)–1(g), where both and exhibit honeycomb distributions. As a result, the non-Hermitian photonic graphene is achieved, and the ratio determining the degree of non-Hermiticity can be manipulated by controlling the laser detunings.
3. MODEL
The interaction of the probe beam with the induced refractive index pattern is described within the paraxial approximation, mapping the Helmholtz equation to the Schrödinger equation for the field’s amplitude [36,37]. The susceptibility determines an effective potential in this equation, with real and imaginary parts proportional to each other, but with opposite signs. Strictly speaking, the system is not PT-symmetric, contrary to the previous works [12], but it still exhibits a similar non-Hermitian transition while being easier to implement. The transition is determined by
To demonstrate this transition, we need to start by studying a quantum particle in an arbitrary complex potential (not periodic). The spatial dynamics of a wave packet in a complex potential can be described using the Schrödinger equation,
At a small scale (for example, smaller than the period of the lattice), we can apply the Taylor expansion to the potential. The gradient of the real part of the potential acts as a force . This force can accelerate the wave packet in the direction opposite to the gradient, with the acceleration given by (the subscript stands for “Hermitian”). However, the dynamics of the wave packet is also affected by the gradient of the imaginary part . The center of mass of the wave packet can be found as
Now we come back to a periodic lattice, with the minima of the real potential corresponding to the maxima of the decay. This system does exhibit a transition between the Hermitian and non-Hermitian regimes, appearing thanks to the presence of a characteristic length (the lattice parameter). The required time for the wave packet to collapse at the nearest decay minimum is . We therefore have the following equality for the critical behavior of the system, corresponding to the equilibrium between the Hermitian and non-Hermitian contributions,
Replacing the variables in this expression by their definitions, we finally obtain the qualitative transition threshold given by Eq. (2).
In the case of a honeycomb lattice with a non-Hermitian part of the potential, this effect leads to the “inversion” of the lattice: from a honeycomb lattice defined by the real potential, the system switches to a simple hexagonal (“triangular”) lattice, with particles localized at the centers of the hexagons of the honeycomb lattice, where the decay is the smallest. To understand this behavior better, we have performed numerical simulations of a 2D honeycomb lattice first with a purely real, and then with a complex potential as described above. We solve the Schrödinger equation, Eq. (3), numerically, using a narrow Gaussian wave packet as an initial condition [38].
The dispersion for the Hermitian case is shown in Fig. 2(a), with the energy plotted in the unit of , the effective tight-binding hopping parameter of the -band. The band structure is obtained by Fourier transforming the solution of Eq. (3), and the false color map corresponds to its intensity (squared absolute value of the wave function). The dispersion exhibits an -band and a -band (with an admixture of the higher bands, because the effective potential is not deep enough to provide a strong localization of the upper on-site levels). Figure 2(b) shows the simulated dispersion in the presence of a sufficiently strong non-Hermiticity, above the critical value given by Eq. (6): a strong signal from the point of the -band means that this point has the longest lifetime (smallest decay rate). The real-space images of the eigenstates corresponding to the points of the - and -bands are shown in Figs. 2(c) and 2(d), respectively. These images are obtained by plotting the spatial distribution of the solution at selected energies. They confirm that switching between these two points indeed corresponds to the inversion of the lattice (from honeycomb to hexagonal). Taking multiple bands into consideration is essential in our configuration because the lowest energy and the longest-living states belong to two different bands.
![]()
Figure 2.Numerical simulations of a complex honeycomb photonic lattice. (a) Dispersion in the Hermitian case showing the lowest bands (s and mixed
4. RESULTS AND DISCUSSION
Figure 3 shows the transmitted probe field through the coupling lattice [Fig. 3(a)] at different around the EIT window, where both and are honeycomb lattices. For and , the observed output probe exhibits honeycomb intensity patterns [Figs. 3(b1) and 3(b2)]. According to the calculated index distribution, the ratio gets over 10, indicating that the real part dominates; the wave packet is localized at the minima (the sites of honeycomb lattice) of the real potential , which is verified by the numerical simulation given in Figs. 3(c1) and 3(c2). Also, the output intensity at is stronger than that at , since the single-photon absorption at (closer to the two-photon resonance ) can be better suppressed, which is one key function of EIT. With tuned very close to the EIT resonance, both and are nearly zero [28], which indicates that the lattice potential can be very weak, and the output probe cannot demonstrate a clear discretization, which is experimentally verified by Fig. 3(b3).
![]()
Figure 3.Output probe patterns at different probe detunings. (a) Experimentally established coupling field; (b) observed discretized probe beam at different
When is further decreased to and , and also exhibit a honeycomb profile [as shown in Figs. 1(g) and 1(f)], but with a very different ratio, , compared to . The ratio at is about 0.5 and the imaginary part dominates; the wave packet is localized at the minima of the decay , inheriting from them an inverted-honeycomb (that is, hexagonal) output distribution. Both the observed [Fig. 3(b4)] and simulated [Fig. 3(c3)] hexagonal output patterns consistently support our analysis. Here Figs. 3(b4) and 3(b5) demonstrate the output hexagonal intensity patterns of the probe beam traveling through the non-Hermitian photonic lattice with a honeycomb susceptibility distribution. The output probe at possesses a similar hexagonal pattern to , but with a weaker intensity due to being far from the two-photon resonance.
![]()
Figure 4.Observed self-imaging effect of the output probe beam at different probe detunings. (a)
![]()
Figure 5.PT-symmetric-like transition measured by the symmetry factor as a function of the relative non-Hermiticity controlled by the detuning; black solid line, square root scaling; black dots, numerical simulations; red dots, experiment (error bars indicate the uncertainty).
When the discretized probe images are efficiently obtained at the output plane of the cell (), we monitor the propagation characteristics of the output field in free space at certain ratios of by simultaneously moving the CCD camera and the imaging lens far away from the cell along . Here, detunings and are two typical points where the Hermitian and non-Hermitian properties emerge. The captured probe images at different planes are shown in Fig. 4. The revival effect of honeycomb pattern obtained from a weak non-Hermitian case is shown in Fig. 4(a). For planes () corresponding to the half-integer (fractional) Talbot effect, the inversion between hexagonal and honeycomb lattices occurs. The inversion between hexagonal and honeycomb patterns due to the fractional Talbot effect is similar to the half-Talbot effect in a 1D photonic lattice [27], where the output discrete pattern at can exhibit a half-period shift (along the transverse direction) compared to that at , indicating the interchange of positions of bright and dark fringes. Here the observed inversion between hexagonal and honeycomb profiles also shows the interchange of the bright and dark sites on the pattern. Figure 4(b) demonstrates the Talbot effect of the output patterns under a strong non-Hermitian condition. Theoretically, the Talbot length for a hexagonal lattice [39] in a Hermitian case is , where and are defined as the period of the photonic lattice and wavelength of the incident field, respectively. Also, the honeycomb and inverted honeycomb lattices with the same spatial period can possess equal Talbot length [40]. The measured Talbot length for both cases is , which basically agrees with the calculation.
In order to quantitatively demonstrate the occurrence of the PT-symmetric-like transition, we plot the symmetry parameter obtained from the intensities at two different points associated with each of the two lattices: (honeycomb) and (hexagonal). The symmetry parameter written as gives for a purely honeycomb lattice and for a purely hexagonal one. Since the intensity scales as a square of the wave function, and the effective damping of a mode depends on its overlap with the imaginary part of the potential, which also scales as a square of the honeycomb wave function, one can expect the fourth root of the symmetry parameter to exhibit the typical square root scaling with the damping.
Figure 5 shows fourth root of the symmetry parameter as a function of relative non-Hermiticity, which is experimentally controlled by the detuning . We present both the results of numerical simulations (black dots) and experimental measurements (red dots with error bars, extracted from the data of Fig. 3 and similar), together with the analytical curve corresponding to the expected square root scaling. The position of the transition point () depends on the properties of the particular potential, and on the effective mass of the particles involved; it is the only fitting parameter of the theoretical model. The good agreement between the two sets of data and the analytical scaling confirms our interpretation of the switching of the lattice symmetry as an example of the PT-symmetric-like transition.
In summary, we have demonstrated how instantaneously tunable and reconfigurable non-Hermitian photonic graphene is experimentally constructed relying on EIT in a coherent multilevel atomic medium. Such complex photonic graphene can be used as an ideal platform to demonstrate the underlying intriguing non-Hermitian, nonlinear, and quantum beam dynamical features (for example, topologic properties in a non-Hermitian system) in Dirac band structure geometry by exploiting the easy controllability of the dispersion properties and the Kerr nonlinearity in an EIT window [36,37,41]. We show a lattice symmetry switching from honeycomb to hexagonal due to the non-Hermitian transition. Contrary to previous works, this transition involves two different energy bands.
The non-Hermitian transition in this 2D artificial complex periodic structure is further evidenced by the Talbot effect. The observed complex Talbot effect can be promisingly used to design an all-optical controllable Talbot–Lau interferometer. What is more, this configuration can be easily extended to ultracold atomic samples and potentially serve as an imaging technique to exhibit the distribution of ultracold atomic gas with a better resolution due to the more intensive spots (compared with the 1D Talbot effect).
Acknowledgment
Acknowledgment. G. Malpuech and D. D. Solnyshkov acknowledge the support of the projects EU “TOPOLIGHT” and “QUANTOPOL,” ANR “Quantum Fluids of Light,” ANR Labex GaNEXT, and of the ANR program “Investissements d’Avenir” through the IDEX-ISITE initiative 16-IDEX-0001.
References
[1] V. V. Konotop, J. Yang, D. A. Zezyulin. Nonlinear waves in PT-symmetric systems. Rev. Mod. Phys., 88, 035002(2016).
[2] R. El-Ganainy, K. G. Makris, M. Khajavikhan, Z. H. Musslimani, S. Rotter, D. N. Christodoulides. Non-Hermitian physics and PT symmetry. Nat. Phys., 14, 11-19(2017).
[3] L. Feng, R. El-Ganainy, L. Ge. Non-Hermitian photonics based on parity–time symmetry. Nat. Photonics, 11, 752-762(2017).
[4] C. M. Bender, S. Boettcher. Real spectra in non-Hermitian Hamiltonians having PT symmetry. Phys. Rev. Lett., 80, 5243-5246(1998).
[5] B. Peng, Ş. K. Özdemir, F. Lei, F. Monifi, M. Gianfreda, G. L. Long, S. Fan, F. Nori, C. M. Bender, L. Yang. Parity-time-symmetric whispering-gallery microcavities. Nat. Phys., 10, 394-398(2014).
[6] J. Doppler, A. A. Mailybaev, J. Böhm, U. Kuhl, A. Girschik, F. Libisch, T. J. Milburn, P. Rabl, N. Moiseyev, S. Rotter. Dynamically encircling an exceptional point for asymmetric mode switching. Nature, 537, 76-79(2016).
[7] S. Ozdemir, S. Rotter, F. Nori, L. Yang. Parity-time symmetry and exceptional points in photonics. Nat. Mater., 18, 783-798(2019).
[8] L. Chang, X. Jiang, S. Hua, C. Yang, J. Wen, L. Jiang, G. Li, G. Wang, M. Xiao. Parity–time symmetry and variable optical isolation in active–passive-coupled microresonators. Nat. Photonics, 8, 524-529(2014).
[9] H. F. Jones. The energy spectrum of complex periodic potentials of the Kronig-Penney type. Phys. Lett. A, 262, 242-244(1999).
[10] X.-G. Zhang, K. Varga, S. T. Pantelides. Generalized Bloch theorem for complex periodic potentials: a powerful application to quantum transport calculations. Phys. Rev. B, 76, 035108(2007).
[11] Z. Ahmed. Energy band structure due to a complex, periodic, PT-invariant potential. Phys. Lett. A, 286, 231-235(2001).
[12] K. G. Makris, R. El-Ganainy, D. N. Christodoulides, Z. H. Musslimani. Beam dynamics in PT symmetric optical lattices. Phys. Rev. Lett., 100, 103904(2008).
[13] A. Regensburger, C. Bersch, M.-A. Miri, G. Onishchukov, D. N. Christodoulides, U. Peschel. Parity-time synthetic photonic lattices. Nature, 488, 167-171(2012).
[14] C. Keller, M. K. Oberthaler, R. Abfalterer, S. Bernet, J. Schmiedmayer, A. Zeilinger. Tailored complex potentials and Friedel’s law in atom optics. Phys. Rev. Lett., 79, 3327-3330(1997).
[15] B. Zhen, C. W. Hsu, Y. Igarashi, L. Lu, I. Kaminer, A. Pick, S.-L. Chua, J. D. Joannopoulos, M. Soljačić. Spawning rings of exceptional points out of Dirac cones. Nature, 525, 354-358(2015).
[16] S. Yao, Z. Wang. Edge states and topological invariants of non-Hermitian systems. Phys. Rev. Lett., 121, 086803(2018).
[17] H. Zhou, C. Peng, Y. Yoon, C. W. Hsu, K. A. Nelson, L. Fu, J. D. Joannopoulos, M. Soljačić, B. Zhen. Observation of bulk Fermi arc and polarization half charge from paired exceptional points. Science, 359, 1009-1012(2018).
[18] A. Ghatak, M. Brandenbourger, J. V. Wezel, C. Coulais. Observation of non-Hermitian topology and its bulk-edge correspondence in an active mechanical metamaterial. Proc. Natl. Acad. Sci. USA, 117, 29561-29568(2020).
[19] Z. H. Musslimani, K. G. Makris, R. El-Ganainy, D. N. Christodoulides. Optical solitons in PT periodic potentials. Phys. Rev. Lett., 100, 030402(2008).
[20] S. Assawaworrarit, X. Yu, S. Fan. Robust wireless power transfer using a nonlinear parity–time-symmetric circuit. Nature, 546, 387-390(2017).
[21] H. F. Talbot. Facts relating to optical science. Philos. Mag. J. Sci., 9, 401-407(1836).
[22] L. Rayleigh. On copying diffraction gratings and on some phenomenon connected therewith. Philos. Mag., 11, 196-205(1881).
[23] H. Ramezani, D. N. Christodoulides, V. Kovanis, I. Vitebskiy, T. Kottos. PT-symmetric Talbot effects. Phys. Rev. Lett., 109, 033902(2012).
[24] S. Wang, B. Wang, P. Lu. PT-symmetric Talbot effect in a temporal mesh lattice. Phys. Rev. A, 98, 043832(2018).
[25] S. Longhi. Talbot self-imaging in PT-symmetric complex crystals. Phys. Rev. A, 90, 043827(2014).
[26] Y. Zhang, J. Wen, S. N. Zhu, M. Xiao. Nonlinear Talbot effect. Phys. Rev. Lett., 104, 183901(2010).
[27] J. Wen, Y. Zhang, M. Xiao. The Talbot effect: recent advances in classical optics, nonlinear optics, and quantum optics. Adv. Opt. Photon., 5, 83-130(2013).
[28] Z. Zhang, L. Yang, J. Feng, J. Sheng, Y. Q. Zhang, Y. P. Zhang, M. Xiao. Parity-time-symmetric optical lattice with alternating gain and loss atomic configurations. Laser Photon. Rev., 12, 1800155(2018).
[29] Z. Zhang, Y. Zhang, J. Sheng, L. Yang, M.-A. Miri, D. N. Christodoulides, B. He, Y. Zhang, M. Xiao. Observation of parity-time symmetry in optically induced atomic lattices. Phys. Rev. Lett., 117, 123601(2016).
[30] K. Hornberger, S. Gerlich, P. Haslinger, S. Nimmrichter, M. Arndt. Colloquium: quantum interference of clusters and molecules. Rev. Mod. Phys., 84, 157-173(2012).
[31] Z. Zhang, X. Liu, D. Zhang, J. Sheng, Y. Zhang, Y. Zhang, M. Xiao. Observation of electromagnetically induced Talbot effect in an atomic system. Phys. Rev. A, 97, 013603(2018).
[32] J. M. Wen, S. Du, H. Chen, M. Xiao. Electromagnetically induced Talbot effect. Appl. Phys. Lett., 98, 081108(2011).
[33] M. S. Chapman, C. R. Ekstrom, T. D. Hammond, J. Schmiedmayer, B. E. Tannian, S. Wehinger, D. E. Pritchard. Near-field imaging of atom diffraction gratings: the atomic Talbot effect. Phys. Rev. A, 51, R14-R17(1995).
[34] J. Gea-Banacloche, Y.-Q. Li, S.-Z. Jin, M. Xiao. Electromagnetically induced transparency in ladder-type inhomogeneously broadened media: theory and experiment. Phys. Rev. A, 51, 576-584(1995).
[35] M. Xiao, Y. Li, S. Jin, J. Gea-Banacloche. Measurement of dispersive properties of electromagnetically induced transparency in rubidium atoms. Phys. Rev. Lett., 74, 666-669(1995).
[36] Z. Zhang, F. Li, G. Malpuech, Y. Q. Zhang, O. Bleu, S. Koniakhin, C. Li, Y. P. Zhang, M. Xiao, D. D. Solnyshkov. Particle like behavior of topological defects in linear wave packets in photonic graphene. Phys. Rev. Lett., 122, 233905(2019).
[37] Z. Zhang, S. Liang, F. Li, S. Ning, Y. Li, G. Malpuech, Y. Zhang, M. Xiao, D. Solnyshkov. Spin–orbit coupling in photonic graphene. Optica, 7, 455-462(2020).
[38] O. Bleu, D. D. Solnyshkov, G. Malpuech. Quantum valley Hall effect and perfect valley filter based on photonic analogs of transitional metal dichalcogenides. Phys. Rev. B, 95, 235431(2017).
[39] C. Guo, X. Yin, L. Zhu, Z. Hong. Analytical expression for phase distribution of a hexagonal array at fractional Talbot planes. Opt. Lett., 32, 2079-2081(2007).
[40] J. Belin, T. Tyc. Talbot effect for gratings with diagonal symmetry. J. Opt., 20, 025604(2018).
[41] Z. Zhang, R. Wang, Y. Q. Zhang, Y. V. Kartashov, F. Li, H. Zhong, H. Guan, K. Gao, F. Li, Y. Zhang, M. Xiao. Observation of edge solitons in photonic graphene. Nat. Commun., 11, 1902(2020).

Set citation alerts for the article
Please enter your email address
© Copyright 2018-2021 | Chinese Laser Press. All Rights Reserved 沪ICP备15018463号-20