
Hongbo Li, Qiangqiang Gao, Kangying Li, Ban Li. Properties of Surface Laser Cladding H13/NiCr-Cr3C2 Composite Powder Cladding Layer[J]. Chinese Journal of Lasers, 2021, 48(18): 1802017
- Chinese Journal of Lasers
- Vol. 48, Issue 18, 1802017 (2021)
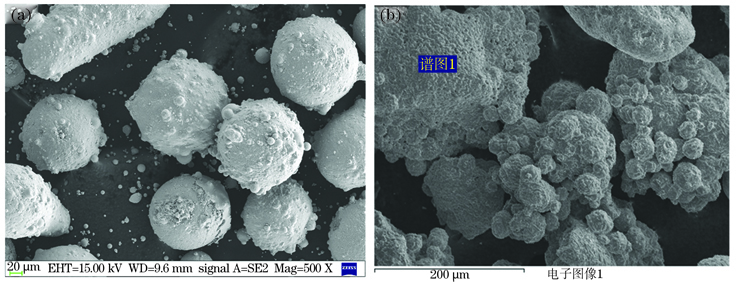
Fig. 1. Micromorphology of different powders. (a) H13; (b) NiCr-Cr3C2
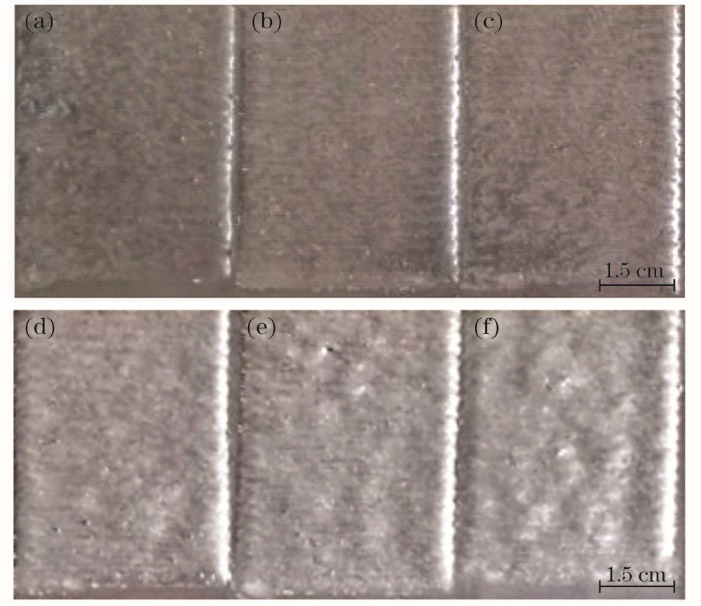
Fig. 2. Macroscopic morphology of cladding layer surface. (a) sample No. 1; (b) sample No. 2; (c) sample No. 3; (d) sample No. 4; (e) sample No. 5; (f) sample No. 6
Fig. 3. Metallographic structure of cladding layer.(a) Low power; (b) high power
Fig. 4. Scanned images of cross section of cladding layer
Fig. 5. X-ray diffraction pattern of cladding layer surface. (a) Mixed powder; (b) cladding layer
Fig. 6. Surface micromorphology of No. 1 sample after thermal fatigue test. (a) Thermal fatigue 5 times; (b) thermal fatigue 25 times; (c) thermal fatigue 35 times
Fig. 7. Surface micromorphology of No. 2 sample after thermal fatigue test. (a) Thermal fatigue 5 times; (b) thermal fatigue 25 times; (c) thermal fatigue 35 times
Fig. 8. Surface micromorphology of No. 3 sample after thermal fatigue test. (a) Thermal fatigue 5 times; (b) thermal fatigue 25 times; (c) thermal fatigue 35 times
Fig. 9. Surface micromorphology of No. 4 sample after thermal fatigue test. (a) Thermal fatigue 5 times; (b) thermal fatigue 25 times; (c) thermal fatigue 35 times
Fig. 10. Surface micromorphology of No. 5 sample after thermal fatigue test. (a) Thermal fatigue 5 times; (b) thermal fatigue 25 times; (c) thermal fatigue 35 times
Fig. 11. Surface micromorphology of No. 6 sample after thermal fatigue test. (a) Thermal fatigue 5 times; (b) thermal fatigue 25 times; (c) thermal fatigue 35 times
Fig. 12. Microhardness of cladding sample. (a) Surface of sample cladding layer; (b) cross section of cladding layer
Fig. 13. Comparison of wear depth between matrix and cladding layer
|
Table 1. Physical properties of common ceramic phases and H13
|
Table 2. Chemical composition of H13 powder unit: %
|
Table 3. Chemical composition of NiCr-Cr3C2 powder unit: %
|
Table 4. Powder ratio scheme and cladding process parameters
|
Table 5. High temperature friction and wear test scheme for matrix and cladding layer

Set citation alerts for the article
Please enter your email address
© Copyright 2018-2021 | Chinese Laser Press. All Rights Reserved 沪ICP备15018463号-20