
Chenguang Xin, Jie Qi, Rui Zhang, Li Jin, Yanru Zhou. In-situ modal inspection based on transverse second harmonic generation in single CdS nanobelt[J]. Chinese Optics Letters, 2021, 19(7): 071901
- Chinese Optics Letters
- Vol. 19, Issue 7, 071901 (2021)
Abstract
Keywords
1. Introduction
Highly confined optical modes in micro/nanowaveguides have broad applications spanning from atomic systems, particle trapping, high-bit-rate optical communication to optical sensing[
Benefitting from attractive features such as high scalability and compatibility, transverse second-harmonic generation (TSHG) and transverse third harmonic generation (TTHG) in optical waveguides have been attracting continuous attentions for developing integrated photonic circuits and devices[
In this paper, we demonstrate in-situ modal inspection based on the TSHG effect inside a single CdS nanobelt (NB). With 1064 nm pumping light coupled in, transverse second-harmonic (TSH) interference patterns are observed in the direction perpendicular to axis of the NB. Modal superposition is analyzed using the fast Fourier transform (FFT) method. A few modes, including fundamental mode and several high-order modes, are extracted from FFT results of the TSH interference patterns, which are in agreement with calculated results. With the assistance of the refractive index difference () between different optical modes, we have also investigated the period of TSH patterns in theory, revealing the characteristic of modal dispersion. It is worth mentioning that this method can be, in principle, operated for many varieties of nonlinear micro/nanowaveguides (e.g., ZnO, CdS, CdTe, GaAs, )[
Sign up for Chinese Optics Letters TOC. Get the latest issue of Chinese Optics Letters delivered right to you!Sign up now
2. Experiment
The CdS NBs with widths ranging from a few to a couple of micrometers and a height of a few hundred nanometers were synthesized by a thermal evaporation process[
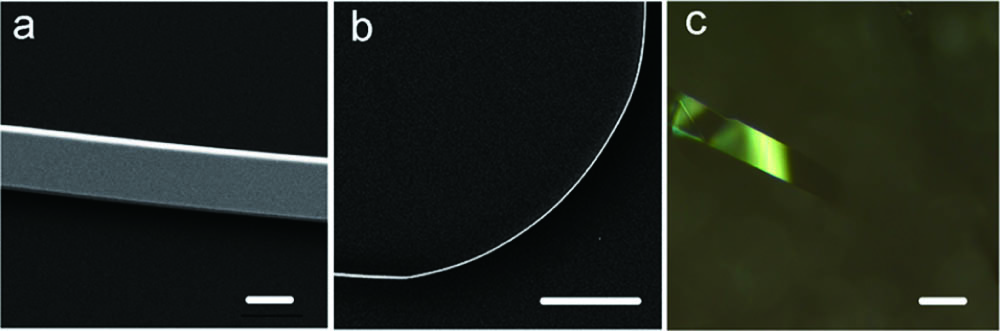
![]()
Figure 1.CdS NBs. (a) Scanning electron microscope image of upper face (scar bar, 1 µm). (b) Scanning electron microscope image of side face (scar bar, 5 µm). (c) Optical microscope image (scar bar, 10 µm).
The experiment setup is schematically illustrated in Fig. 2. A CdS NB is placed across a slit of two substrates. The continuous wave (CW) pumping light is split into two parts equally and coupled into the NB from both ends using fiber tapers. As counter-propagating light overlaps with each other in the NB, the TSH signal can be collected in the direction perpendicular to the axis of the NB using an object lens, as required by the wave-vector matching condition[
![]()
Figure 2.Schematic diagram of the experiment. CdS NB is placed across a slit of two MgF2 to avoid influence from substrates.
Supposing that, there are two counter-propagating modes with propagating constants of and , respectively, inside the NB, as shown in Fig. 3. Determined by the phase matching condition, the emitting angle () of TSH light is given by
![]()
Figure 3.Emitting angle determined by the phase matching condition.
Multimode interference also results in periodic TSH interference patterns along the axis of the NB. The period () can be expressed by[
Although the phase matching condition is not applied in the direction perpendicular to the axis of the NB, the obvious TSHG effect is also expected. For TSHG in a single micro/nanowaveguide, a coherent length caused by phase mismatch in the direction perpendicular to the axis of the waveguide can be estimated as[
The phase mismatch is given by
For CdS NBs, we obtained an of ∼102 nm at a pumping wavelength of 1064 nm. Therefore, a relatively strong TSH signal is expected for CdS NBs with a height of a few hundred nanometers[
To demonstrate the TSHG effect experimentally, a CdS NB with a width of 2 µm and a height of 200 nm was used [Fig. 4(a)]. As 1064 nm pumping light with a power of 5 mW is coupled in, green TSH light was observed. As shown in Fig. 4(b), there were obvious luminescent patterns with a period of ∼9.3 µm along the axis of the NB, which is believed to be owing to optical interference caused by multimode interaction. The mode profiles and effective refractive index were analyzed by finite-difference time-domain (FDTD) simulation. For the fundamental mode, power is concentrated on the center of the NB. However, for the second-order mode, power falls into two parts, which is distributed symmetrically along the axis. Considering the calculated effective refractive indices of 1.868 and 1.812 for the fundamental mode and the second-order mode, respectively, the period of TSH patterns can be calculated to be ∼9.5 µm, agreeing well with the experimental result (∼9.3 µm). The emitting angle was calculated to be ∼88.4° using Eq. (1).
![]()
Figure 4.(a) Optical microscope image of a 2-µm-wide CdS NB with a height of 200 ± 10 nm (scar bar, 50 µm). Inset shows simulated profiles of the fundamental and second-order modes inside an NB at a wavelength of 1064 nm (scar bar, 1 µm). In the FDTD simulation, the width is 2 µm, and the height is 200 nm. (b) TSH interference patterns for the CdS NB with 1064 nm CW light input. (c) Optical microscope image of a 300 nm diameter nanowire (scar bar, 50 µm). Inset shows simulated profile of the first and second-order modes at a wavelength of 1064 nm (scar bar, 300 nm). In the simulation, the nanowire has a hexagonal cross section, which agrees with the reality. The side-to-side diameter is 300 nm. (d) TSH patterns for the nanowire with 1064 nm CW light input.
To demonstrate the influence of multimode interference on luminescent patterns, the TSH signal in a single nanowire with a diameter of was also collected [Fig. 4(c)]. Considering a much smaller dimension, the effective refractive index for modes inside the nanowire is much smaller. As a result of better symmetry for the cross section, the effective refractive index difference between the fundamental mode and the second-order mode inside the nanowire is also much smaller than that in an NB. There was no obvious period observed within a length of ∼100 µm, as shown in Fig. 4(d). It is reasonable, considering a calculated interference period over 500 µm is extracted from a rather small of ∼0.001 between the fundamental mode and the second-order mode inside the nanowire.
The green signal was analyzed by a spectrometer (iHR550, HORIBA Inc.) after passing through a 1064 nm blocking notch filter (Edmund, Inc.). As shown in Fig. 5(a), within a broad spectral range, there are no other peaks except for two peaks corresponding to the pumping light at 1064 nm and the TSH light at 532 nm. The TSH signal intensity with different input power is shown in Fig. 5(b), confirming a second-order nonlinear relationship.
![]()
Figure 5.(a) Measured spectrum of TSH signal. (b) Intensity of the TSH signal with different input power. (c) Extracted intensity profile for the TSH signal along the axis of the NB, corresponding to the inside image of Fig.
3. Discussion
To analyze the TSH patterns, we extracted the image intensity along the axis of the NB in the inside image of Fig. 4(b). The intensity profile is shown in Fig. 5(c), indicating an obviously strong oscillation. The corresponding FFT spectrum was obtained, as shown in Fig. 5(d). The red arrows show the first peaks located at , , , , and , respectively. Considering a resolution of [
| No. | Modes | Period (µm) | Calculated Frequency (µm−1) | Experimental Data (µm−1) | |
|---|---|---|---|---|---|
| 1 | 1st & 2nd | 0.0556 | 9.53 | 0.105 | 0.100 |
| 2 | 2nd & 3rd | 0.0960 | 5.52 | 0.181 | 0.225 |
| 3 | 1st & 3rd | 0.1516 | 3.49 | 0.286 | 0.299 |
| 4 | 2nd & 4th | 0.2385 | 2.22 | 0.450 | 0.424 |
| 5 | 1st & 4th | 0.2942 | 1.80 | 0.555 | 0.524 |
Table 1. Comparison between Calculated Results of Modal Interference and Experimental Results
Considering a 20 nm resolution of the scanning electron microscope image, we have also calculated modal interference with different heights. With heights ranging from 190 nm to 210 nm, the calculated results are very similar (as shown in Table 2). The results show that a change of 20 nm in height does not introduce significant difference into modal interference inside the NB.
| No. | Modes | Modal Interference (µm−1) | ||
|---|---|---|---|---|
| 190 nm | 200 nm | 210 nm | ||
| 1 | 1st & 2nd | 0.106 | 0.105 | 0.104 |
| 2 | 2nd & 3rd | 0.183 | 0.181 | 0.179 |
| 3 | 1st & 3rd | 0.289 | 0.286 | 0.283 |
| 4 | 2nd & 4th | 0.455 | 0.450 | 0.445 |
| 5 | 1st & 4th | 0.562 | 0.555 | 0.549 |
Table 2. Calculated Results of Modal Interference with Different Heights of NBs
The influence of the surrounding refractive index on TSH patterns is discussed. According to Eq. (2), D is inversely related to (the effective refractive index difference between the fundamental mode and the second-order mode). As the surrounding refractive index increases, the effective refractive index of both the fundamental mode and the second-order mode increases, as shown in Fig. 6. A downward trend of between the two modes with an increasing surrounding refractive index is also obtained. It is reasonable to consider a less optical confinement, which means more fields are spreading into the surrounding area from the NB, for higher-order modes[
![]()
Figure 6.Δneff and D with different surrounding refractive indices. Inside image shows calculated effective index for the fundamental mode and the second-order mode, respectively. The width of the NB is 2 µm.The height of the NB is 200 nm. The pumping wavelength is 1064 nm.
Similarly, the relationship between and the waveguide dimension is also investigated by FDTD simulation, as shown in Fig. 7(a). For example, as the width of the CdS NB increases from 1.0 to 2.0 µm, changes from ∼0.25 to ∼0.05, leading to a ∼ 5 times larger for TSH patterns.
![]()
Figure 7.(a) Δneff and D with different widths of NBs. The pumping wavelength is 1064 nm. (b) Δneff and D at different wavelengths for a 2-µm-wide CdS NB. The height of the NB is 200 nm.
with a different wavelength is also discussed to reveal the characteristic of modal dispersions theoretically, as shown in Fig. 7(b). For a larger pumping wavelength, there is a greater . Combining the fact that both modes have negative dispersions within the near-infrared spectral range, we can deduce that the fundamental mode has a smaller absolute dispersion than the second-order mode.
4. Conclusion
In conclusion, we demonstrate in-situ modal inspection based on direct observation of TSH interference patterns from a single nonlinear CdS NB. Benefitting from subwavelength-scale sectional dimension of the NB, a strong TSH signal is observed. Using the FFT method, TSH interference patterns are analyzed. The experimental results agree well with the calculated results, demonstrating the existence of at least four modes inside the NB. The influence of multimode interference on the TSHG effect inside a single micro/nanowaveguide is discussed in detail. The relationships among the period of TSH patterns, the surrounding refractive index, waveguide dimension, and pumping wavelength are also investigated, respectively, revealing dispersion properties for optical modes. Based on the wavelength conversion process, in-situ modal inspection of infrared propagating light has been demonstrated using a visible imaging system. Since the mechanism for transverse interference patterns can also be other nonlinear processes such as TTHG, the method can be, in principle, operated in micro/nanowaveguides with either second-order nonlinearity or third-order nonlinearity, which may find applications on multimode nanophotonic devices such as optical sensors and correlators.
References
[1] E. Li, X. Wang, C. Zhang. Fiber-optic temperature sensor based on interference of selective higher-order modes. Appl. Phys. Lett., 89, 091119(2006).
[2] L. Li, Q. Lou, J. Zhou, J. Dong, Y. Wei, J. Li. High power low-order modes operation of a multimode fiber laser. Chin. Opt. Lett., 5, 221(2007).
[3] N. Bozinovic, Y. Yue, Y. Ren, M. Tur, P. Kristensen, H. Huang, A. E. Willner, S. Ramachandran. Terabit-scale orbital angular momentum mode division multiplexing in fibers. Science, 340, 1545(2013).
[4] G. Labroille, B. Denolle, P. Jian, P. Genevaux, N. Treps, J.-F. Morizur. Efficient and mode selective spatial mode multiplexer based on multi-plane light conversion. Opt. Express, 22, 15599(2014).
[5] J. E. Hoffman, F. K. Fatemi, G. Beadie, S. L. Rolston, L. A. Orozco. Rayleigh scattering in an optical nanofiber as a probe of higher-order mode propagation. Optica, 2, 416(2015).
[6] V. G. T. A. Maimaiti, M. Sergides, I. Gusachenko, S. N. Chormaic. Higher order microfiber modes for dielectric particle trapping and propulsion. Sci. Rep., 5, 9077(2015).
[7] X. Zhang, R. Chen, Y. Zhou, H. Ming, A. Wang. Mode selective coupler for optical vortices generation. Chin. Opt. Lett., 15, 030008(2017).
[8] Y. Huang, F. Shi, T. Wang, X. Liu, X. Zeng, F. Pang, T. Wang, P. Zhou. High-order mode Yb-doped fiber lasers based on mode-selective couplers. Opt. Express, 26, 19171(2018).
[9] Q. Yuan, L. Fang, Q. Zhao, Y. Wang, B. Mao, V. Khayrudinov, H. Lipsanen, Z. Sun, J. Zhao, X. Gan. Mode couplings of a semiconductor nanowire scanning across a photonic crystal nanocavity. Chin. Opt. Lett., 17, 062301(2019).
[10] Z. Song, X. Yue, Y. Luo, H. Li, Y. Zhao. Absorption saturation measurement using the tapered optical nanofiber in a hot cesium vapor. Chin. Opt. Lett., 17, 031901(2019).
[11] Y. Zhang, H. Li, C. Dai, L. Xu, C. Gu, W. Chen, Y. Zhu, P. Yao, Q. Zhan. All-fiber high-order mode laser using a metal-clad transverse mode filter. Opt. Express, 26, 29679(2018).
[12] K. Foubert, L. Lalouat, B. Cluzel, E. Picard, D. Peyrade, E. Delamadeleine, F. de Fornel, E. Hadji. Near-field modal microscopy of subwavelength light confinement in multimode silicon slot waveguides. Appl. Phys. Lett., 93, 251103(2008).
[13] F. Gesuele, C. X. Pang, G. Leblond, S. Blaize, A. Bruyant, P. Royer, R. Deturche, P. Maddalena, G. Lerondel. Towards routine near-field optical characterization of silicon-based photonic structures: an optical mode analysis in integrated waveguides by transmission AFM-based SNOM. Physica E, 41, 1130(2009).
[14] J. I. Ziegler, M. W. Pruessner, B. S. Simpkins, D. A. Kozak, D. Park, F. K. Fatemi, T. H. Stievater. 3-D near-field imaging of guided modes in nanophotonic waveguides. Nanophotonics, 6, 1141(2017).
[15] G. P. Agrawal. Fiber-Optic Communication Systems(2010).
[16] B. Chen, Q. Bao, L. Tong. Direct observation of multimode interference in rare-earth doped micro/nanofibers. Opt. Express, 27, 26728(2019).
[17] R. Normandin, G. I. Stegeman. Picosecond signal processing with planar, nonlinear integrated optics. Appl. Phys. Lett., 36, 253(1980).
[18] R. Fischer, D. N. Neshev, S. M. Saltiel, A. A. Sukhorukov, W. Krolikowski, Y. S. Kivshar. Monitoring ultrashort pulses by transverse frequency doubling of counterpropagating pulses in random media. Appl. Phys. Lett., 91, 031104(2007).
[19] C. Monat, C. Grillet, M. Collins, A. Clark, J. Schroeder, C. Xiong, J. Li, L. O’Faolain, T. F. Krauss, B. J. Eggleton, D. J. Moss. Integrated optical auto-correlator based on third-harmonic generation in a silicon photonic crystal waveguide. Nat. Commun., 5, 3246(2014).
[20] H. Yu, W. Fang, X. Wu, X. Lin, L. Tong, W. Liu, A. Wang, Y. R. Shen. Single nanowire optical correlator. Nano. Lett., 14, 3487(2014).
[21] F. Gu, L. Zhang, G. Wu, Y. Zhu, H. Zeng. Sub-bandgap transverse frequency conversion in semiconductor nano-waveguides. Nanoscale, 6, 12371(2014).
[22] C. Xin, S. Yu, Q. Bao, X. Wu, B. Chen, Y. Wang, Y. Xu, Z. Yang, L. Tong. Single CdTe nanowire optical correlator for femtojoule pulses. Nano. Lett., 16, 4807(2016).
[23] S. K. Kurtz, T. T. Perry. A powder technique for the evaluation of nonlinear optical materials. J. Appl. Phys., 39, 3798(1968).
[24] I. Shoji, T. Kondo, A. Kitamoto, M. Shirane, R. Ito. Absolute scale of second-order nonlinear-optical coefficients. J. Opt. Soc. Am. B., 14, 2268(1997).
[25] X. Huang, S. Dai, P. Xu, Y. Wang, Q. Yang, Y. Zhang, M. Xiao. Resonant and nonresonant second-harmonic generation in a single cadmium sulfide nanowire. Chin. Opt. Lett., 15, 061901(2017).
[26] A. M. Morales, C. M. Lieber. A laser ablation method for the synthesis of crystalline semiconductor nanowires. Science, 279, 208(1998).
[27] S. Kar, S. Chaudhuri. Cadmium sulfide one-dimensional nanostructures: synthesis, characterization and application. Synth. React. Inorg. M., 36, 289(2006).
[28] C. Xin, H. Wu, Y. Xie, S. Yu, N. Zhou, Z. Shi, X. Guo, L. Tong. CdTe microwires as mid-infrared optical waveguides. Opt. Express, 26, 10944(2018).
[29] D. Vakhshoori, S. Wang. Integrable semiconductor optical correlator, parametric spectrometer for communication systems. J. Lightwave Technol., 9, 906(1991).
[30] R. W. Boyd. Nonlinear Optics(1992).
[31] X. Guo, Y. Ying, L. Tong. Photonic nanowires: from subwavelength waveguides to optical sensors. Accounts Chem. Res., 47, 656(2014).
[32] X. Wu, L. Tong. Optical microfibers and nanofibers. Nanophotonics, 2, 407(2013).

Set citation alerts for the article
Please enter your email address
© Copyright 2018-2021 | Chinese Laser Press. All Rights Reserved 沪ICP备15018463号-20