• Acta Geographica Sinica
  • Vol. 75, Issue 8, 1572 (2020)
Rongjun AO1、2、* and Liang CHANG1、2
Author Affiliations
  • 1Key Laboratory for Geographical Process Analysis & Simulation of Hubei Province, Wuhan 430079, China
  • 2Institute of Sustainable Development, Central China Normal University, Wuhan 430079, China
  • show less
    DOI: 10.11821/dlxb202008002 Cite this Article
    Rongjun AO, Liang CHANG. Influencing mechanism of regional ageing in China based on the Structural Equation Model[J]. Acta Geographica Sinica, 2020, 75(8): 1572 Copy Citation Text show less
    Theoretical framework for the influencing mechanism on regional ageing in China
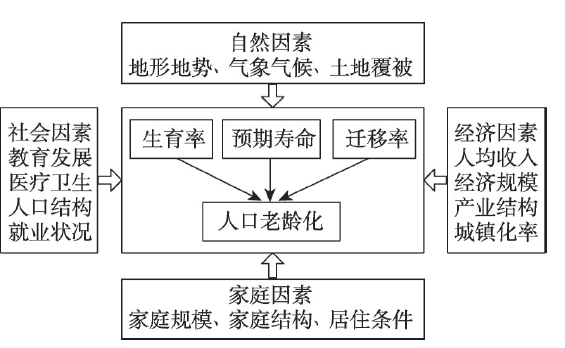
    Fig. 1. Theoretical framework for the influencing mechanism on regional ageing in China
    Distribution of population ageing of China at county level in 2000 and 2010
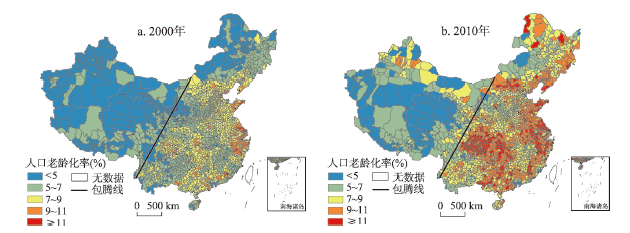
    Fig. 2. Distribution of population ageing of China at county level in 2000 and 2010
    LISA map of population ageing of China at county level in 2000 and 2010
    Fig. 3. LISA map of population ageing of China at county level in 2000 and 2010
    Mechanism and pathway of the factors influencing regional ageing at county level in China
    Fig. 4. Mechanism and pathway of the factors influencing regional ageing at county level in China
    指标2000年2010年
    包腾线以西包腾线以东包腾线以西包腾线以东
    老龄化率7%及以上县区数(个)01032961797
    老龄化率11%及以上县区数(个)0271350
    国土面积占比(%)48.3051.7048.3051.70
    老年人口数量占比(%)2.9297.083.5596.45
    老年人口集中度0.061.880.071.87
    Table 1. Comparison of concentration of the elderly population on both sides of Baotou-Tengchong Line in China
    指标统计量适配标准或临界值包腾线东部模型包腾线西部模型
    绝对适配度指数卡方值(CMIN)P > 0.05,越小越好2.423(P = 0.120)2.576(P = 0.108)
    卡方/自由度(CMIN/DF)0~32.4232.576
    近似误差均方根(RMSEA)< 0.05,越小越好0.0190.049
    拟合优度指数(GFI)> 0.90,越接近于11.0000.999
    调整的拟合优度指数(AGFI)> 0.90,越接近于10.9920.956
    增值适配度指数规范拟合指数(NFI)> 0.90,越接近于11.0000.999
    增值指数(IFI)> 0.90,越接近于11.0000.999
    不规范拟合指数(TLI)> 0.90,越接近于10.9950.964
    Table 2. Goodness-of-fit-test for the SEM
    影响因素效应生育率预期寿命净迁移率老龄化率
    生育率总体----0.302*
    预期寿命总体---0.371*
    迁移率总体----0.616*
    人均收入水平总体0.062*0.147*0.157*0.022*
    直接0.062*0.147*0.157*0.083*
    间接----0.061*
    城镇化水平总体-0.375*0.146*0.404*-0.137*
    直接-0.375*0.146*0.404*-0.056*
    间接----0.081*
    医疗卫生条件总体-0.083*-0.009-0.150*0.136
    直接-0.083*-0.009-0.150*0.022
    间接---0.114
    人口受教育程度总体-0.194*0.216*0.204*0.051**
    直接-0.194*0.216*0.204*0.038**
    间接---0.013**
    人口民族结构总体0.096*-0.159*-0.044**-0.024*
    直接0.096*-0.159*-0.044**0.037*
    间接----0.060*
    居民家庭结构总体-0.012-0.0100.094*-0.065
    直接-0.012-0.0100.094*-0.007
    间接----0.058
    家庭居住条件总体-0.0150.248*-0.288*0.536*
    直接-0.0150.248*-0.288*0.262*
    间接---0.274*
    地形起伏度总体0.204*-0.241*0.037**-0.074*
    直接0.204*-0.241*0.037**0.100*
    间接----0.174*
    温热指数总体-0.063*0.289*-0.082*-0.014*
    直接-0.063*0.289*-0.082*-0.191*
    间接---0.177*
    Table 3. Direct, indirect and total effects of influencing factors on regional ageing (Local model of east of B-T Line)
    影响因素效应生育率预期寿命净迁移率老龄化率
    生育率总体---0.114**
    预期寿命总体---0.440*
    迁移率总体---0.027
    人均收入水平总体0.0040.192*0.027-0.010**
    直接0.0040.192*0.027-0.096**
    间接---0.086**
    城镇化水平总体-0.485*0.217*0.003-0.052
    直接-0.485*0.217*0.003-0.092
    间接---0.040
    医疗卫生条件总体-0.0010.0570.0850.005
    直接-0.0010.0570.085-0.022
    间接---0.027
    居民家庭结构总体0.103**-0.0140.116**-0.063
    直接0.103**-0.0140.116**-0.071
    间接---0.009
    家庭居住条件总体-0.178*0.306*0.0160.361*
    直接-0.178*0.306*0.0160.246*
    间接---0.115*
    温热指数总体-0.298*-0.156*-0.032-0.045
    直接-0.298*-0.156*-0.0320.059
    间接----0.104
    Table 4. Direct, indirect and total effects of influencing factors on regional ageing (Local model of west of B-T Line)
    Rongjun AO, Liang CHANG. Influencing mechanism of regional ageing in China based on the Structural Equation Model[J]. Acta Geographica Sinica, 2020, 75(8): 1572
    Download Citation